Key Points:
- The Canadian labour market weakened in 2023, but from a strong starting point. Canadian job postings declined steadily and were down 29% year-over-year in mid-November, contributing to a slow pace of hiring.
- Projections call for weak growth to continue, but a spike in unemployment could still be avoided if layoff rates — 24% below their pre-pandemic average as of October — stay low.
- Strong foreign interest in Canadian job postings from abroad suggests population growth will remain high, but uncertain, due to both policy and economic reasons.
- Wage growth has held fairly elevated despite some of its underlying drivers waning — the October Indeed Wage Tracker showing posted wage growth running at 4.4% year-over-year — but recouping purchasing power from the earlier jump in inflation will likely remain challenging.
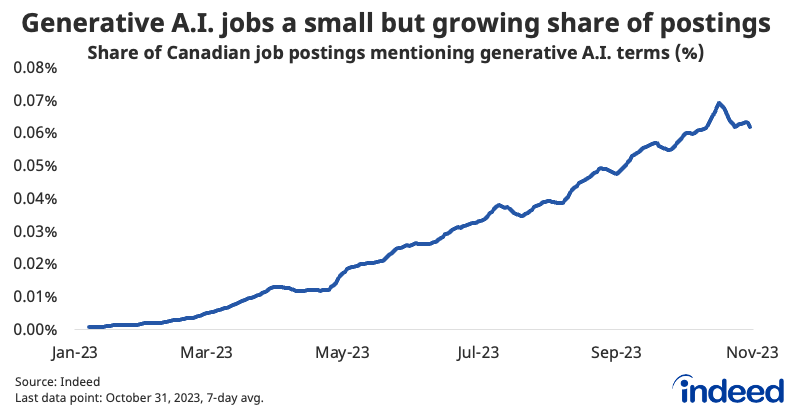
- How the market adapts to and implements new artificial intelligence tools will be the major structural trend to watch in 2024. This includes Canadian tech’s contribution to the development of the tools themselves, evident in the small but rising share of job postings mentioning generative artificial intelligence, but more importantly, its potential widespread application across the labour market.
By several metrics, the Canadian labour market began 2023 in exceptional shape. Conditions have softened since, as the economy has slowed and job openings continued to normalize from their earlier surge. Against this backdrop, here are the key trends likely to shape the Canadian job market in 2024:
- Hiring appetite might continue to soften, but a jump in layoffs and unemployment could be avoided if the economy doesn’t tip into recession.
- Population growth from abroad looks to remain elevated after a record year, translating to labour force growth, though the ultimate pace ahead is highly uncertain.
- Nominal wage growth has held strong even as some of its underlying drivers have cooled. Inflation-adjusted wages have edged up recently, but further gains will require additional “immaculate disinflation,” which could be harder to come by in 2024.
- Though still early, the impact of generative artificial intelligence, both in the tech sector and the broader economy, is likely to become more noticeable in the year ahead.
Unemployment has edged up
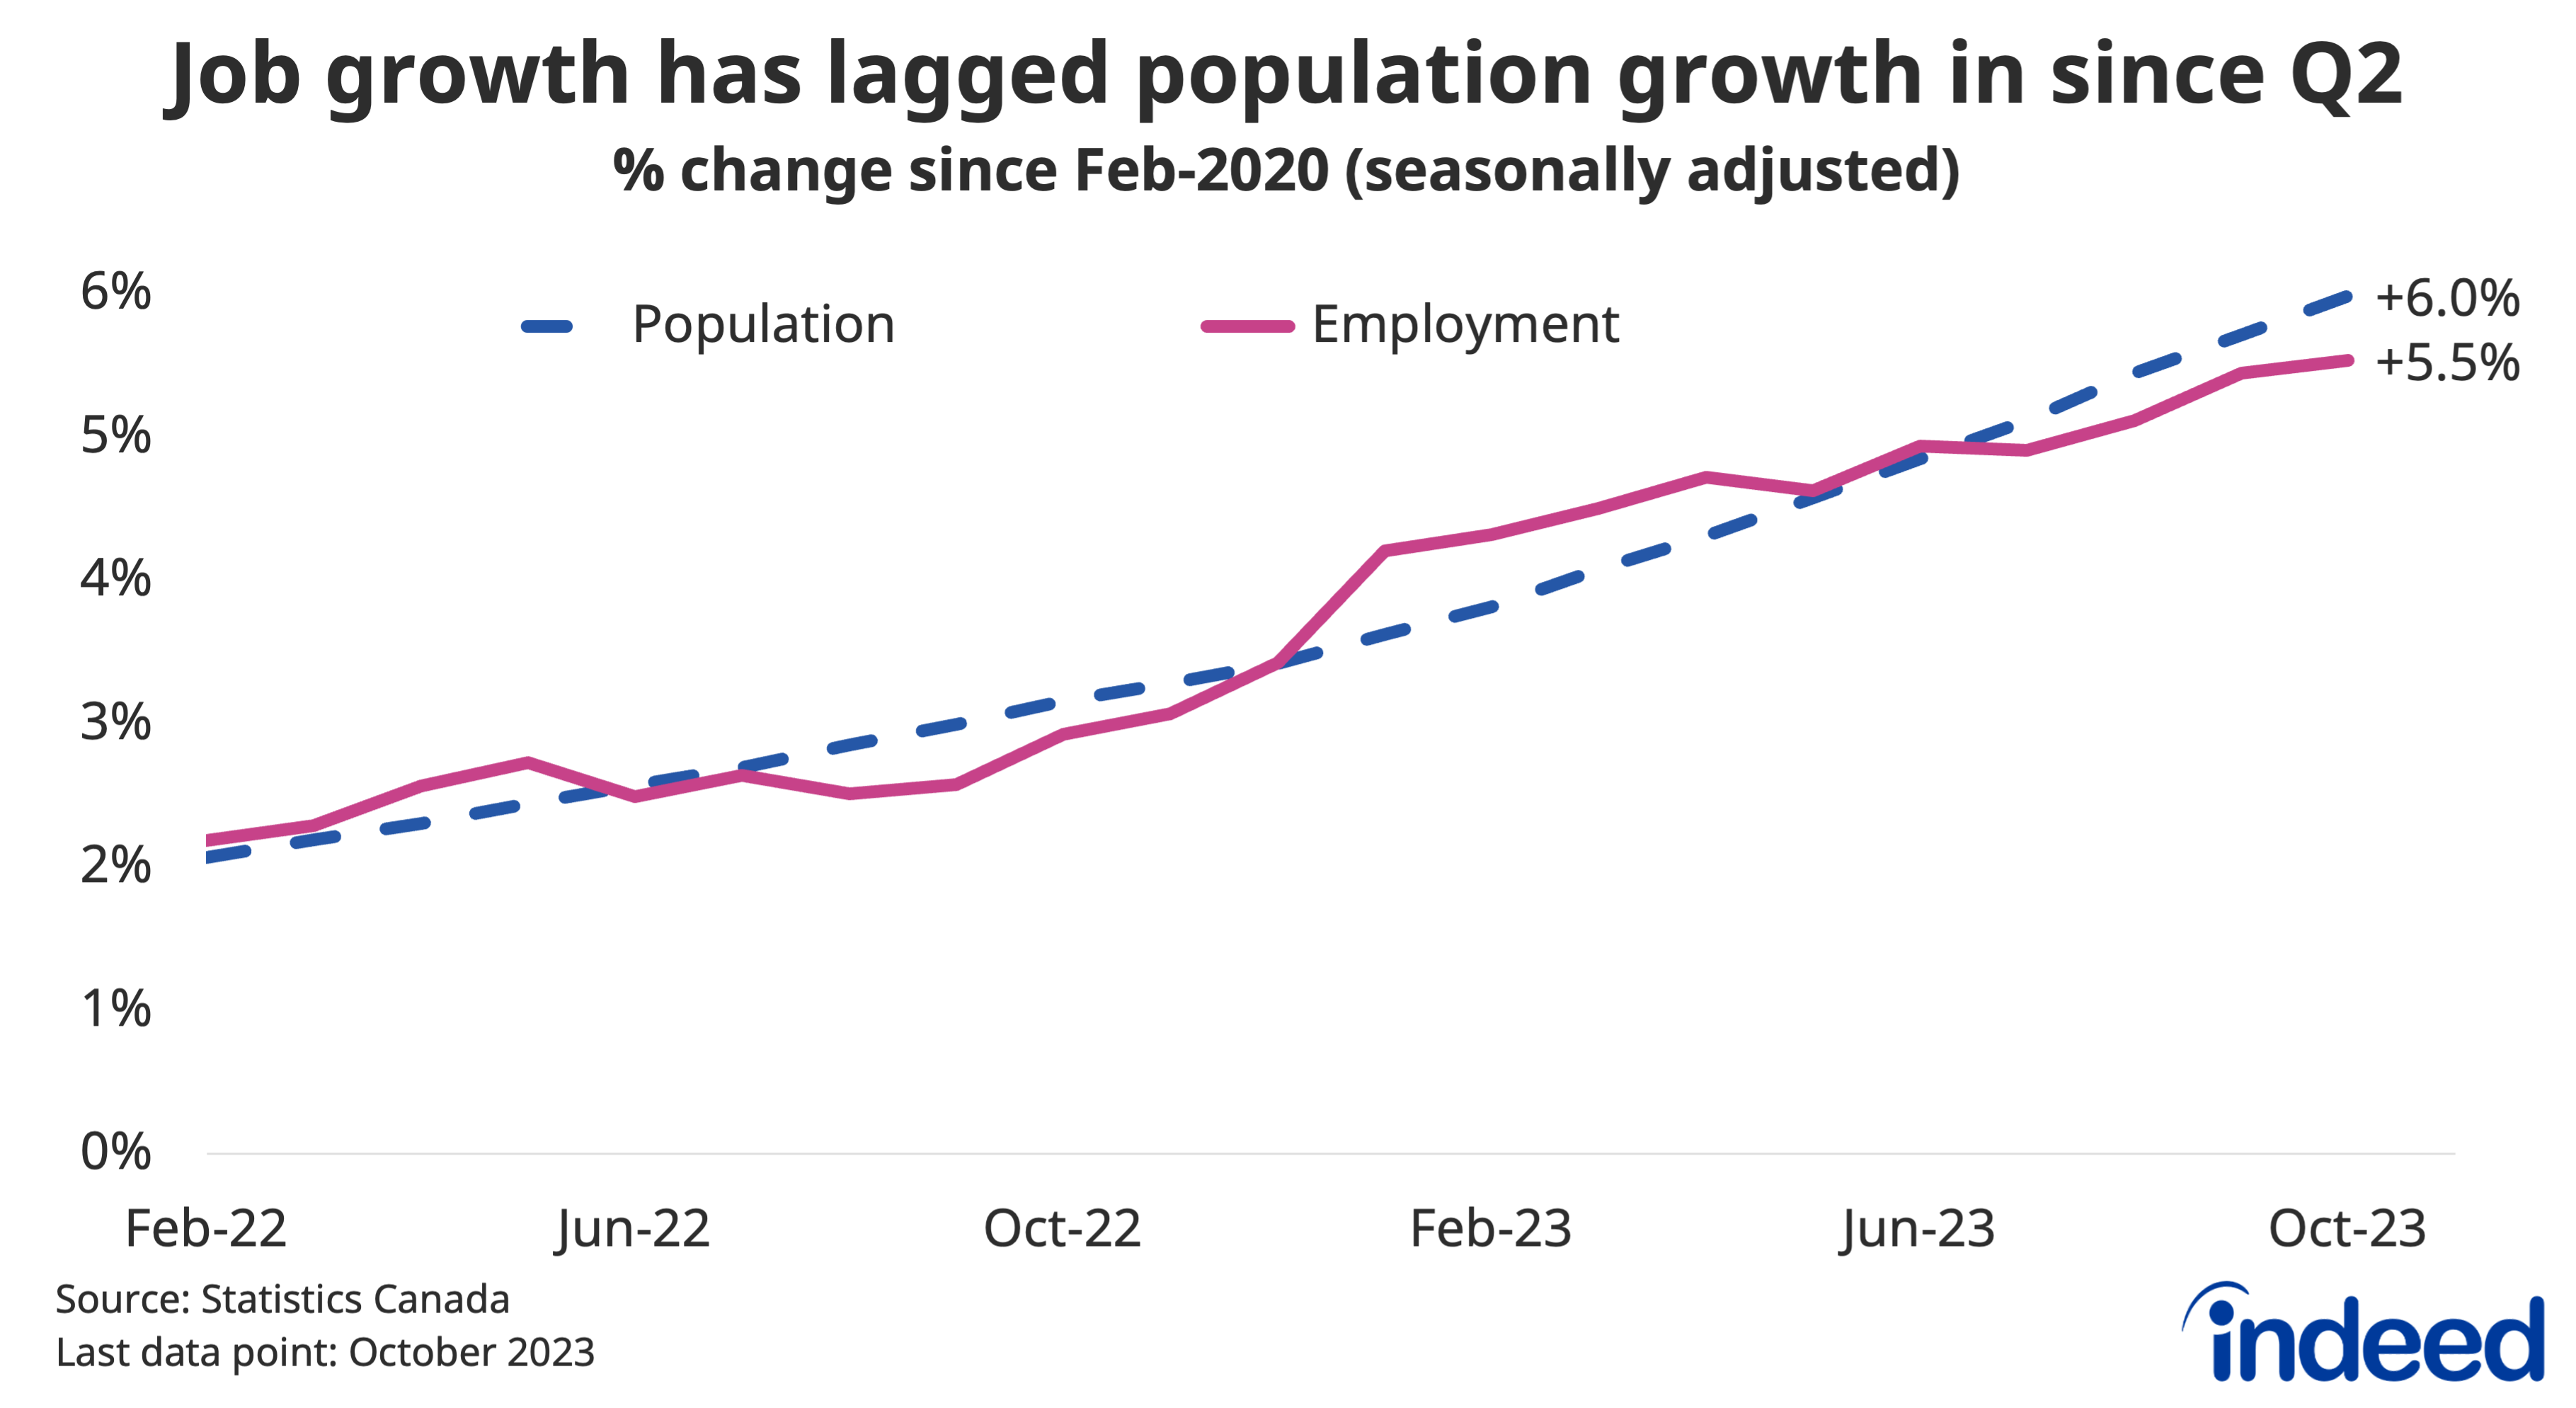
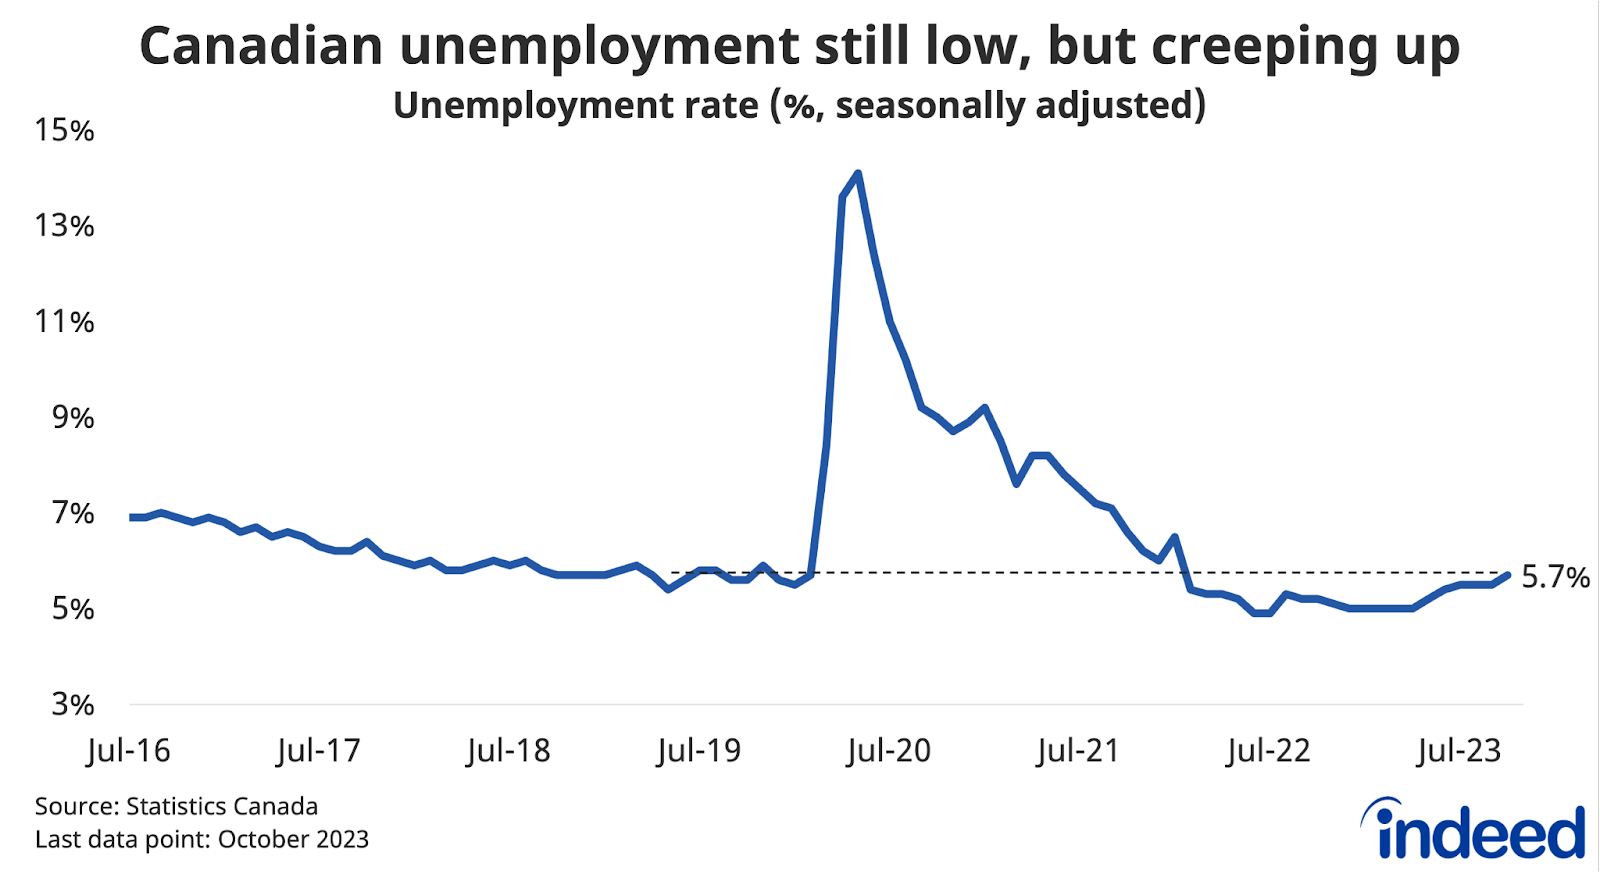
The Canadian economy stalled in mid-2023, and the labour market took a modest hit. While employment grew 0.8% (1.6% annualized) over the 6 months through October, according to the Labour Force Survey (LFS), that was only half the pace of population growth over the same period. As a result, the unemployment rate has risen from a near-record low of 5.0% in Q1 2023, to 5.7% in October. Similarly, the number of recipients of regular EI benefits, while still low, has crept up since the start of the year.
Most labour market metrics still look solid by historical standards, but they’ve been edging in the wrong direction. Below, we’ll take a deeper look at the trends we expect to drive the market in 2024.
- Recession or no recession? That’s the key question
GDP and employment might not march in lock-step, but they’re still inextricably linked. The principal question for the 2024 labour market is whether the overall economy continues to trudge along at near-zero growth, or deteriorates more significantly. Forecasters generally expect the former, but many households and businesses tell surveys they’re concerned the full impact of the rate hike cycle hasn’t been felt.
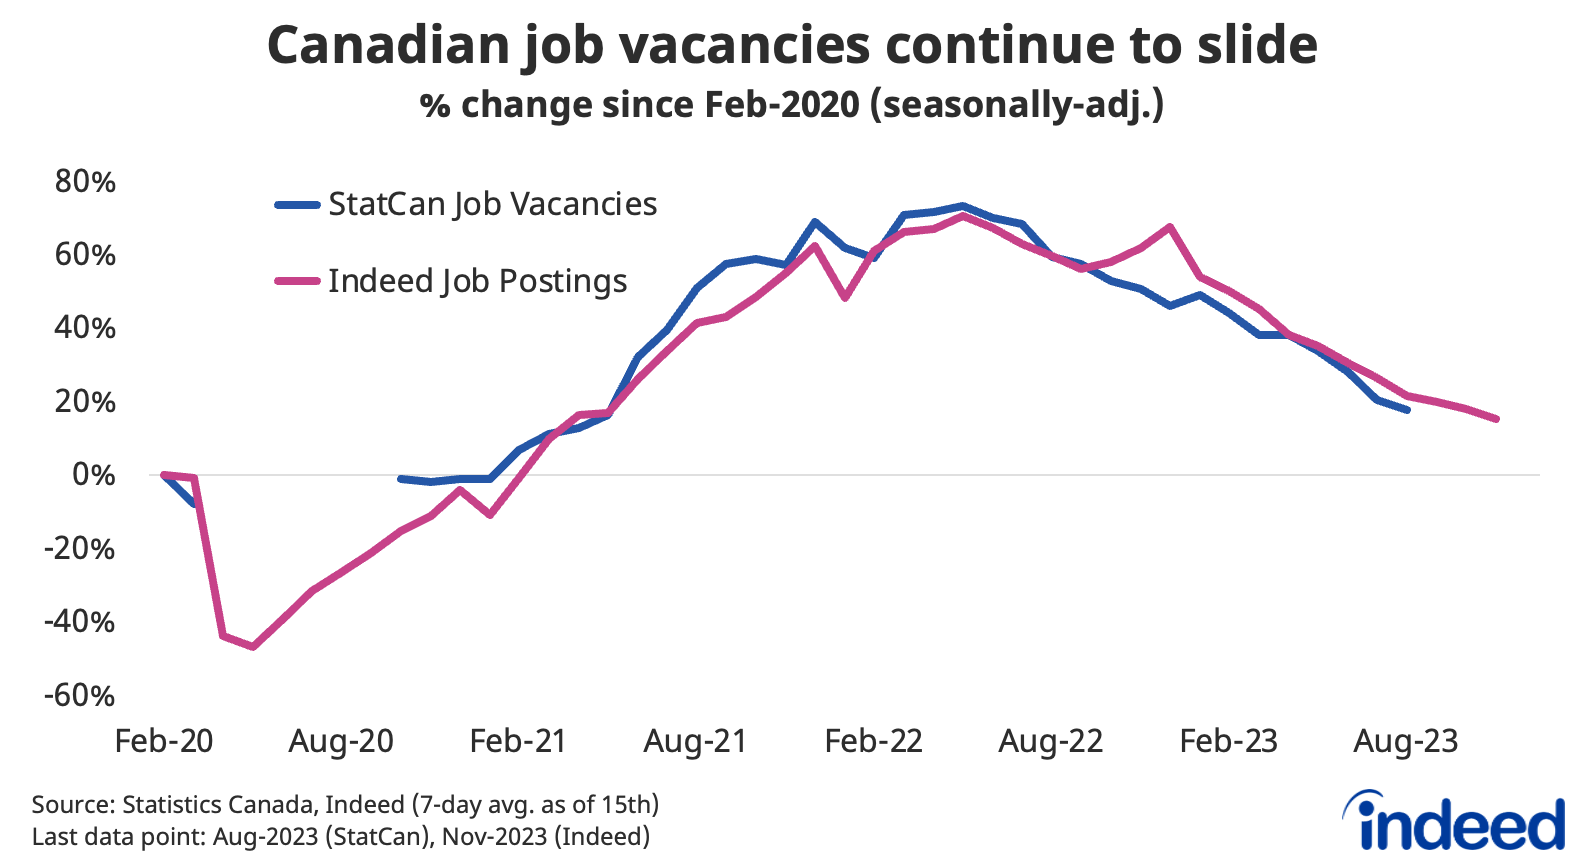
Muddling along would likely come with further declines in employer recruiting activity. Both Statistics Canada job vacancies and Canadian job postings on Indeed fell throughout 2023 across most sectors, and were down 26% and 29% year-over-year as of August and mid-November, respectively. Job postings remain 17% above pre-pandemic levels, owing to their exceptionally high peak in early 2022, and their relatively gradual pace of decline since, but there are no signs of near-term reversal in the trend.
While the drop in job postings on Indeed has been widespread, the shift has been more pronounced among some occupational sectors. As of early November, many of the jobs experiencing the sharpest declines in postings compared to a year earlier were in tech-related fields including software development, IT operations, and information design. Other sectors with outsized drops included driving, loading and stocking, and food service, the latter two from quite elevated levels.
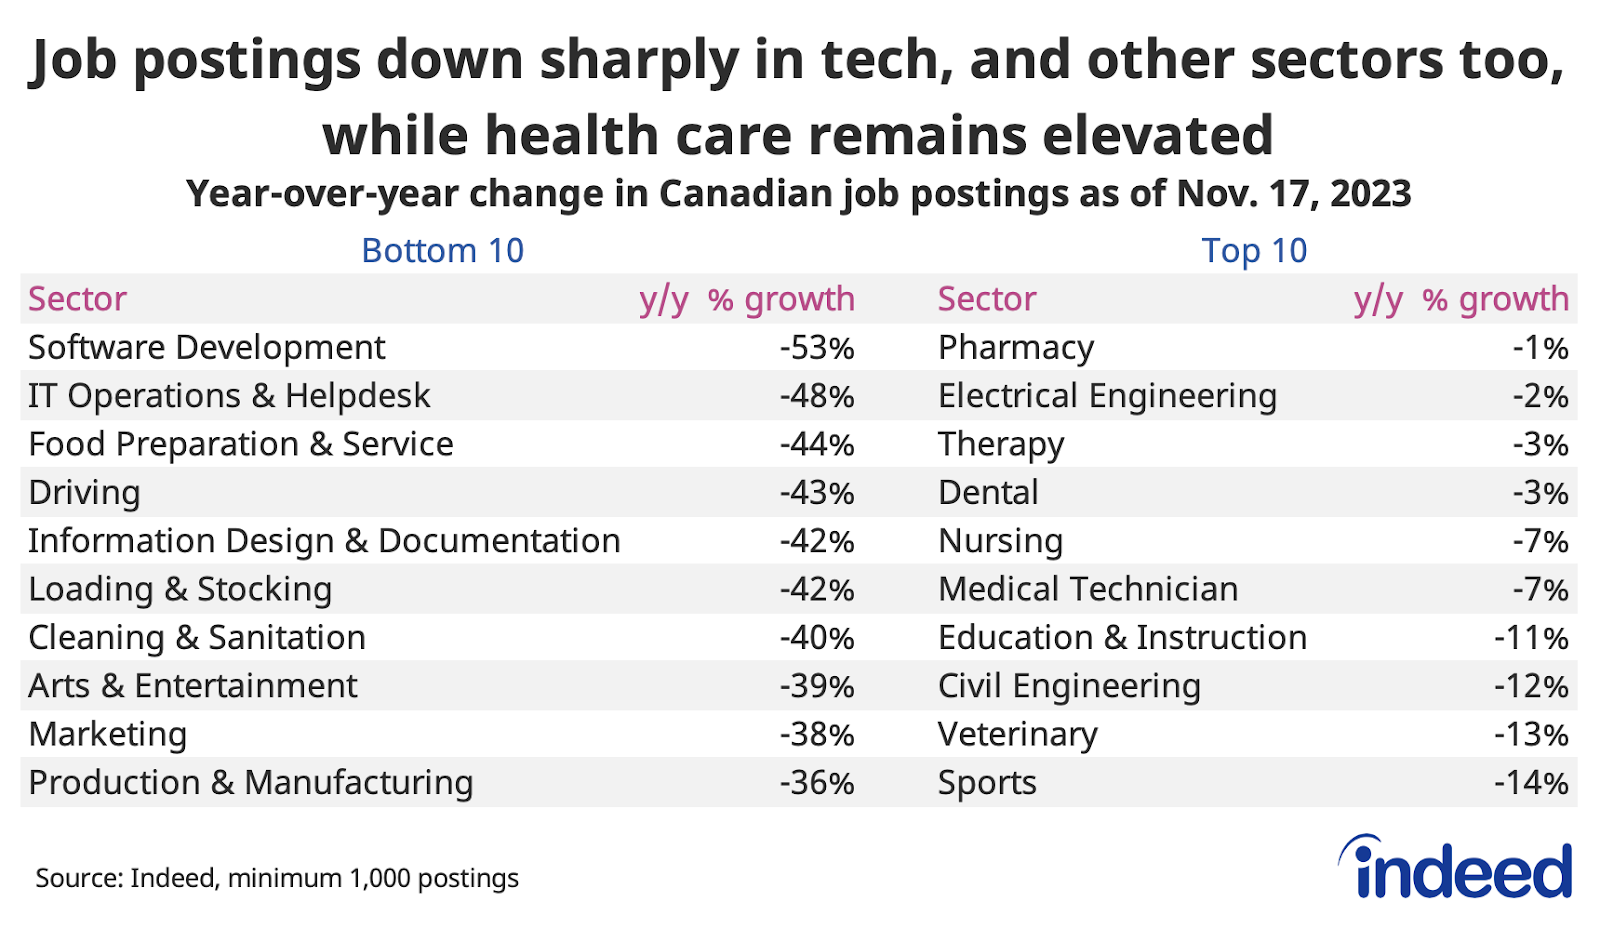
Hiring appetite has been steadier over the past year in healthcare and education. Household demand for these services is less cyclical than other sectors, instead influenced by other forces like population aging. And because the public sector is so heavily involved in both, private sector pessimism doesn’t diminish employer demand in these industries as much as in the rest of the economy.
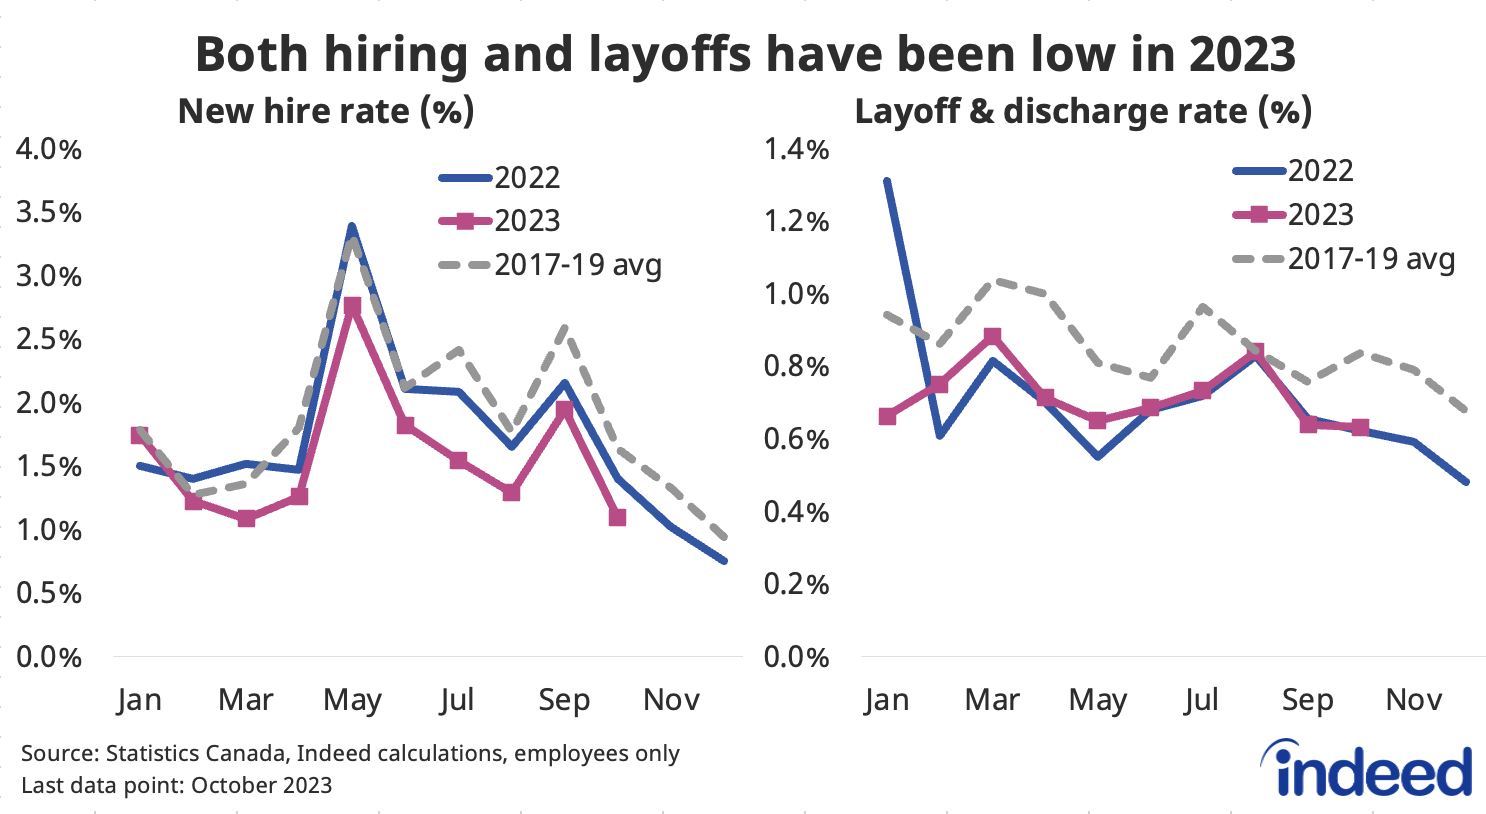
The overall drop in hiring recruiting activity has already had subtle impacts on the labour market. The rate of new jobs being started has been slow since February, the average duration of unemployment has ticked up, and youth employment rates have slipped. Helping keep the situation from going off the rails have been low layoff and discharge rates, which in October were 24% below their 2017-2019 according to the LFS. That said, a more significant economic downturn would likely cause job losses to jump, making layoffs a key metric to watch in 2024.
- International migration to Canada will likely be elevated, but uncertain
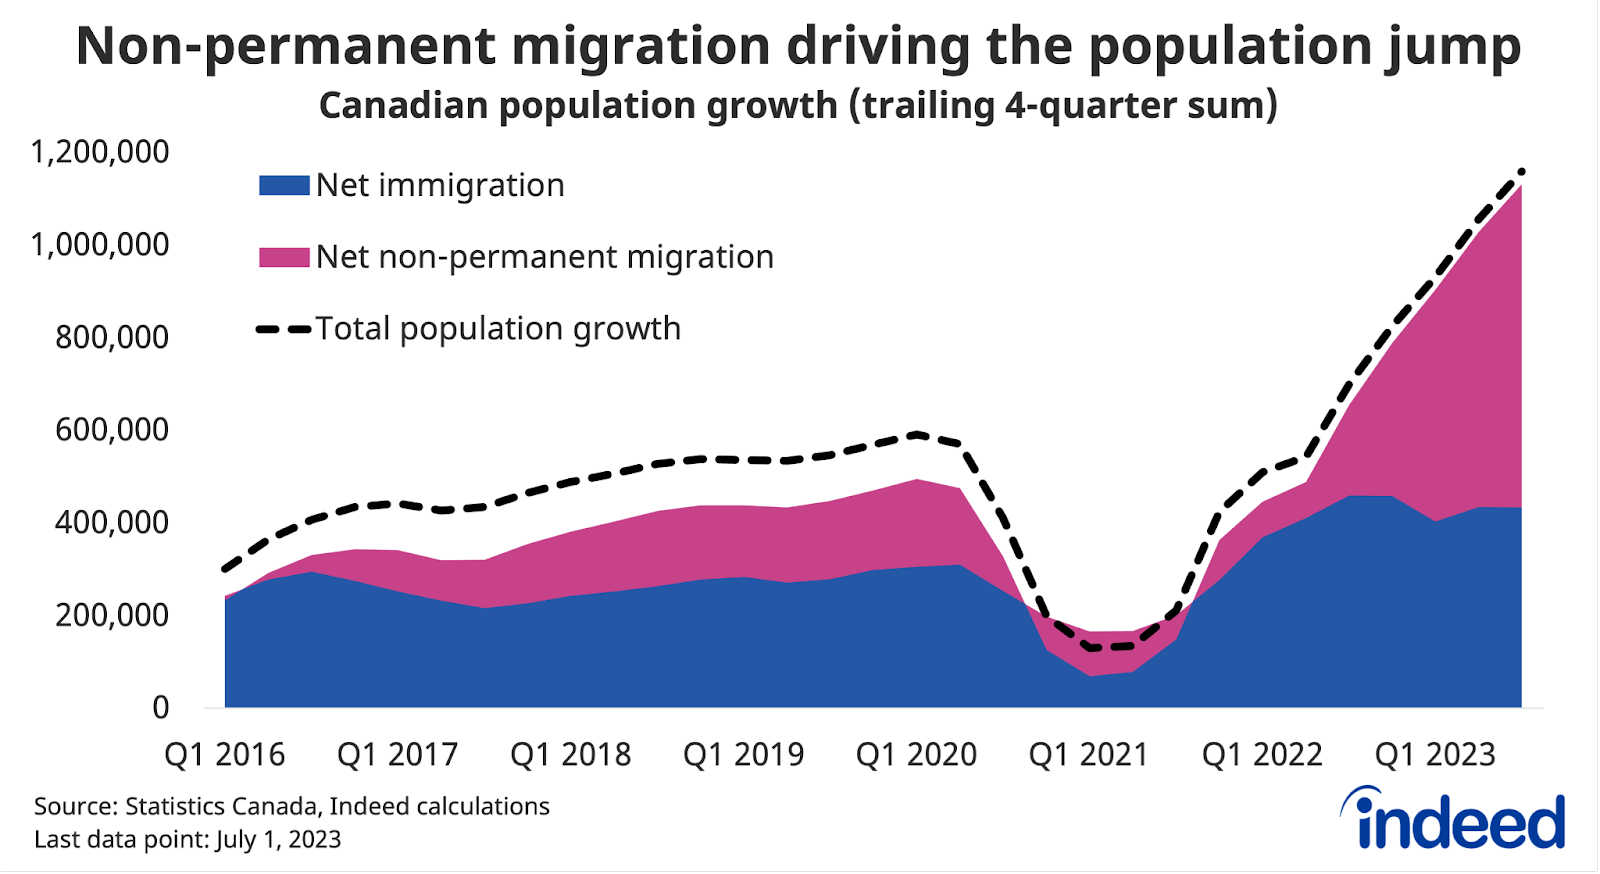
The Canadian population has soared since early 2022, essentially driven entirely by international migration, but the pace ahead is uncertain. While the federal government sets clear targets for permanent resident admissions, the recent surge in newcomers has been driven by those with temporary work and study visas, which don’t have set targets.
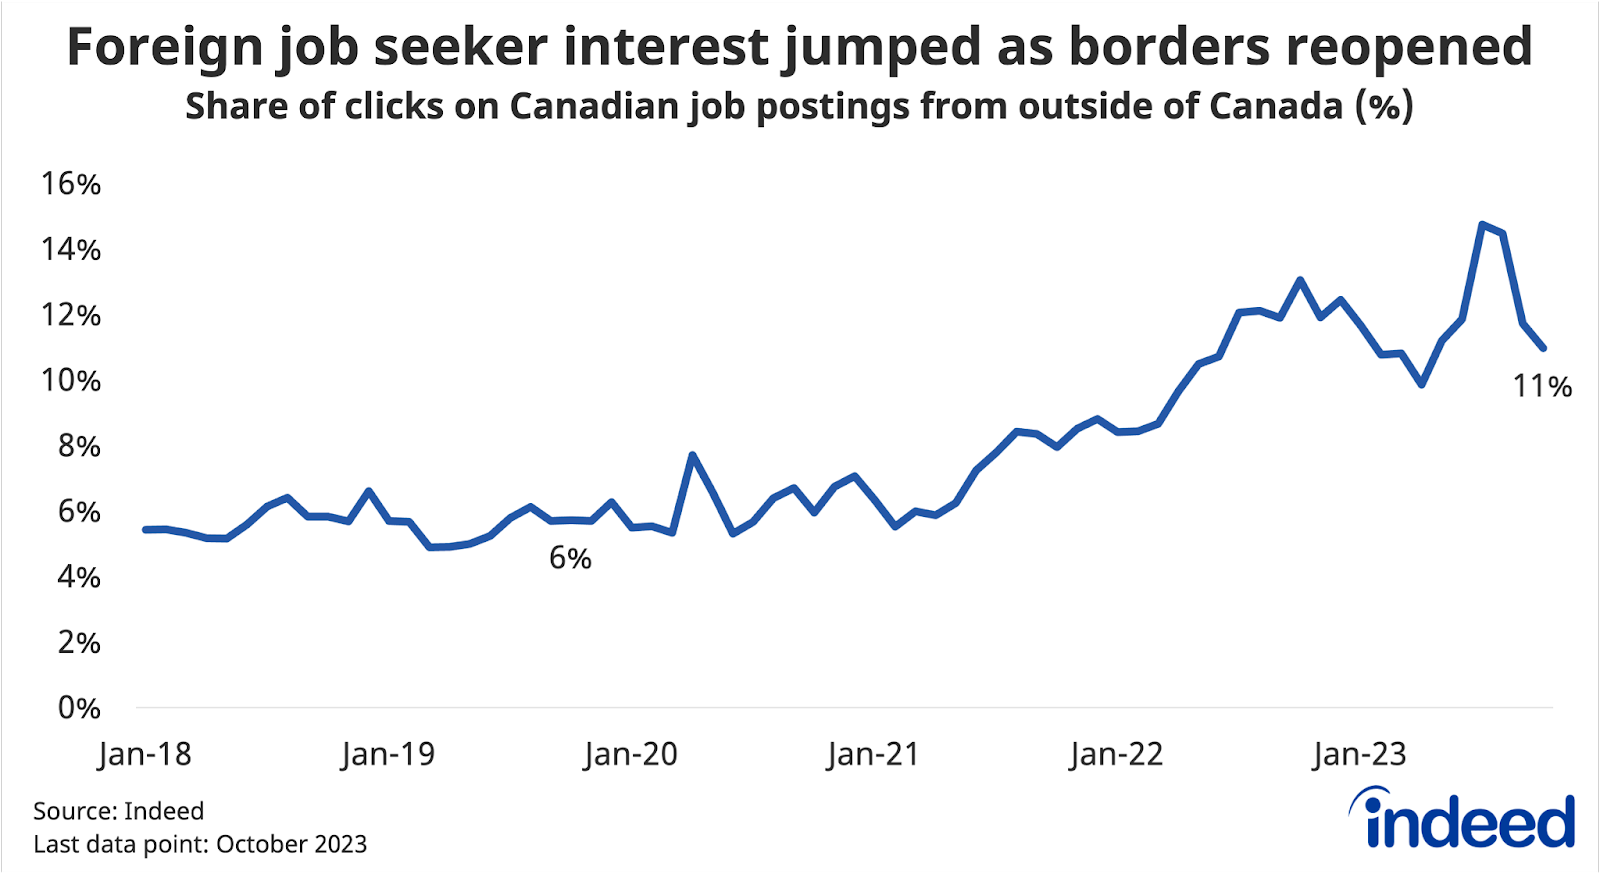
Foreign job seeker interest on Indeed has jumped along with international migration. The share of clicks on Canadian job postings coming from abroad rose from 6% to 14% between 2019Q3 and 2023Q3, before falling back to 11% this October. The slight downtick over the past two months could mean a potential slowdown to come. But foreign job seeker interest is still elevated compared to historic norms, suggesting inflows of newcomers will remain so too, at least in the near term.
International migration both impacts the economy and is also impacted by it. Canadian job postings have been declining somewhat faster than in the US, and while the US economy has been stronger in general, higher rates of migration to Canada could also be helping employers fill job openings faster. At the same time, if Canada’s economic situation deteriorates, it may become less attractive to foreign job seekers. A relatively fluid policy situation, including the announced return to a 20-hour work week cap for some international students, combined with an uncertain economic outlook, makes it difficult to predict labour supply growth in the coming year.
- Wages face an uphill battle against inflation
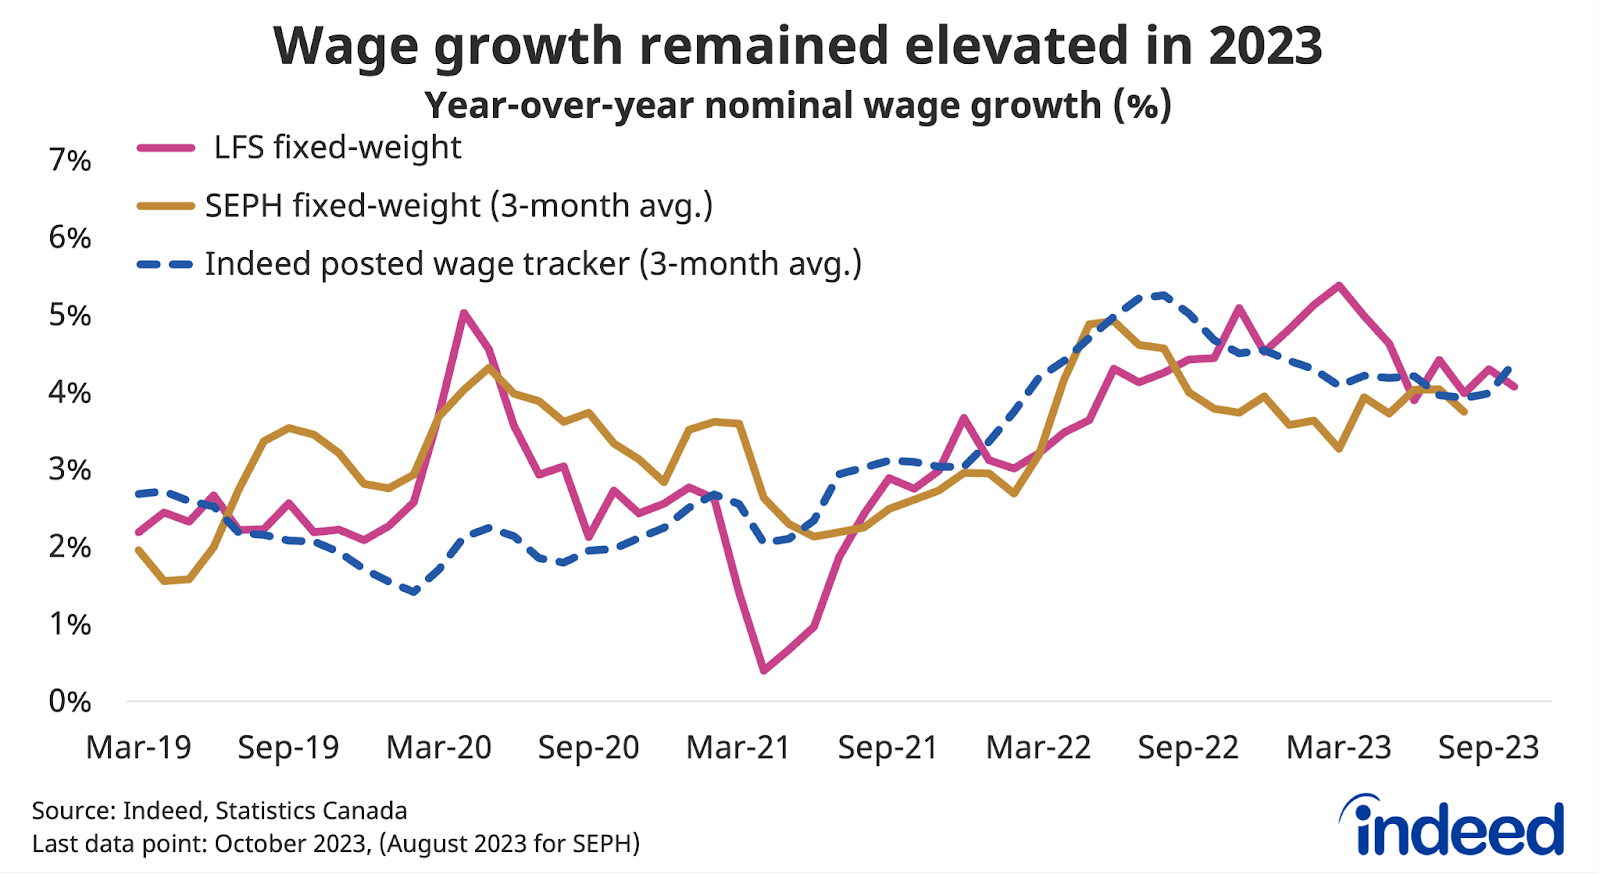
Despite the rise in unemployment and decline in job opportunities, nominal (pre-inflation) Canadian wage growth has been relatively elevated in 2023. According to the latest three-month averages from Statistics Canada, different metrics show hourly earnings growth running between 3.7% and 4.9% year-over-year. Meanwhile, the Indeed Wage Tracker, which measures growth in wages advertised in job postings, shows average year-over-year growth of 4.4% over the three months through October, down from mid-2022, but still above its pre-pandemic pace.
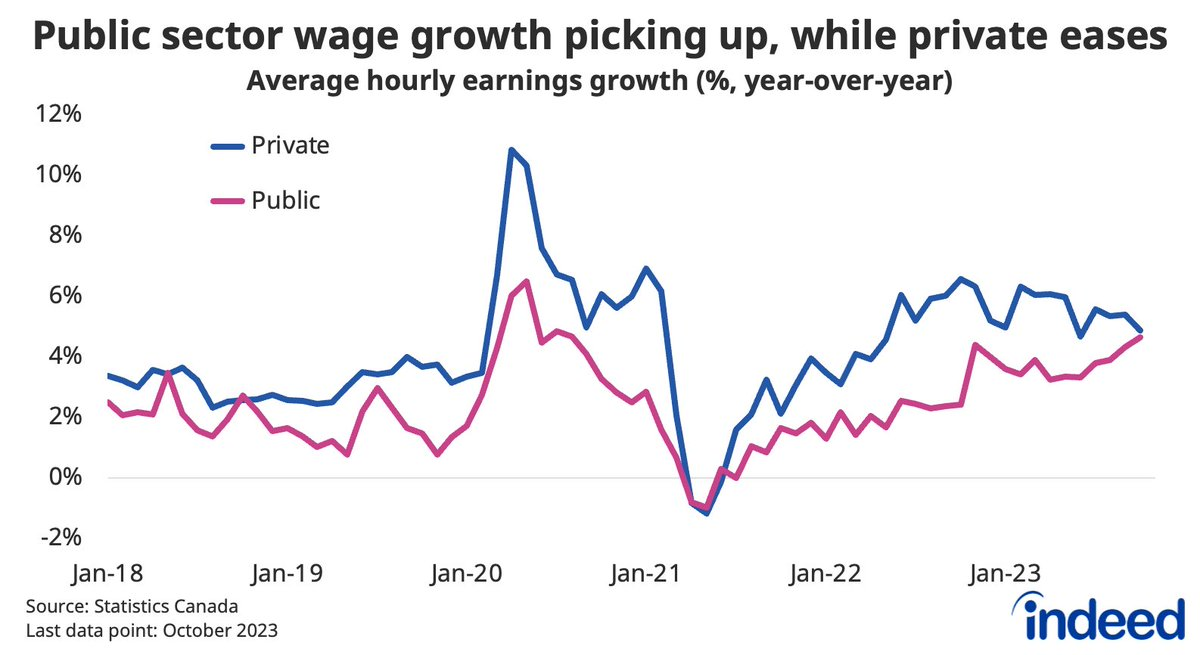
The data suggests the earlier tightening of the Canadian labour market is still working its way through the wage-setting process. Some of the ongoing strength in wages could also reflect a delayed catch-up in cost-of-living increases. This is particularly the case in the public sector, where wage growth in the LFS has accelerated recently, even as private sector wage growth has cooled somewhat.
In contrast to nominal pay, and after accounting for inflation, “real” wages have further to go in clawing back their losses from the jump in cost of living in 2021 and 2022. Jobs-mix adjusted wages in the LFS were up 0.9% year-over-year in October, after falling 1.7% in 2022. How real wages compare to their pre-pandemic levels depends on what measure of pay is being looked at; overall average hourly earnings in the LFS are actually up 2.5% from four years earlier, boosted by a shift in workers from low to high-paying occupations. However, other measures, including wages in the Survey of Employment, Payrolls, and Hours, are flatter after adjusting for inflation, over the same period.
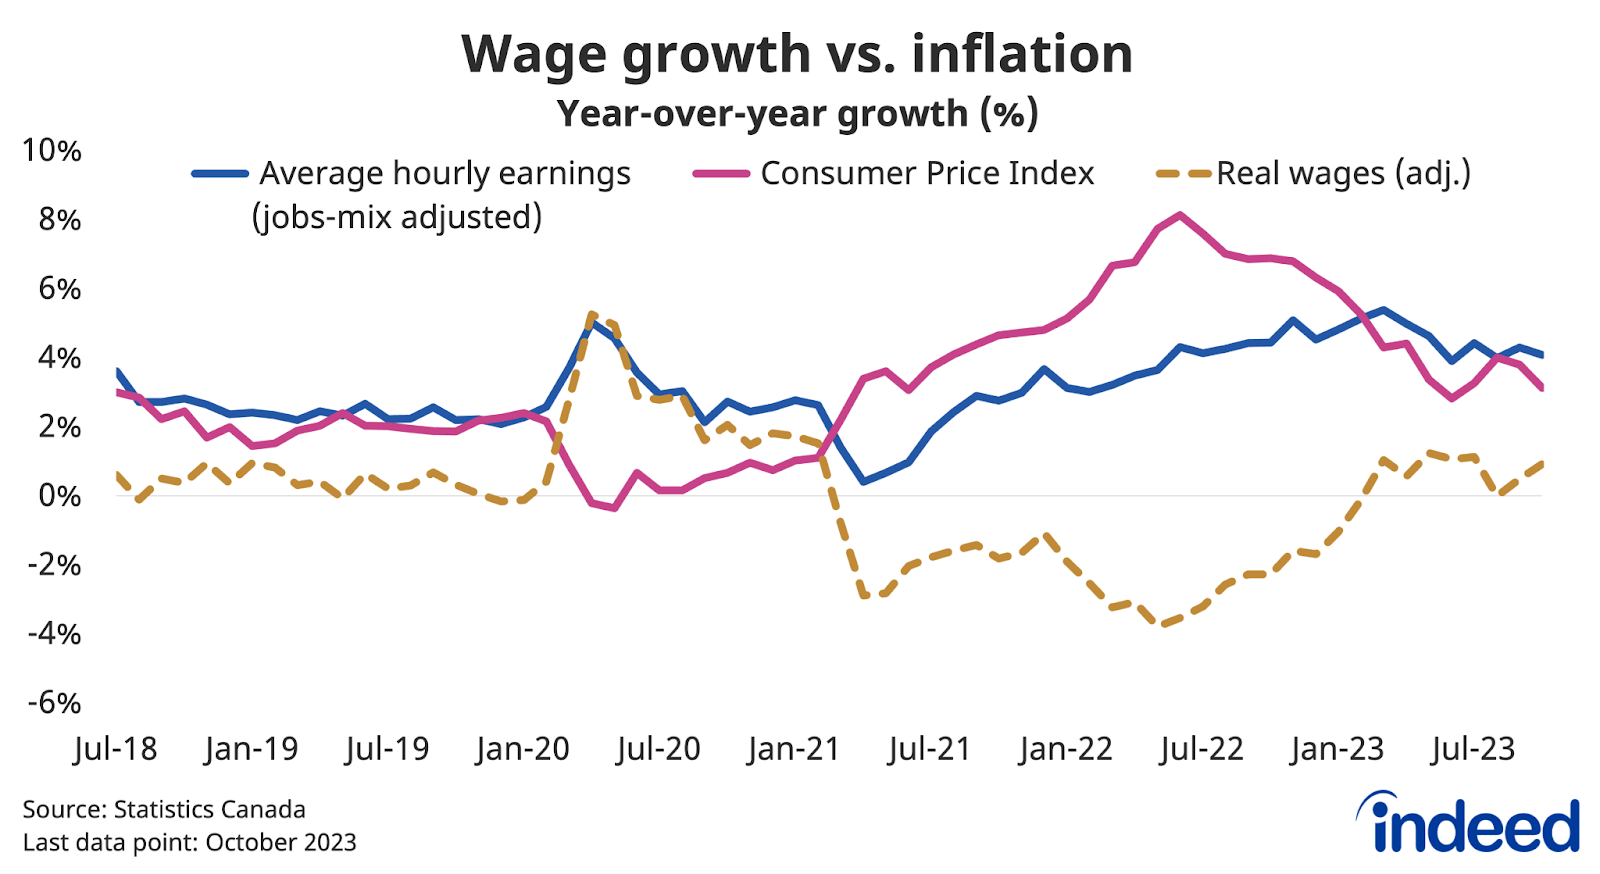
Further growth in price-adjusted earnings will likely require additional easing of inflation while wage growth remains elevated. But this “immaculate disinflation” might become tougher to come by. With labour market conditions no longer as favourable to job seekers, there’s less pressure on employers to continue hiking pay. Meanwhile, there remains the potential for businesses to pass on higher labour costs to prices.
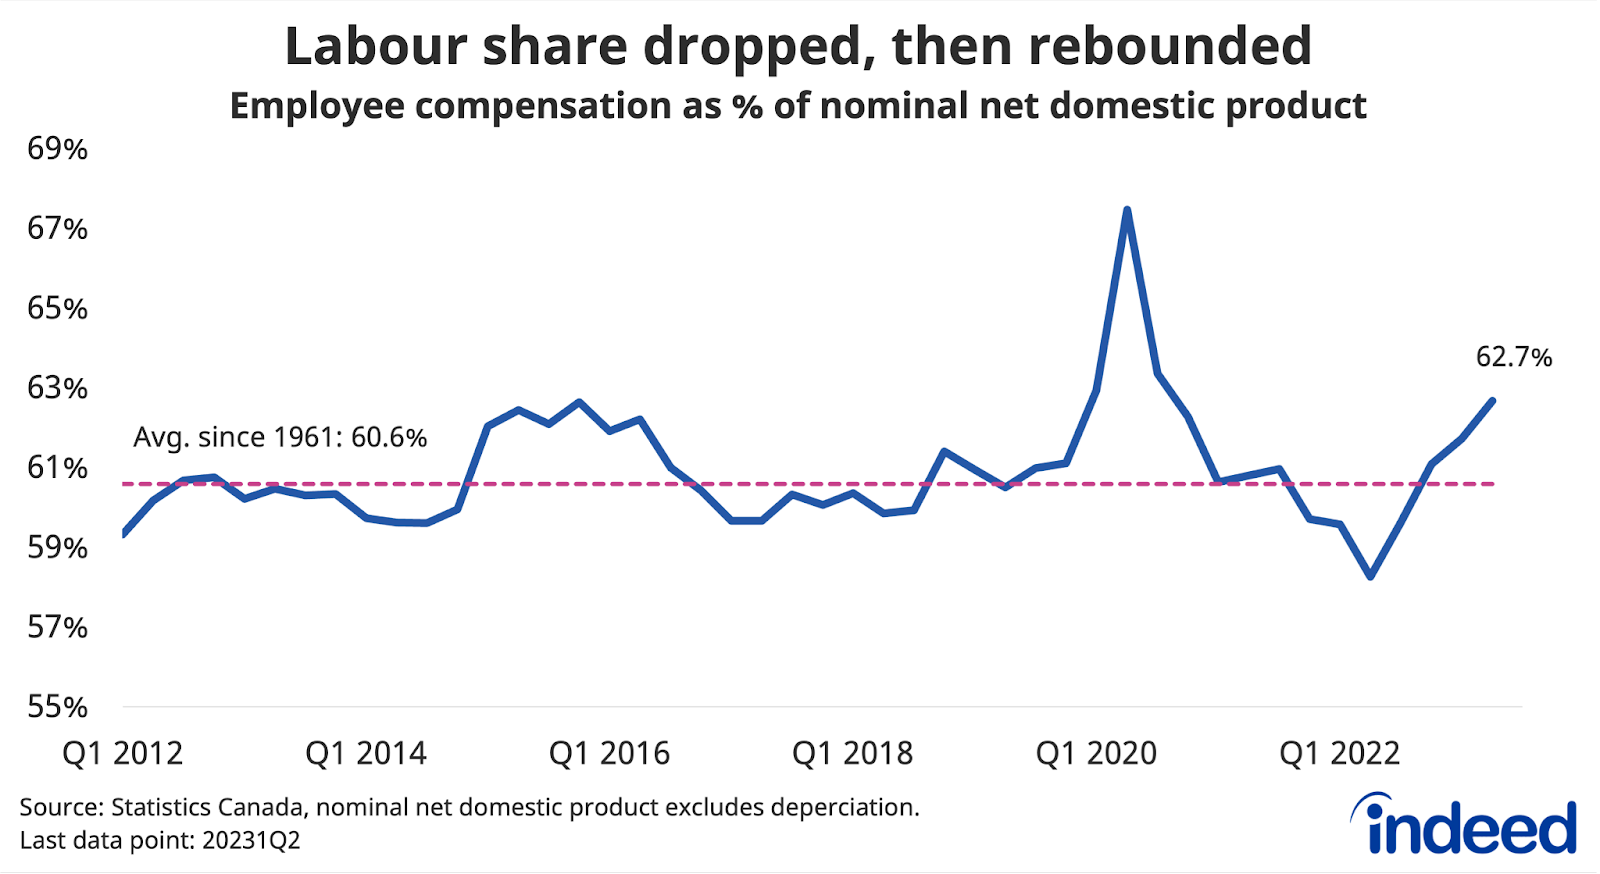
Part of the 2023 improvement in real wages amid stagnant GDP numbers came from a rebound in the labour share of income — that is, the share of GDP (excluding depreciation) going to employee compensation — which bounced back from below to above its long-run average. Absent stronger economic growth, further wage gains at the expense of profit margins could be more difficult to achieve.
- Generative AI has entered the chat
Declining labour productivity has underpinned Canada’s recent weak growth. But 2023 also saw the introduction of potentially the most transformative technology in years: Generative artificial intelligence (GenAI), tools powered by large language models (LLMs), including ChatGPT. The full impact of these new technologies hasn’t yet registered in most official data, but that could change in the year ahead.
First, GenAI will have a direct impact on trends in the tech sector itself. At the end of October, GenAI was mentioned in 0.06% of Canadian job postings on Indeed, a tiny but quickly growing share. Job postings for machine learning engineers, the quintessential AI job, mentioned GenAI in 17% of posts. But while tech jobs are already starting to be changed by the new technology, its potential impacts are so large because of its broader applicability across the economy.
Indeed consulted ChatGPT-4.0’s own stated ability (or inability) to perform the skills found in 48 skill families, based on more than 2,600 individual jobs skills identified in millions of Indeed job postings. We asked ChatGPT to rate its ability — either “poor” “fair” “good” or “excellent” — to perform the skills within each family. We then grouped occupations as either having high, moderate, or low exposure to Gen-AI-driven change based on whether ChatGPT said it could perform 80% or more, 50% to 80%, or less than 50% of skills in a “good” or “excellent” manner.
Overall, 21% of Canadian job postings on Indeed in 2023 were in occupations with high exposure to GenAI-driven change, including jobs in tech, legal services, and accounting. More than half (55%) of postings were determined to be moderately exposed, including jobs in manufacturing and management. Roughly a quarter (24%) of Canadian postings had relatively low exposure, including jobs in driving and personal care.

The substantial overlap between the capabilities of GenAI and various skills used across wide swaths of the labour market highlight the transformative potential of the new technology. Several workplace experiments incorporating tools like Chat GPT involving tasks ranging from coding to customer service have found substantial efficiency gains, and the roll-out is likely just getting started.
At the same time, potential exposure to GenAI doesn’t specify whether and how an occupation might be impacted by the new technology. In certain cases, there’s the potential for GenAI to fully automate tasks, which could have negative implications for some existing workers, many of whom are in jobs previously insulated from the specter of automation. But in others, and perhaps more often, GenAI’s impacts will instead be through the augmentation of jobs, with new technology serving as a tool to improve the productivity of existing workers, hopefully allowing them to focus on more human aspects of a job.
If, how and when GenAI achieves widespread adoption remains an open question, and will be influenced by experimentation, competition among businesses, and the regulatory environment. Moreover, the shifts won’t just be felt through the impacts on existing employees, but also on the types of jobs employers do (or do not) create.
Many of the occupations in which job postings have fallen the most over the past year are also those that face a high level of exposure to GenAI, including in tech, marketing, banking, and human resources. Postings in these fields were generally already declining prior to the introduction of the tools in late 2022, suggesting the arrival of GenAI on its own wasn’t the main driver of their outsized declines since. Nonetheless, the impacts could become more apparent in the coming year, both by weighing on employer hiring appetite for some jobs, and creating demand for others.
Conclusion
An uncertain macroeconomic environment looms over the Canadian labour market going into 2024, similar to the start of 2023. Conditions softened throughout this year, but didn’t go off the rails, even as GDP growth flatlined. Wage growth held solid and inflation cooled, though recent gains are still contending with the earlier loss in purchasing power.
All of these moving parts, along with the economy’s ongoing adjustment to the higher interest rate environment, will remain front and center of labour market trends in the year ahead. Behind the scenes, Canada’s population growth seems likely to remain elevated for now, boosting both labour supply and some facets of demand, but is still a wildcard in 2024. Meanwhile, the presence of GenAI will become more noticeable, though the specific ways that happens will be unpredictable.
Methodology
All job postings figures in this blog post are the index of seasonally-adjusted Canadian job postings on Indeed re-based to February 1, 2020, using a seven-day trailing average. February 1, 2020, is our pre-pandemic baseline. We seasonally adjust each series based on historical patterns in 2017, 2018, and 2019. Each series, including the national trend, occupational sectors, and sub-national geographies, is seasonally adjusted separately. This week, we applied our quarterly revision, which updates seasonal factors and fixes data anomalies. Historical numbers have been revised and may differ from originally reported values. New job postings are posts that are seven days old or less.
The number of job postings on Indeed, whether related to paid or unpaid job solicitations, is not indicative of potential revenue or earnings of Indeed, which comprises a significant percentage of the HR Technology segment of its parent company, Recruit Holdings Co., Ltd. Job posting numbers are provided for information purposes only and should not be viewed as an indicator of performance of Indeed or Recruit. Please refer to the Recruit Holdings investor relations website and regulatory filings in Japan for more detailed information on revenue generation by Recruit’s HR Technology segment.
To calculate fixed-weight wage growth in the LFS, we bucket LFS microdata for each of the 43 occupation groups into three levels of job tenure (6 months or less, 7 to 24 months, and 25 months and over), and recalculate headline average wages into a composition-adjusted measure by holding their respective weights constant at February 2020 levels.
For more information on how we assessed the exposure of different occupations to generative artificial intelligence, please refer to the methodology note.