Key Points:
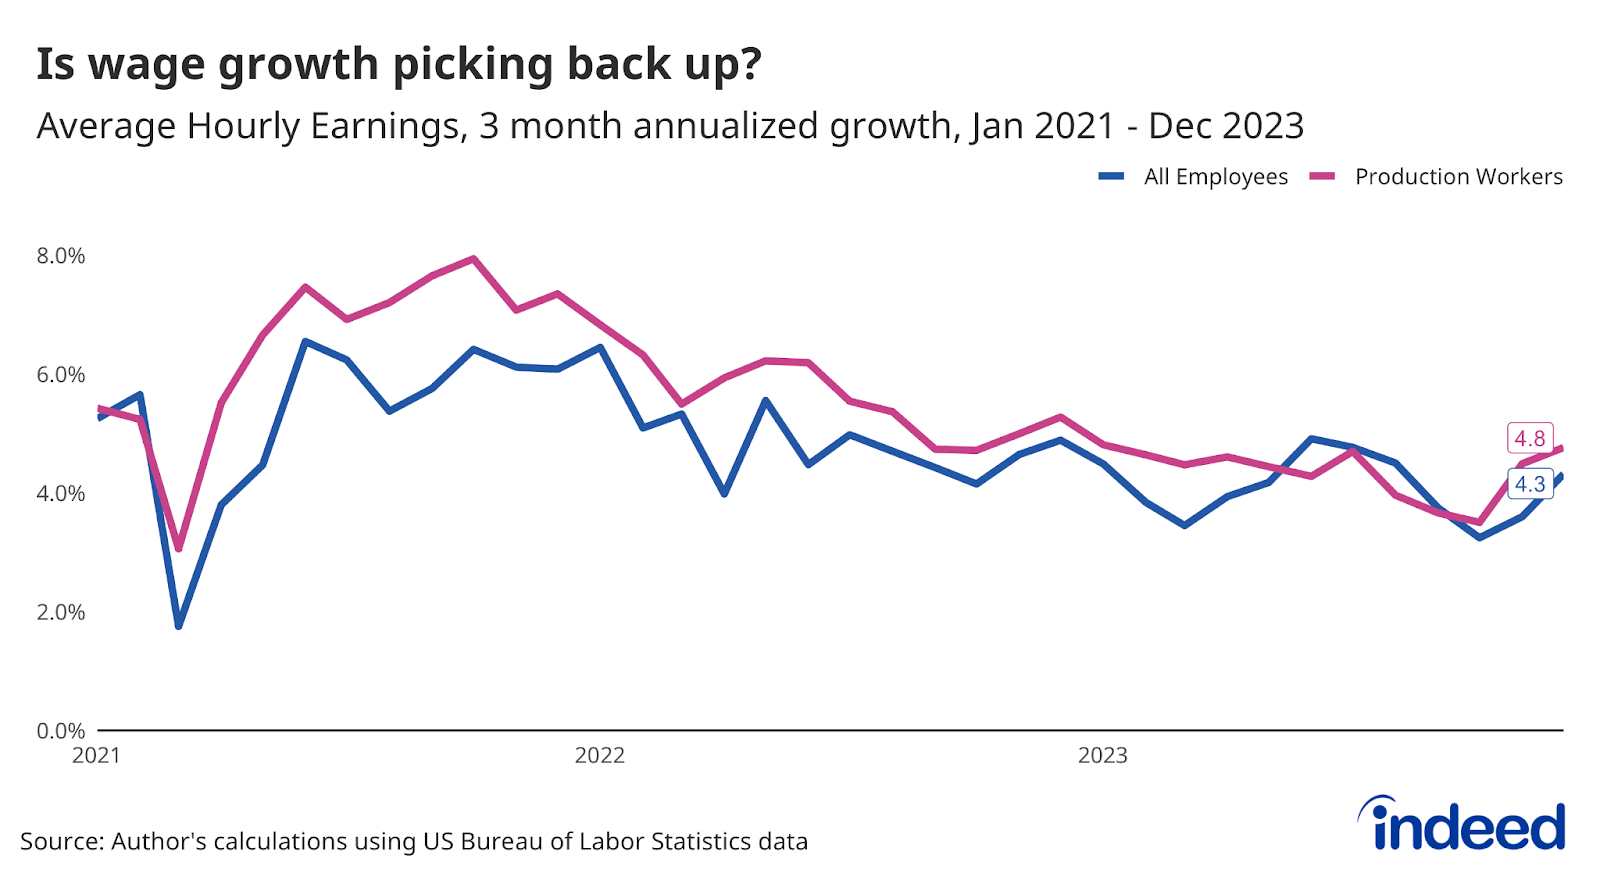
- While wage growth is below its peak in late 2021 and early 2022, it remains elevated compared to pre-pandemic levels.
- Wages grew 3.8% year-over-year in December, according to the Indeed Wage Tracker, down from 9.3% at its peak almost two years earlier.
- On its current trajectory, posted wage growth would descend to 3.5% by February, and its pre-pandemic average of 3.1% by May.
Our monthly Labor Market Update looks at an important labor market trend through the lens of Indeed data. A more comprehensive view of the US labor market can be found in our US Labor Market Overview chartbook. Data from our Job Postings Index — which stands 24% above its pre-pandemic baseline as of January 12 — and the Indeed Wage Tracker are regularly updated and can be downloaded on our data portal and GitHub.
The immediate outlook for the US job market remains somewhat uncertain, but one thing is clear: Annual wage growth is past its recent peak. As recently as January 2022, annual US posted wage growth as measured by the Indeed Wage Tracker was 9.3%. Almost two years later, by the end of December 2023, US posted wages grew at a much more sedate 3.8% annual pace.

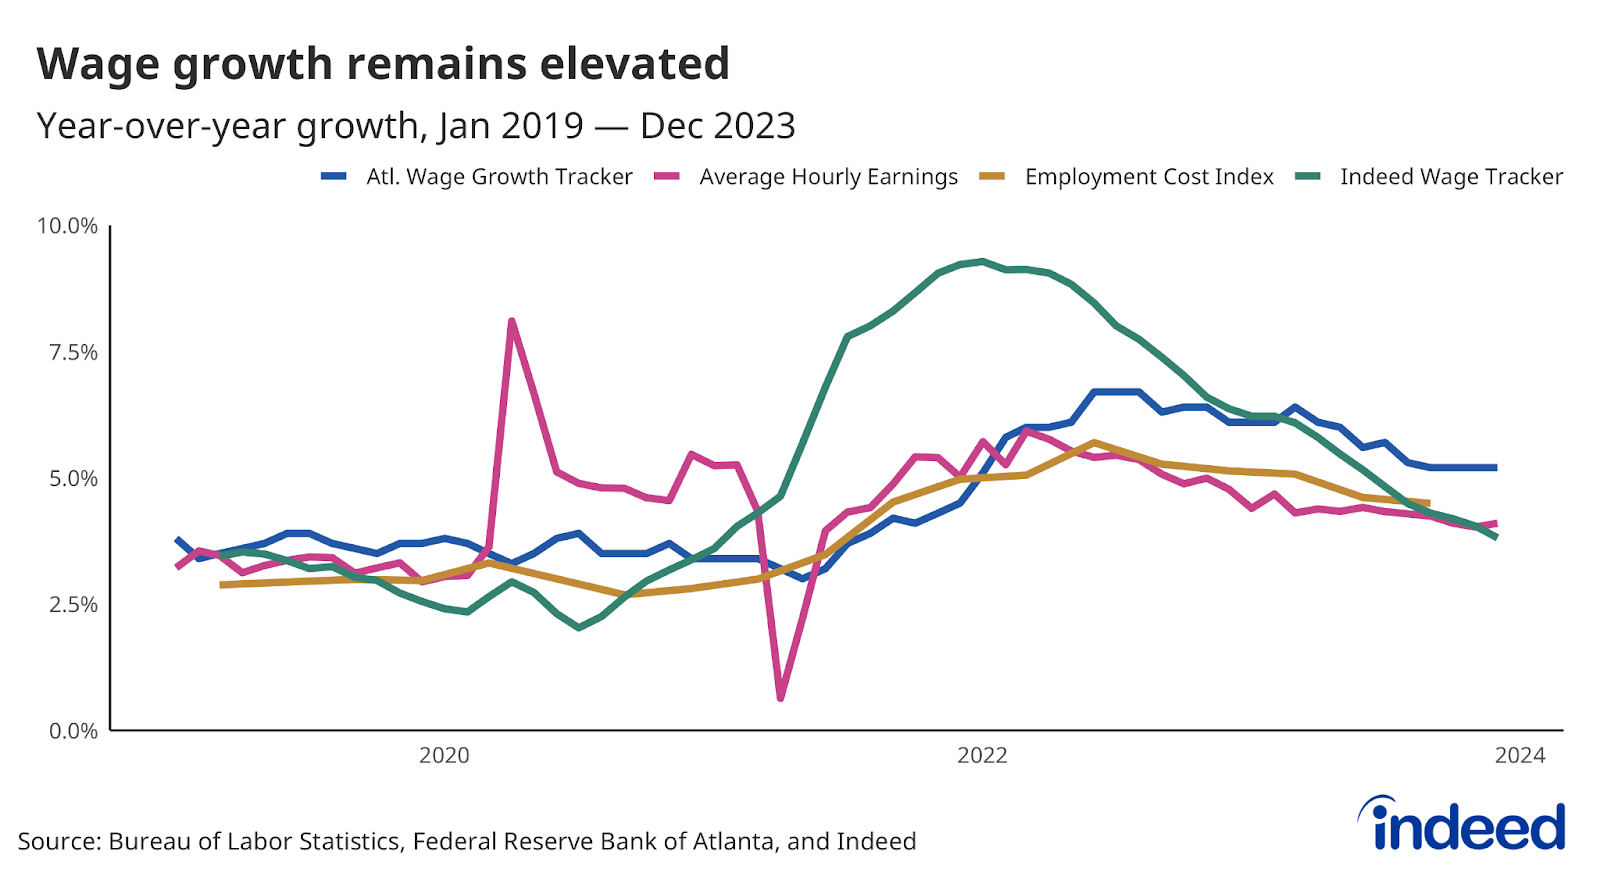
But while wage growth has slowed, wages are still growing relatively quickly. All four measures of wage growth cited in US Federal Reserve Chair Jay Powell’s 2023 Jackson Hole speech — measures from Indeed, the Atlanta Fed, and two from the US Bureau of Labor Statistics — were above their 2019 averages on a year-over-year basis by the end of December. And the pace of any further slowdowns remains unclear when looking at government data. For example, after drifting down since August 2022, wage data from the Atlanta Fed has moved sideways over the past four months.
A continued slowdown is more evident in data from the Indeed Wage Tracker, which measures growth in wages and salaries advertised in job postings on Indeed. Assuming posted wage growth continues to slow as it has over the past three months, annual growth as measured by the Indeed Wage Tracker would fall to 3.5%, a level consistent with healthy productivity growth and 2% inflation, by February. It would return to its pre-pandemic 2019 average of 3.1% by May.
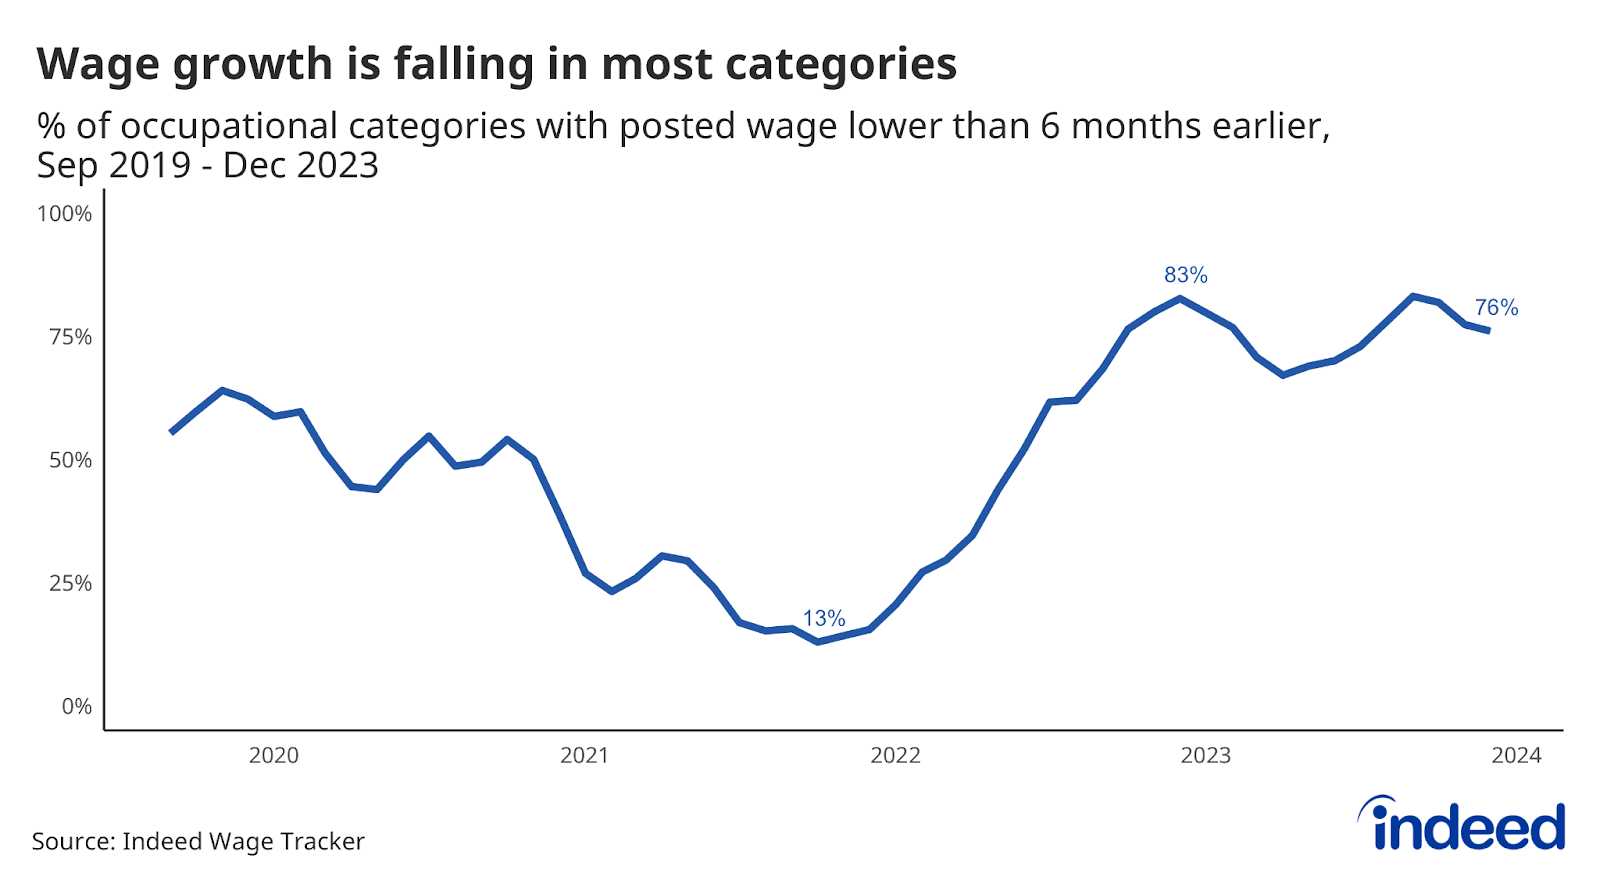
The breadth of the slowdown is also an indication that the recent deceleration has momentum. Posted wage growth was slower in December than in June 2023 in about three quarters (76%) of industries analyzed. That broad-based moderation is still there if we look at a shorter time frame: Just under 79% of occupational sectors had slowed growth at the end of the year compared to three months prior.
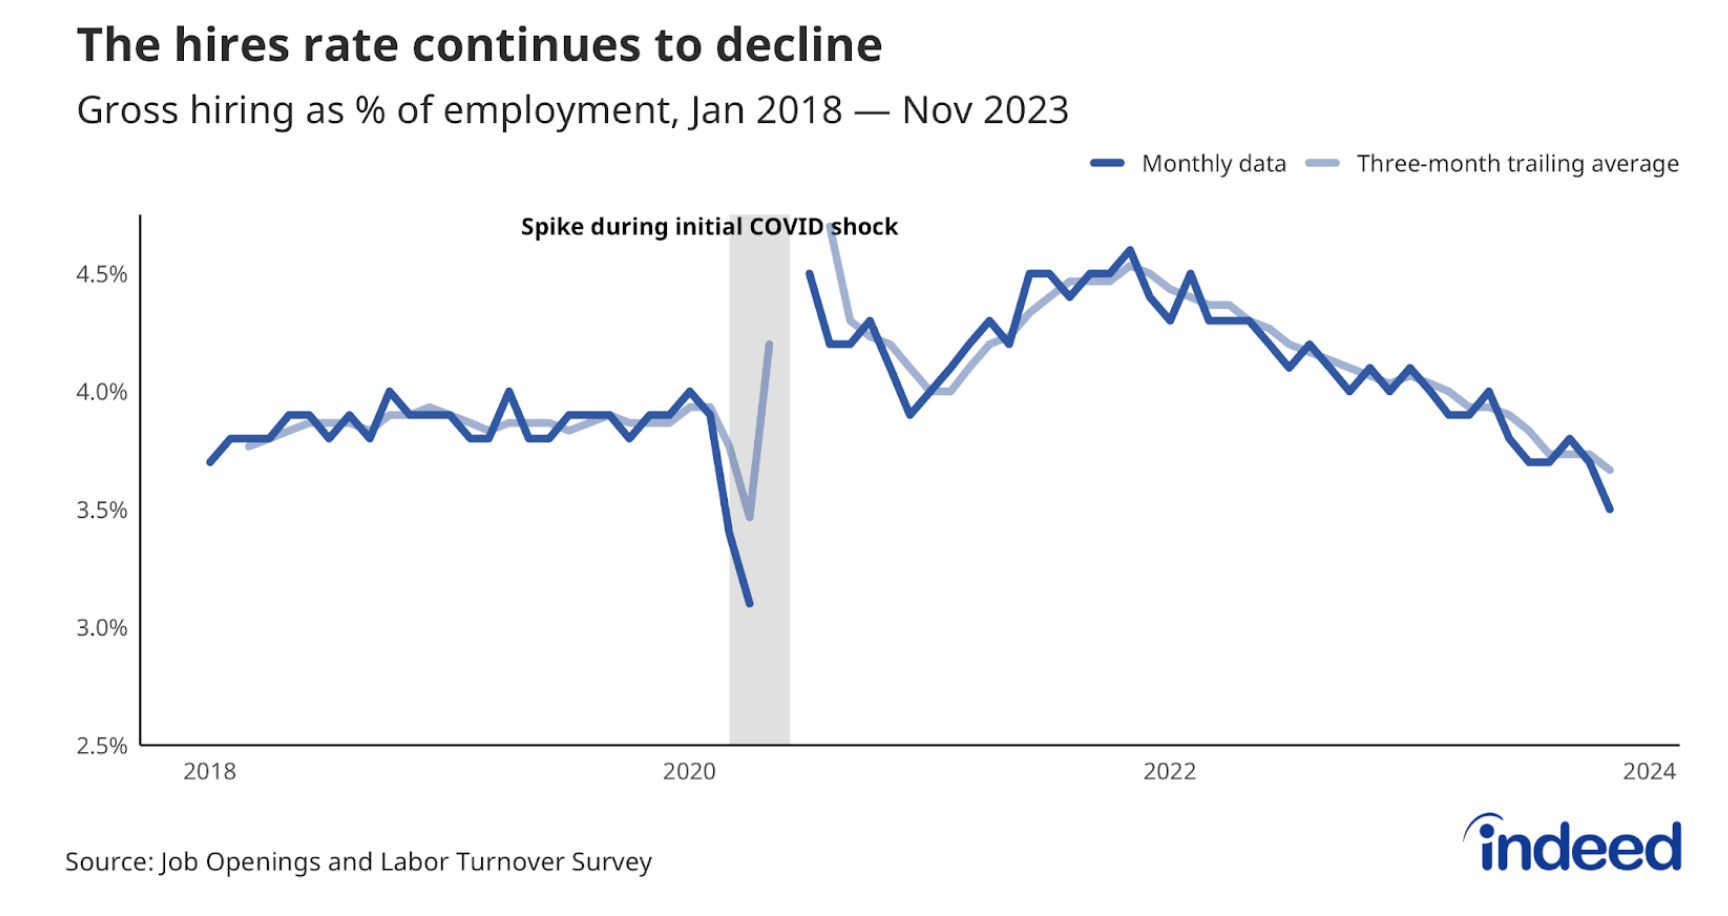
Other data pointed toward continued moderation. Measures of labor market tightness show a labor market that’s either only slightly tighter than pre-pandemic levels (the ratio of job openings to unemployed workers and the prime-age employment to population ratio), roughly equal (the quits rate), or slightly looser (the unemployment rate). In other words, these measures all point toward reduced competition for workers and slackening wage growth.
Slowing wage growth might be welcome news for central bankers, but on its own, it would be concerning for workers and job seekers. However, weaker nominal wage growth has been paired with a more pronounced reduction in inflation. The result is that wages, on average, are growing faster than inflation, and more workers are currently getting inflation-adjusted raises than in 2022, when nominal wage growth was faster than today.
Hopefully, the trends of recent months can hold up so fears about wage growth boosting inflation can subside, and inflation-adjusted wages can grow. The path might be winding, but it’s one to trod down with cautious optimism.
Methodology
To calculate the average rate of wage growth, we follow an approach similar to the Atlanta Fed US Wage Growth Tracker, but we track jobs, not individuals. We begin by calculating the median posted wage for a given country, month, job title, region, and salary type (hourly, monthly, or annual). Within each country, we then calculate year-on-year wage growth for each job title-region-salary type combination, generating a monthly distribution. Our monthly measure of wage growth for the country is the median of that distribution. Alternative methodologies, such as the regression-based approaches in Marinescu & Wolthoff (2020) and Haefke et al. (2013), produce similar trends.
More information about the data and methodology is available in a research paper by Pawel Adrjan and Reamonn Lydon, What Do Wages in Online Job Postings Tell Us about Wage Growth?, forthcoming in Research in Labor Economics.
The wage tiers of occupational categories are determined by ranking categories by the median wage advertised in the sector in 2019. The categories are then split into three tiers so each tier contains categories that covered one-third of job postings on Indeed on an average day in 2019. The average posted wage growth for each tier is a weighted mean of each category in the tier in which the weight is the number of salary or wage observations in the category that month.