Key Points:
- Next year’s outlook will depend not only on the direction of demand for workers, but also on whether any future declines are coming primarily through less hiring, rather than more layoffs.
- More prime-age workers may continue to join the labor force if the labor market remains tight and immigration flows stay high. But don’t expect these forces to hold off the shrinking effects of an aging population forever.
- Workers are quitting less frequently than a few years ago, but job-switching is still elevated by historical standards.
- Wage growth increasingly looks like it’s on track to return to a pre-pandemic pace. But it’s unclear how long that return will take and whether inflation will follow a similar trajectory.
- Increased usage of GenAI and other technologies — in addition to an increase in jobs developing those tools — could reshape the broader labor market. Watch for the use of Generative AI in jobs that don’t create AI.
The labor market didn’t follow the script many people wrote for it this year. Let’s all be thankful for that. Despite many projections for a recession, a historically fast tightening of monetary policy by the Federal Reserve, a banking crisis, and geopolitical crises and uncertainty, the labor market stands strong. Getting to this spot required a few unexpected things to happen.
Job openings and job postings fell considerably, but layoffs stayed low. Workers came flooding back into the labor force, and employers continued hiring at a solid clip, but wage growth slowed. The so-called “Great Resignation” that marked the early post-pandemic years ended, but workers still felt comfortable leaving their jobs. A host of new artificial intelligence tools were introduced that threaten to upend how many workers do their jobs, but there’s no immediate sign of it displacing workers.
But past performance is no guarantee of future results. Everything that needed to go right for the labor market in 2023 largely has. For next year to end on a similar high note, a few trends need to hold up or accelerate in 2024:
- Demand for workers will need to stay strong, either because job postings hold firm or employers hoard workers despite weak hiring plans.
- More prime-age workers will need to enter the workforce to counteract the long-term drag of an aging population.
- Quitting will need to stick at its current pace, a level consistent with what we saw before the pandemic but still elevated by historical standards.
- Nominal wage growth will need to continue to come down to ease concerns about the labor market fueling inflation. But for workers to keep adding to their purchasing power, wage growth cannot fall below the rate of inflation.
- Generative AI tools may spread rapidly through the economy and boost productivity growth.
This report digs into these broad trends. Following them will help us navigate next year’s path. Fingers crossed, the trail doesn’t take any detours.
Demand for workers has moderated, but further reductions could be more troubling.
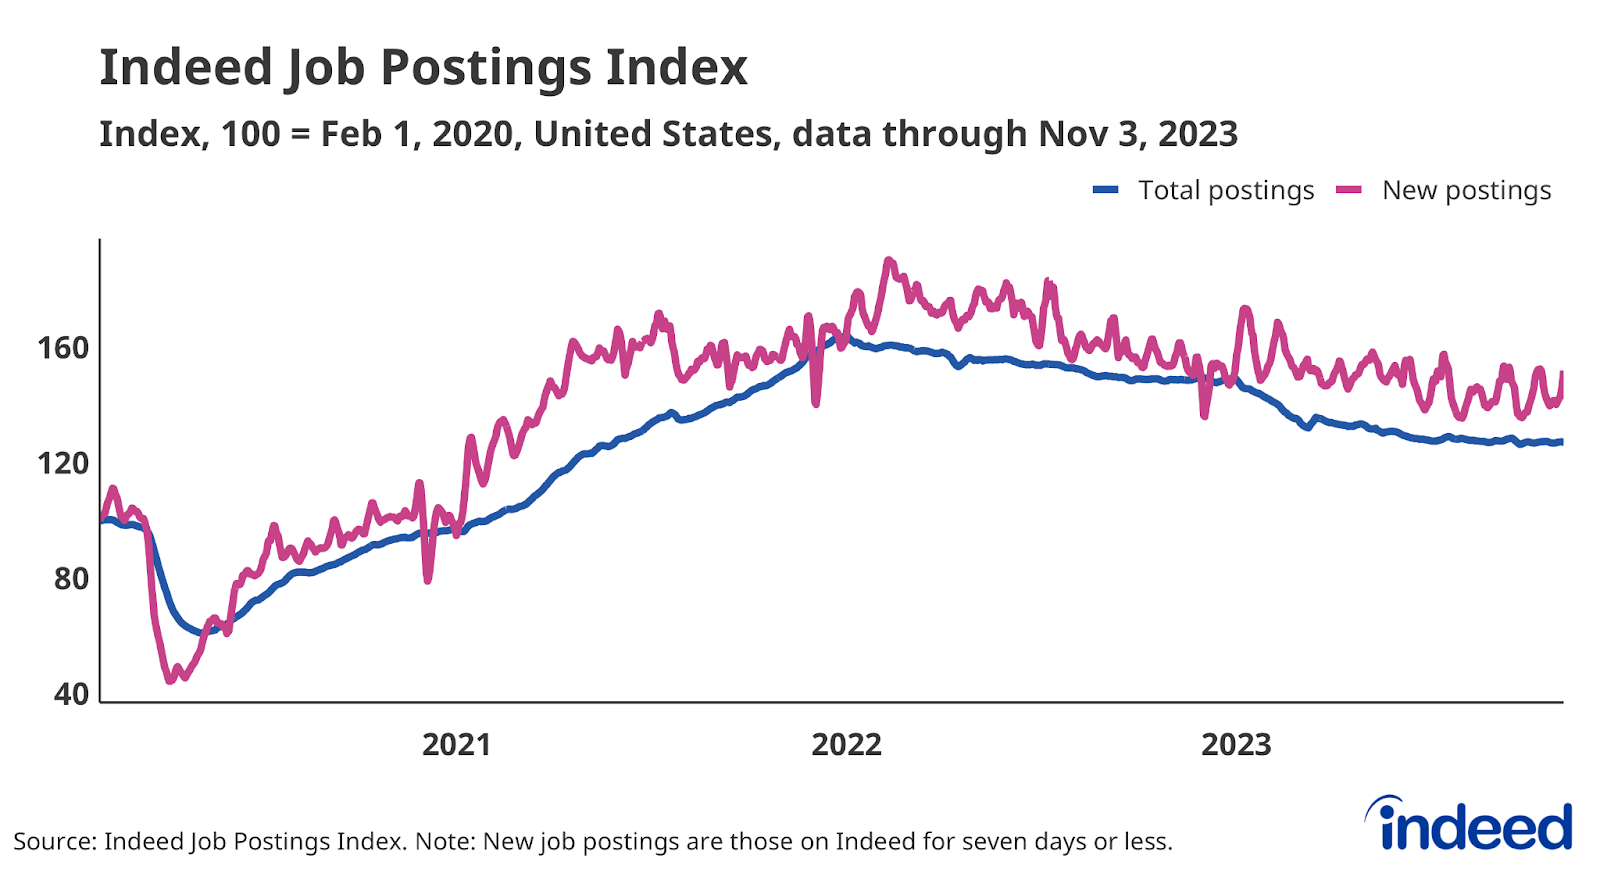
Employers’ hiring appetites are no longer as ravenous as a few years ago. As of early November, the Indeed Job Postings Index is down 22.5% from its December 31, 2021 peak, and the federal government’s job openings number is down 20.6% from its March 2022 high as of September. Part of the decline in these measures is because employers have been able to fill many positions. As of October, total employment was 3% above its February 2020 pre-pandemic peak.
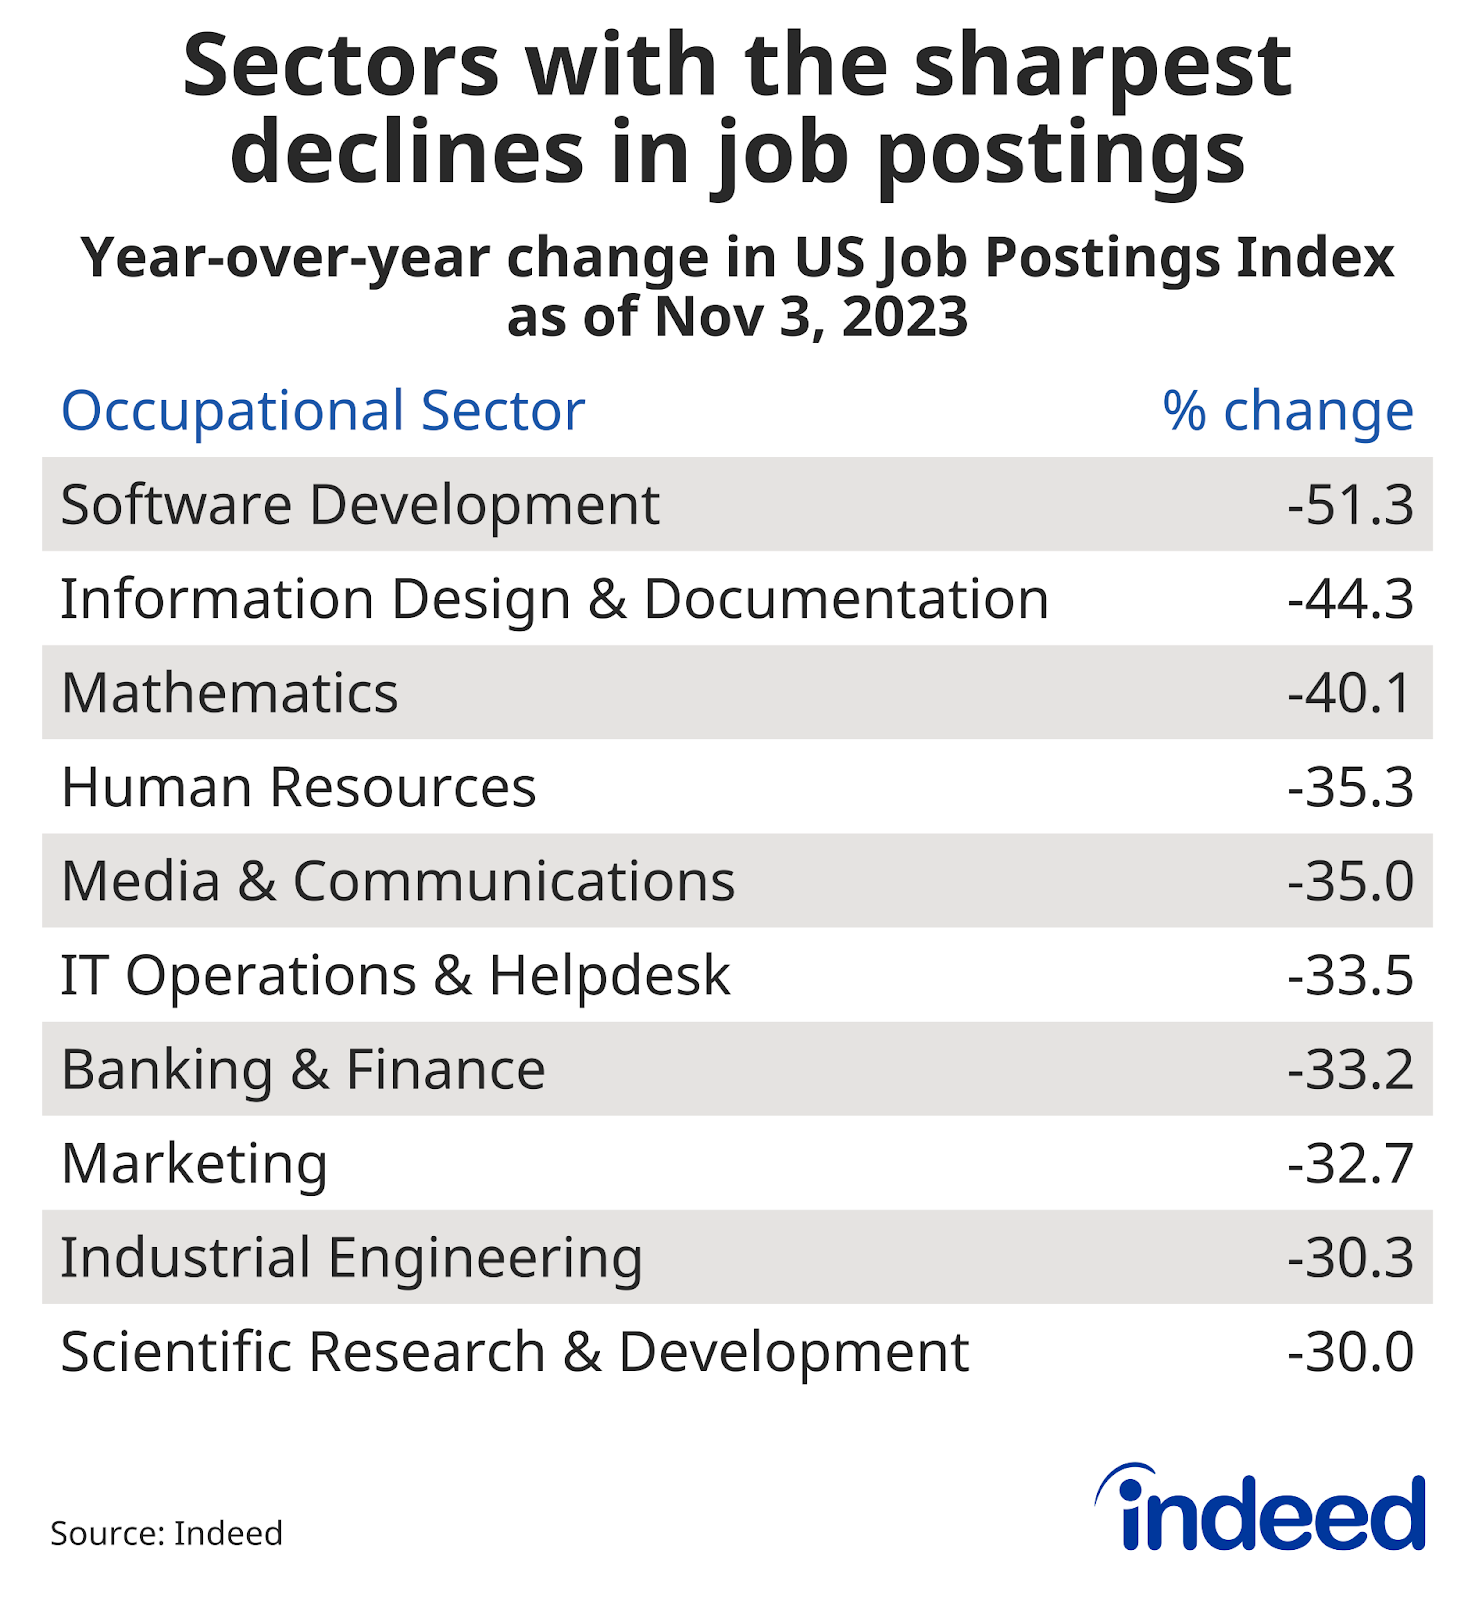
At the same time, many employers have rethought their staffing plans in light of slowing economic growth, shifting consumer demand, and higher interest rates. The pullback in job postings has been most stark in sectors tied to previously high-flying industries, including tech, where stock valuations have fallen and hiring plans have returned to earth. Sectors connected to companies that provide in-person services, including restaurants, hotels, and hospitals, represent a continued source of robust hiring demand.
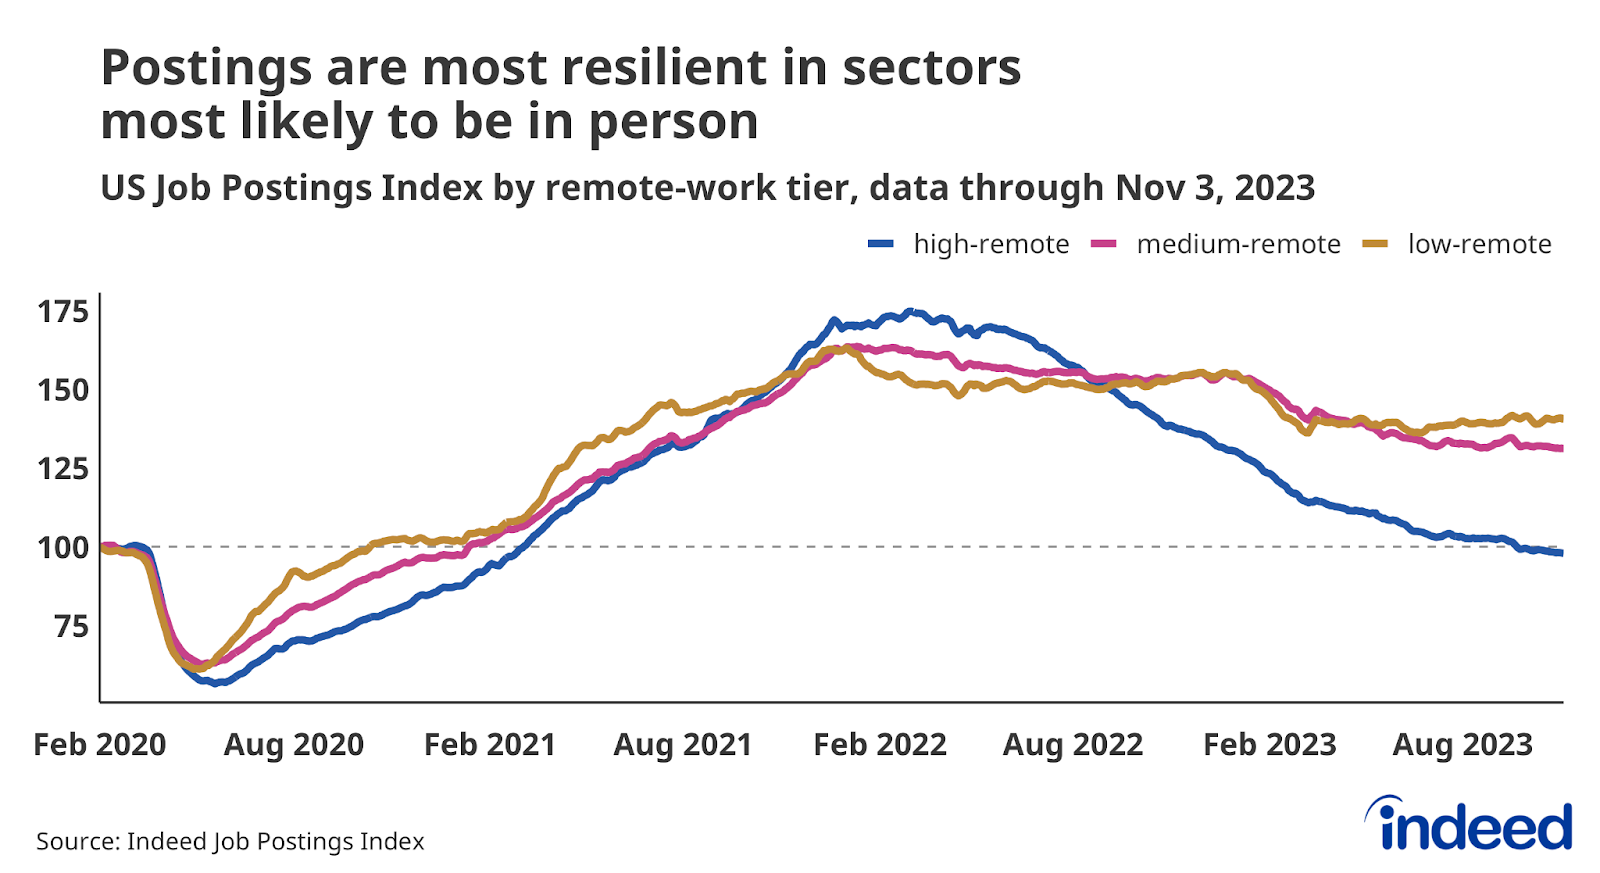
The divergence in hiring outlooks can be seen in the different trends for jobs depending on whether they need staff to be in person. While job postings are down overall, postings in sectors with the highest shares of roles that can be done remotely have fallen the most — essentially back to pre-pandemic levels. Job postings for the sectors most likely to require in-person work have actually increased since mid-year, up 3.1% from June 16th to November 3rd, while overall postings were down 1% over the same period. The continued resilience of hiring in these sectors depends on continued strong consumer spending for in-person services which flows through to desired hiring.
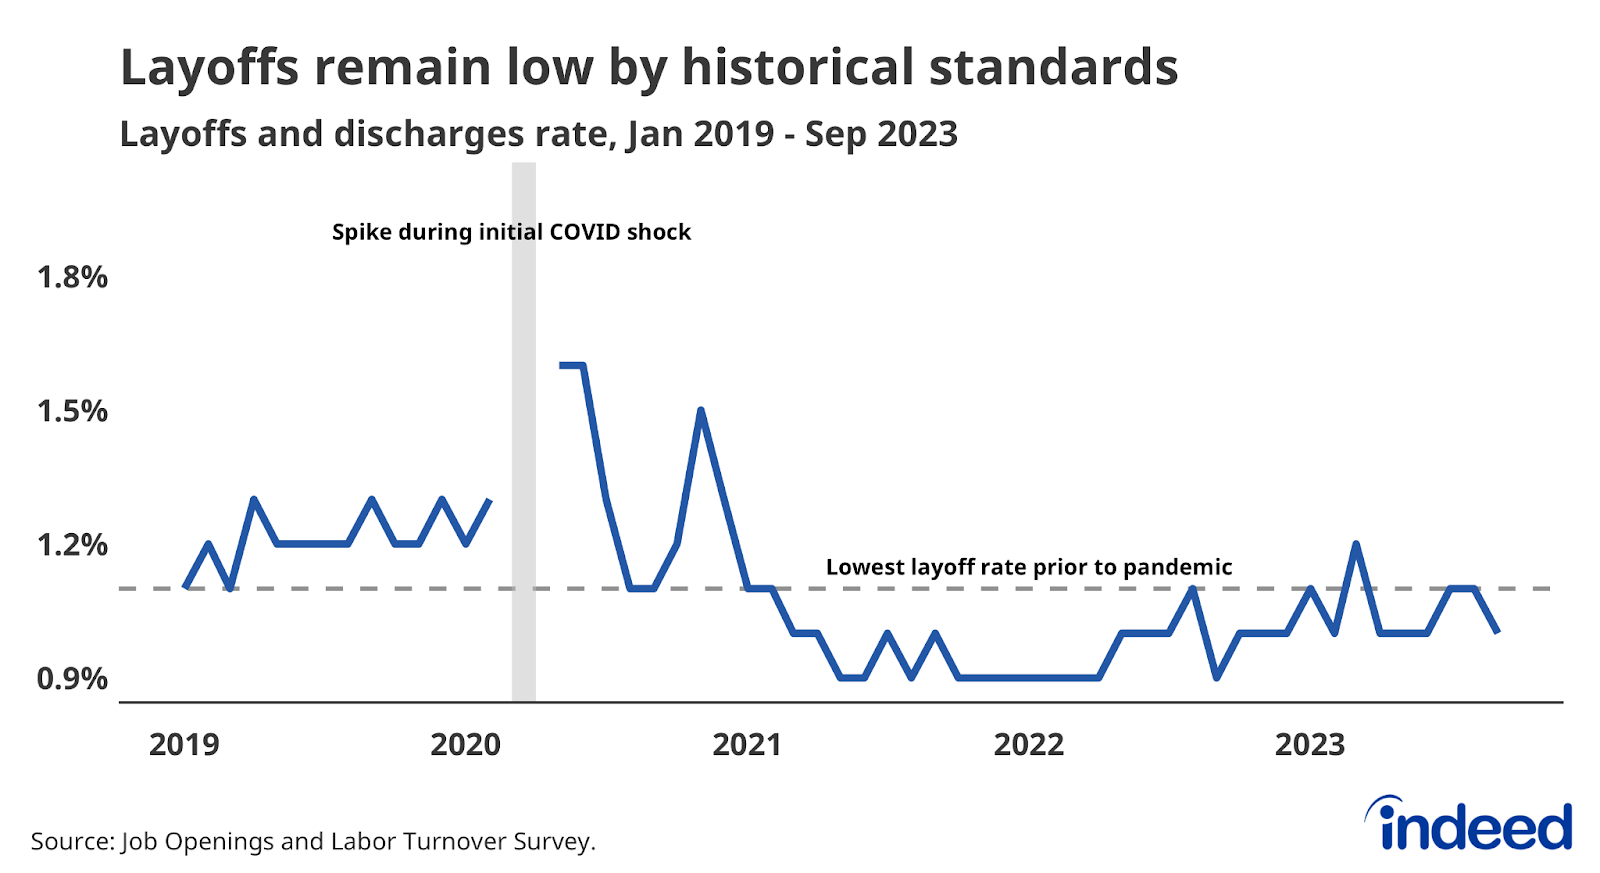
And while employers may be less enthusiastic about adding more workers to their payrolls, they seem content to keep the workers they already have — falling demand for workers overall is coming primarily through less demand for new workers. After a brief rise early in the year, the overall layoff rate as of September was just 1%, a level that would have represented a record low before the pandemic. There has been a dramatic decline in layoffs over the course of the year in a handful of industries, including Retail Trade. In February 2020, just prior to the onset of the pandemic, the layoff rate for the Retail Trade sector was 1.9%. By September 2023, the latest available data, the layoff rate in Retail had essentially halved, to just 0.9%.
Next year’s outlook will depend not only on the direction of demand for workers — whether it continues to fall or not — but also on the means through which employers reduce that demand. If demand for new hires continues cooling at roughly the same gradual pace as it has throughout 2023, then the labor market can be expected to continue on its current path without a spike in unemployment. But while postings and openings remain elevated relative to historic norms, they are still at a much lower level than recent highs. A further, rapid descent from these lower levels could mean that fewer currently unemployed workers are getting hired, leading to a rise in unemployment.
And a prolonged contraction in overall demand for workers could also mean that employers would start to shed current workers and layoffs would start to mount. Job postings and job openings could fall even more without a large rise in unemployment if employers hoard labor, as many have hypothesized. But that’s uncharted territory for the US labor market. Keeping an eye on not just the growth of job postings and openings, but the level as well, will be important next year.
The labor force is growing, but it can’t defy demographic gravity forever
Most predictions about the future are difficult, but some are relatively easy. Without a tremendous surge in immigration in the next few years, the United States will continue to age. According to projections from the Congressional Budget Office, the share of the working-age population 65 and above will grow from 17.5% in 2023, to 20.9% in 2035. An aging population means the pool of available workers will shrink in the years to come.
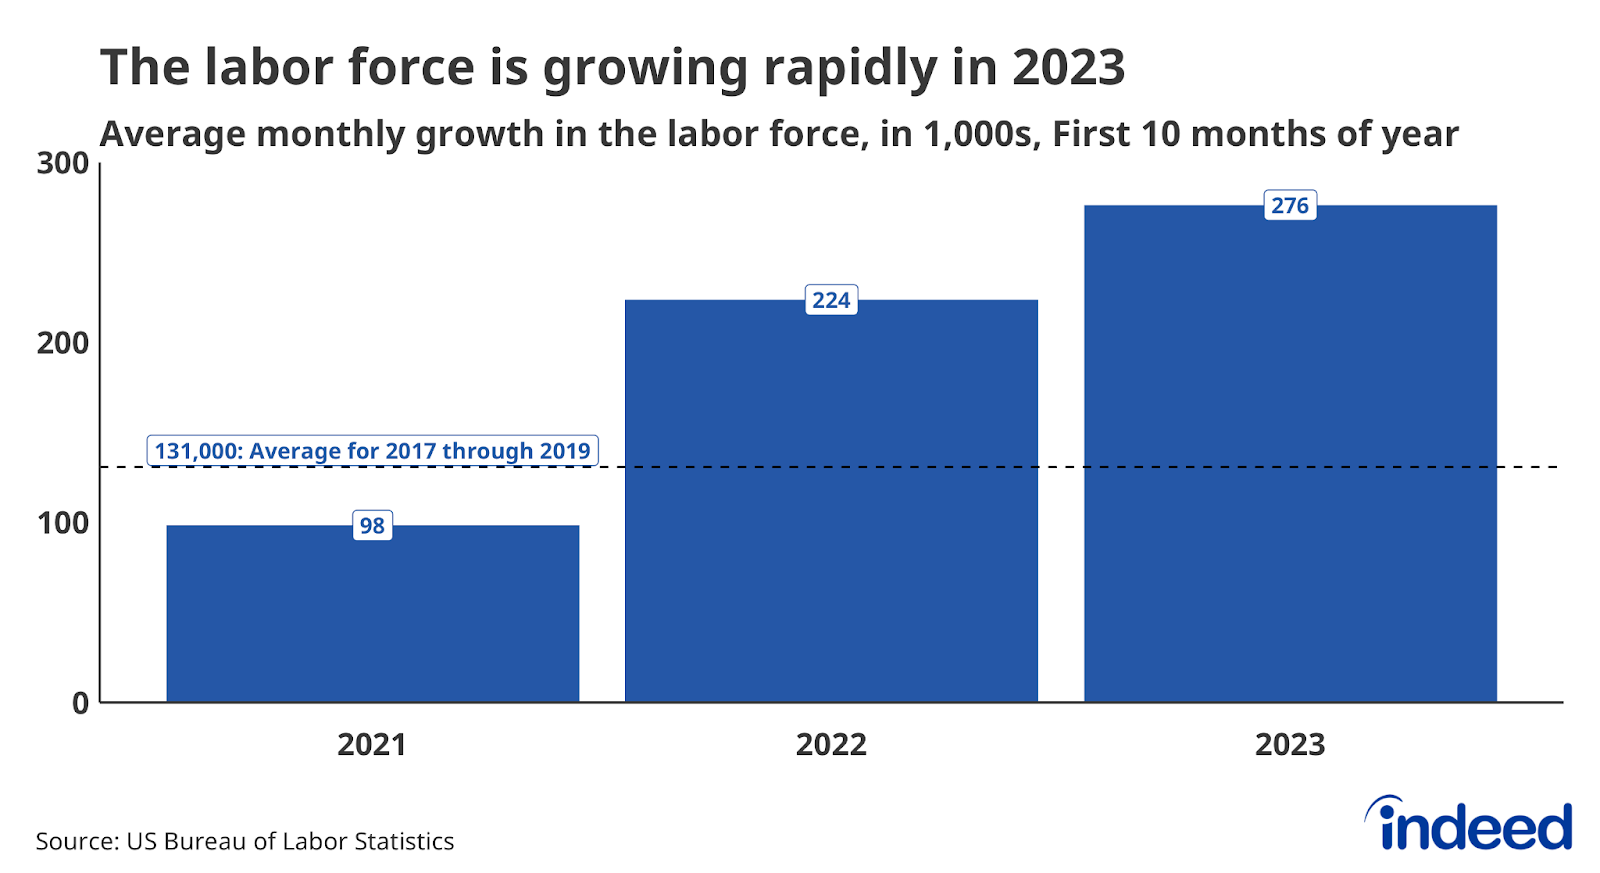
But over the past year, the labor force has defied these dynamics and grown quite quickly. The US labor force grew by an average of 276,000 people per month through the first 10 months of the year — faster than both the 2021 monthly average of 98,000 workers and the average of 131,000 in the three years prior to the pandemic. If the long-term trend is toward a slower-growing labor force, how was 2023 such a strong year?
In short, the participation rate of prime-age workers, those aged 25-to-54, rose to levels not seen since the early 2000s. As of October, the participation rate for these workers was 83.3%, down from a recent peak of 83.5% the month prior, but still comparable to rates twenty years ago. Consistently high demand for workers has both pulled more people into the labor force, and kept more current participants attached to the job market. A rebound in immigration from depressed pandemic-era flows has boosted prime-age participation as well. Even though foreign-born workers were just 18% of the labor force a year ago, roughly a fourth of the growth in the labor force over the past year has come from foreign-born workers. Short-term strength has managed to push back against the long-term trend. At least for now.
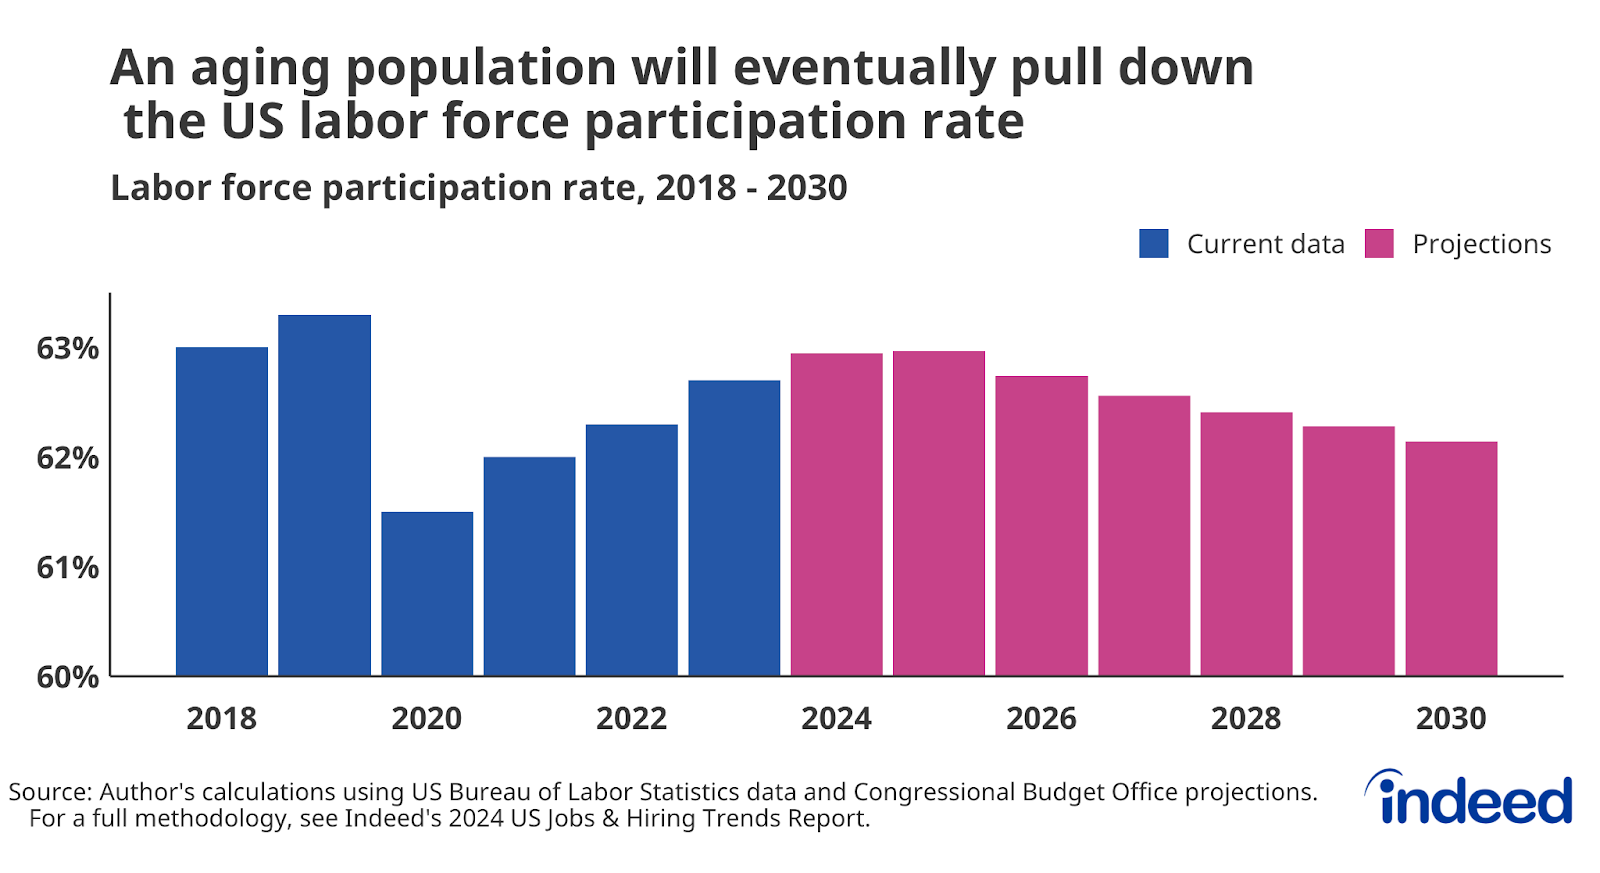
It’s unclear how much longer these short-term boosts to the labor force can continue. While 25-54-year-olds are participating at a rate in the range of what we saw twenty years ago, the current prime-age labor force participation rate is still short of its all-time high of 84.6% reached in January 1999. Even if participation among prime-age workers rose to match that high, and more workers aged 65+ pushed their participation rates to all-time highs, the labor force participation rate would only slightly increase next year, and then stabilize in 2025. After that, the weight of demographics would take over, and the participation rate would start to drop.
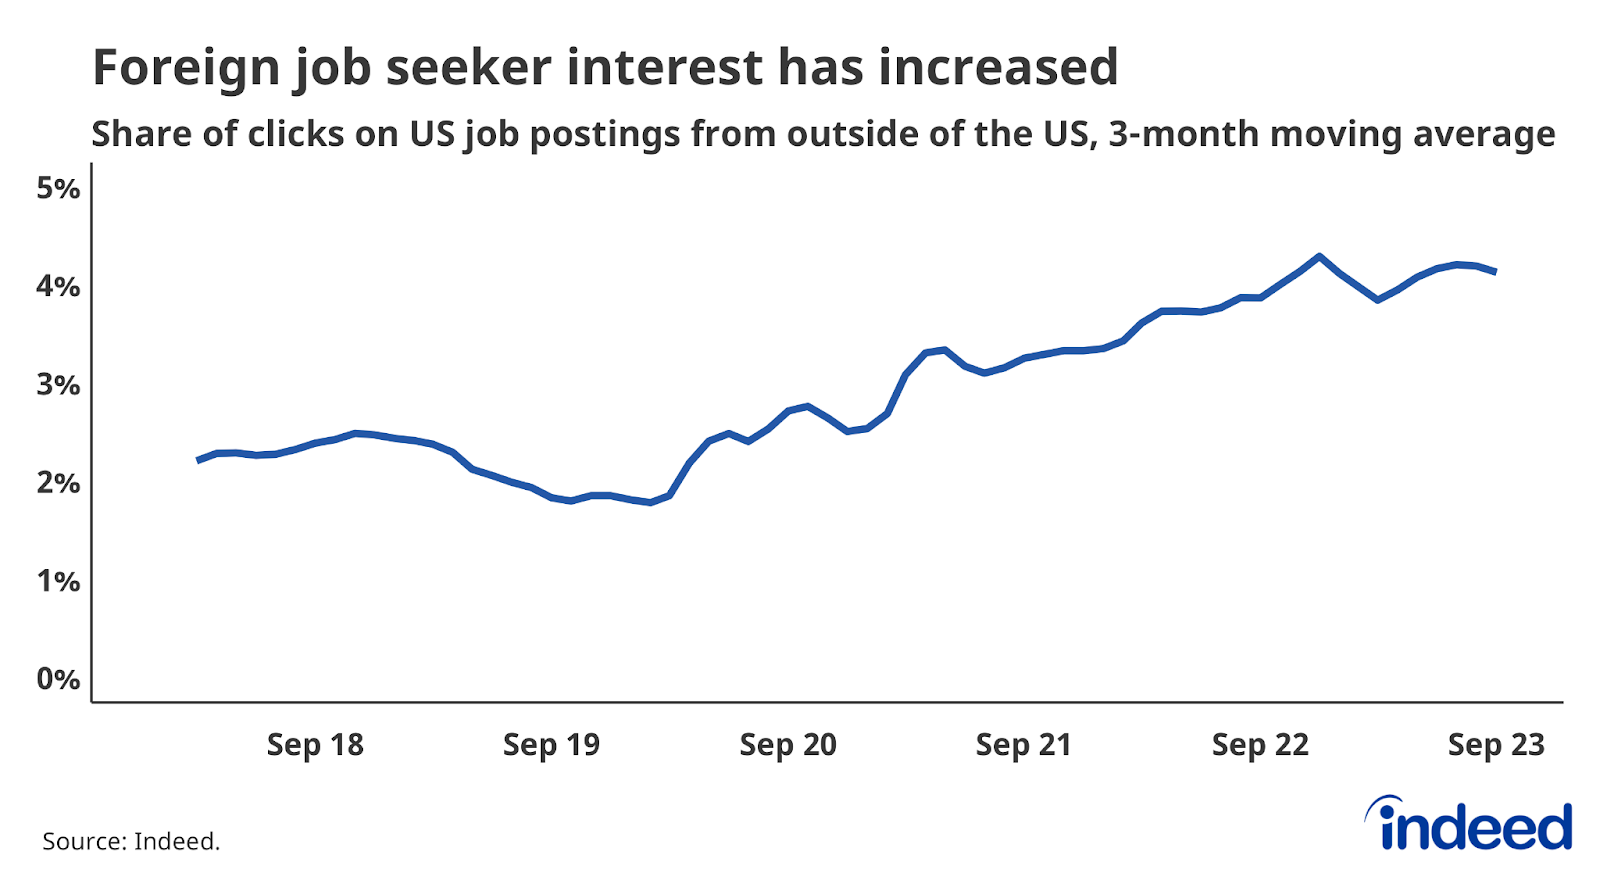
One way to counteract this seemingly inevitable slide could be through increased immigration, which may continue to be a meaningful source of workers in the next few years, but likely not a growing one. Foreign interest in job postings on Indeed has picked up since the pandemic and is well above 2019 levels. About 4% of clicks on job postings in the US came from outside the country in September 2023, up from roughly 2% four years prior. However, foreign interest seemingly plateaued over the past year. If interest from job seekers outside the US is any indication, immigration is unlikely to accelerate next year and provide a larger boost to the labor force.
Replicating the strong labor force growth of the past year will be difficult, but continued strong demand for workers, and robust immigration, may offer a temporary reprieve from the long-term trend. Because so many Americans have simply aged into retirement over the past few years, and with many more behind them in the years to come, overall labor supply will remain more limited than it was pre-pandemic — though it will still respond to a strong labor market. The currently resilient labor market might test the bounds of how much further participation rates can rise for some workers, but it can’t defy the gravity of demographics forever.
The Great Resignation is behind us, but that doesn’t mean workers aren’t quitting their jobs
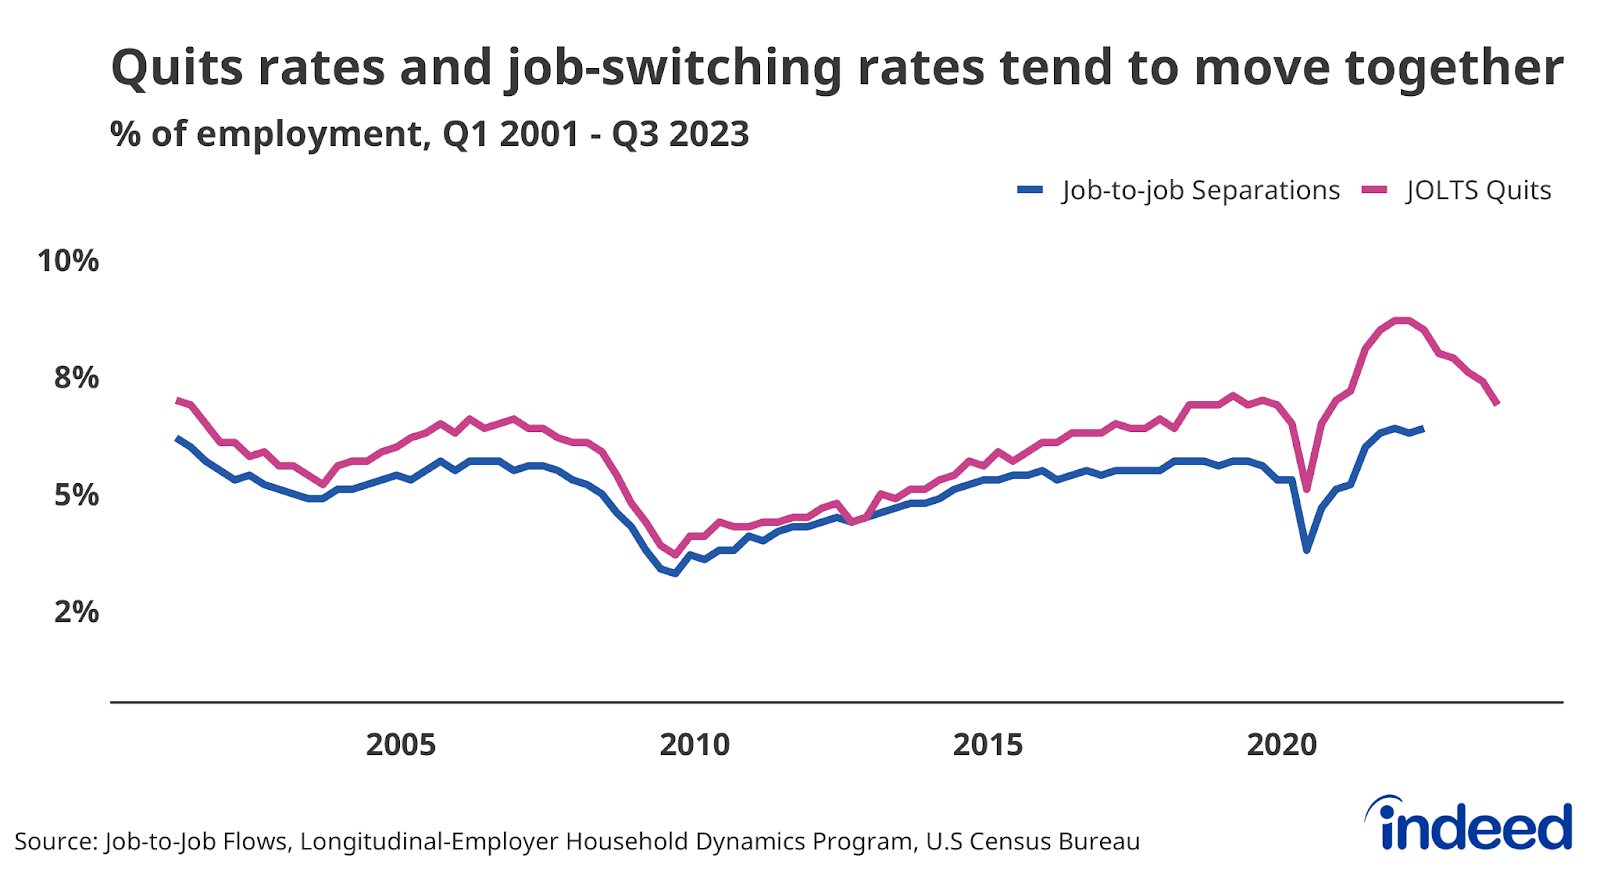
As we head toward the end of 2023, it’s clear that workers just aren’t quitting like they used to, at least compared to the rates in late 2021 and 2022. The immediate post-pandemic surge in workers voluntarily leaving their jobs was so sudden and remarkable it was deemed the “Great Resignation.” Job opportunities were proliferating and competition for workers was fierce. While the data on quitting can’t tell us where workers end up after they leave their jobs, other data from the federal government can. Those data show the Great Resignation was a period of elevated job switching.
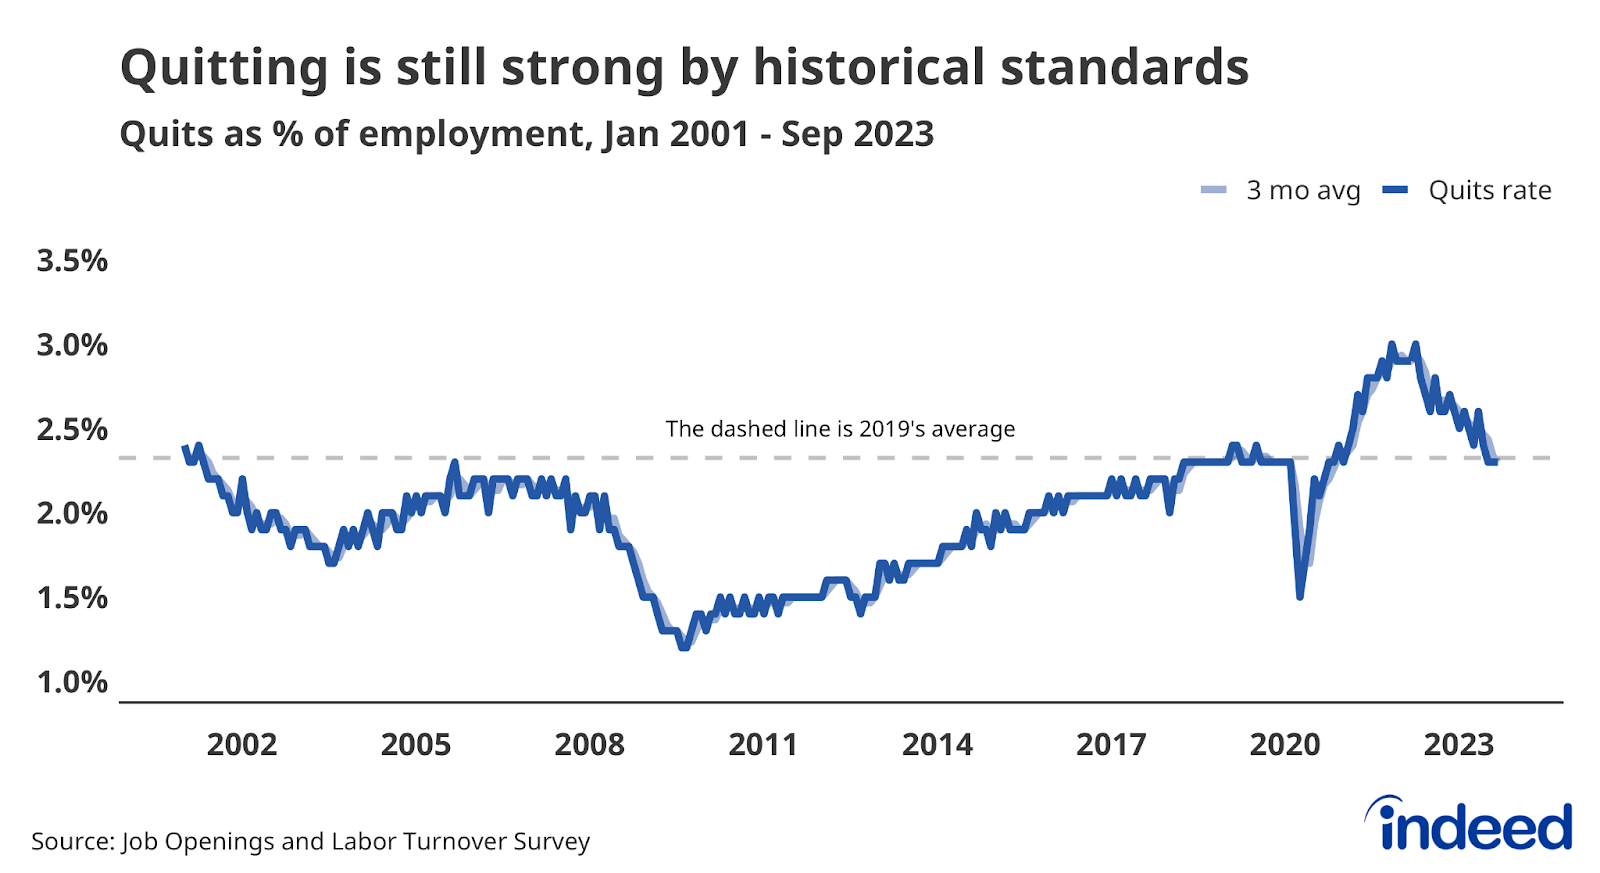
Those days, at least as we knew them, are behind us. The quits rate stood at 2.3% in September, the latest available data, equal to the average rate in 2019. This slowdown in quitting is mainly attributable to declining employer demand for new hires in early 2022. But another feature of the Great Resignation period was that workers were leaving their jobs at high rates while the overall unemployment rate was still elevated following pandemic-related disruptions.
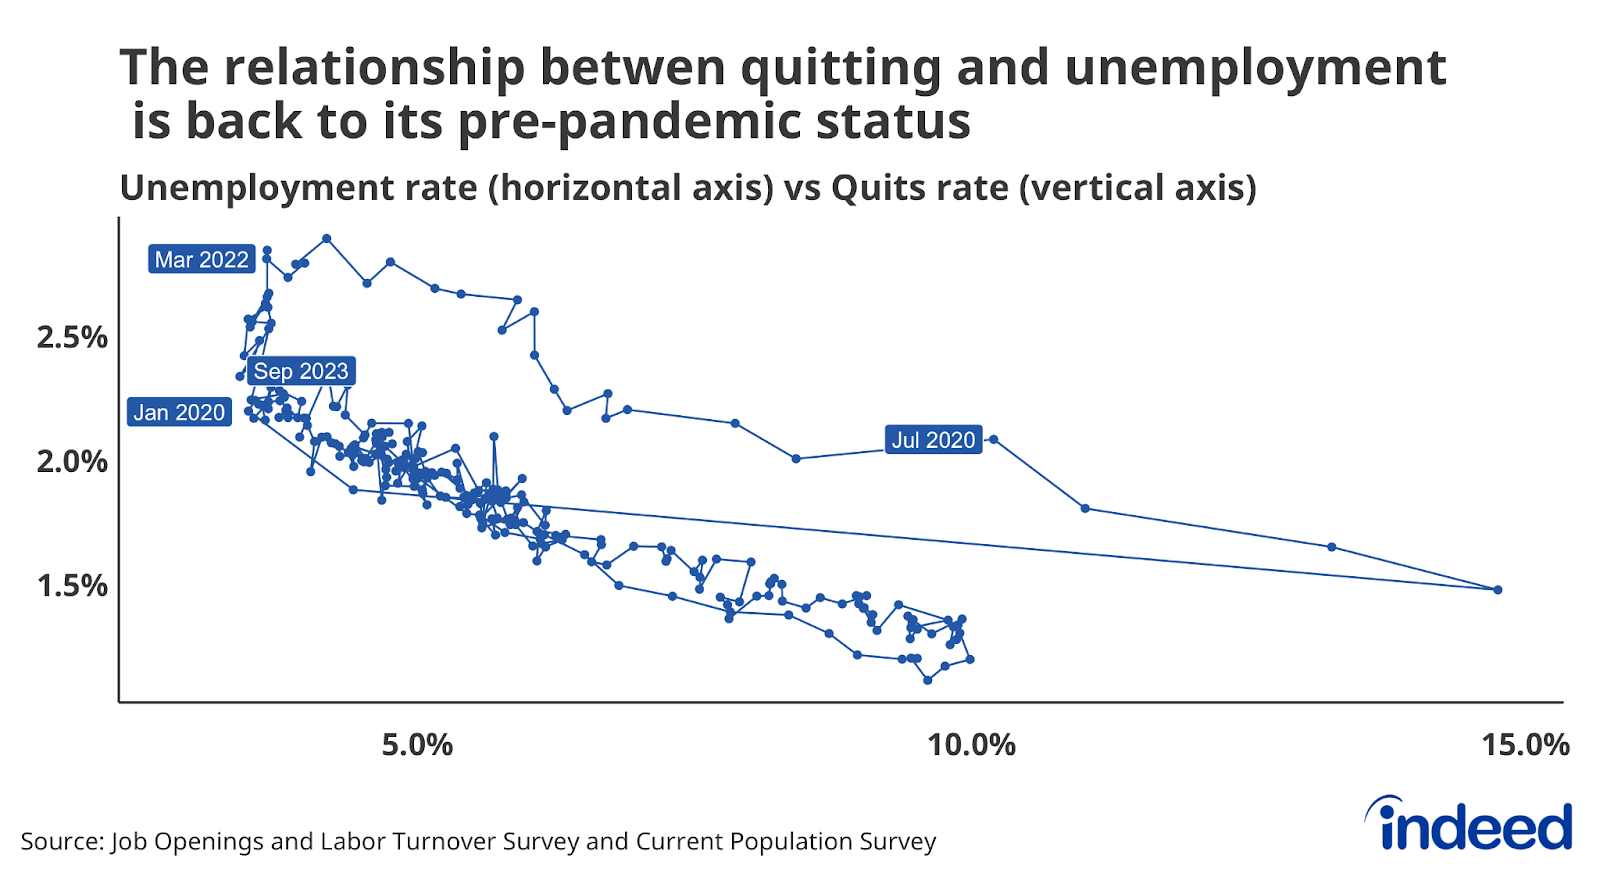
Generally, workers feel more comfortable quitting when unemployment is low and their confidence in finding another job is high — the typical relationship shows that when unemployment is high, quitting is low, and vice versa. And when unemployment is high, you’d expect it to be unemployed workers filling open job roles rather than those currently holding a job. But during 2021, the quits rate rose much faster than one might expect given the unemployment rate. It looked as though more hires were coming from the ranks of the already-employed, rather than the unemployed.
But the relationship between quitting and the unemployment rate has since shifted back to its pre-pandemic pattern. The quits rate in September was roughly in line with what may have been predicted pre-pandemic if the unemployment rate was 3.8%, as it was in September. That reconnection can be seen in the graph below, in which the quits rate and the unemployment rates for January 2020 and September 2023 are very close to each other. The pandemic-era disconnect between the job-finding outlook for the employed and the unemployed has disappeared. The result is that quitting has declined without a corresponding rise in the unemployment rate.
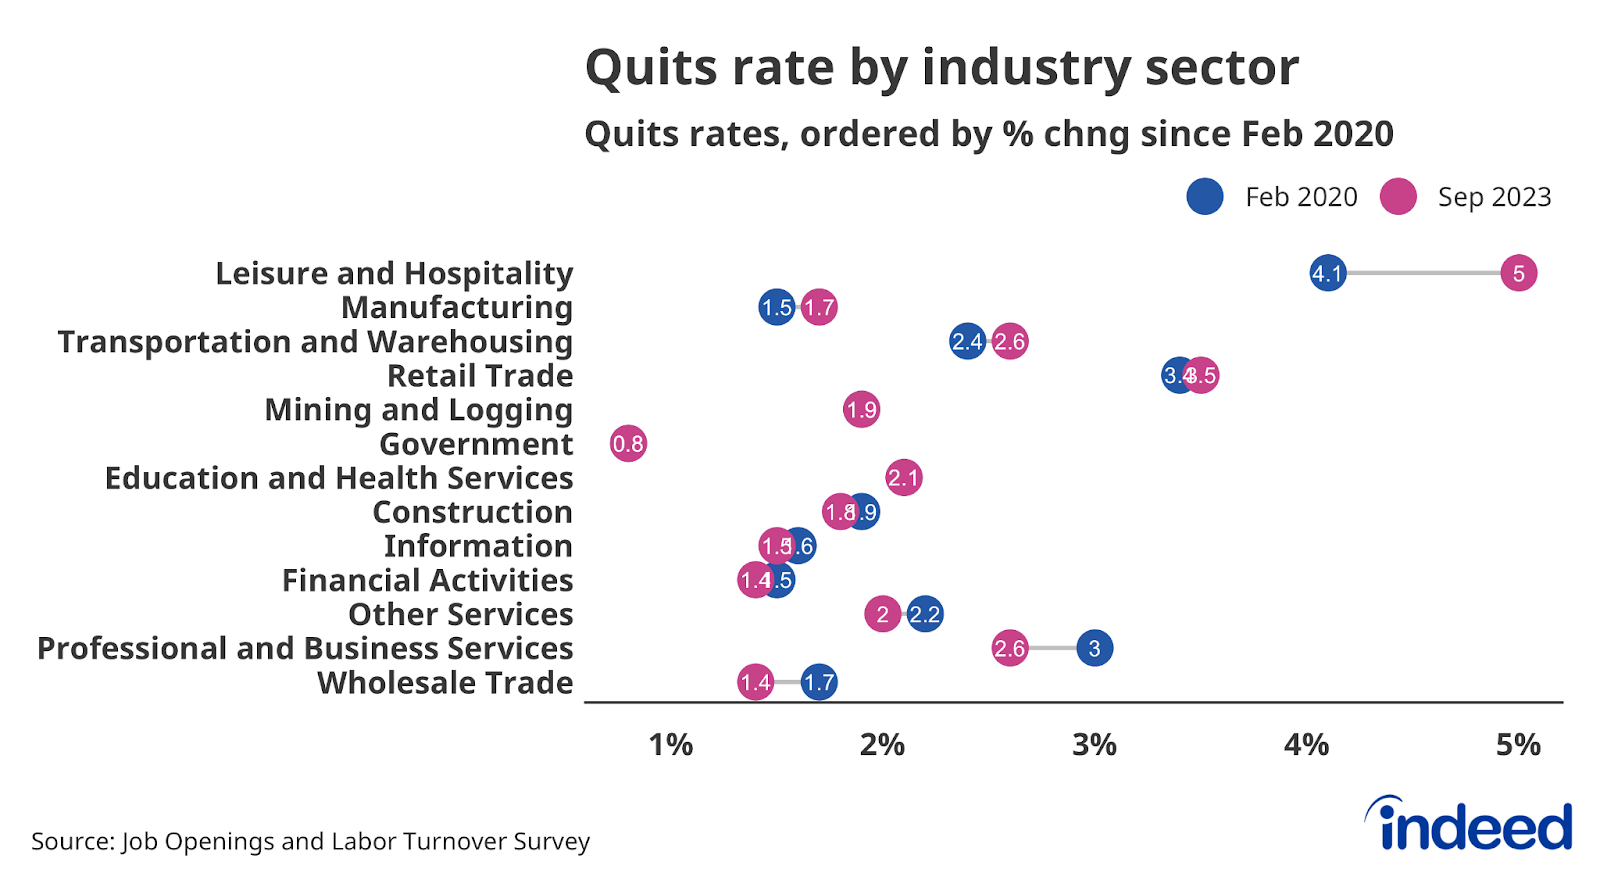
However, a return to the 2019-era quits rate doesn’t mean workers are suddenly without opportunities to find new jobs, or that employers don’t need to worry about retaining current workers. Before the Great Resignation, the all-time high quits rate was 2.4% — just barely above the current level of 2.3% — a sign that workers are still job-switching at near-historic rates. And even if the overall quits rate falls further to levels more in line with historical averages, individual industries and sectors may see more churn, and more workers looking to leave. For example, quitting in Leisure and Hospitality remains above its pre-pandemic rate, while the quits rate for Professional and Business Services stands below its February 2020 level.
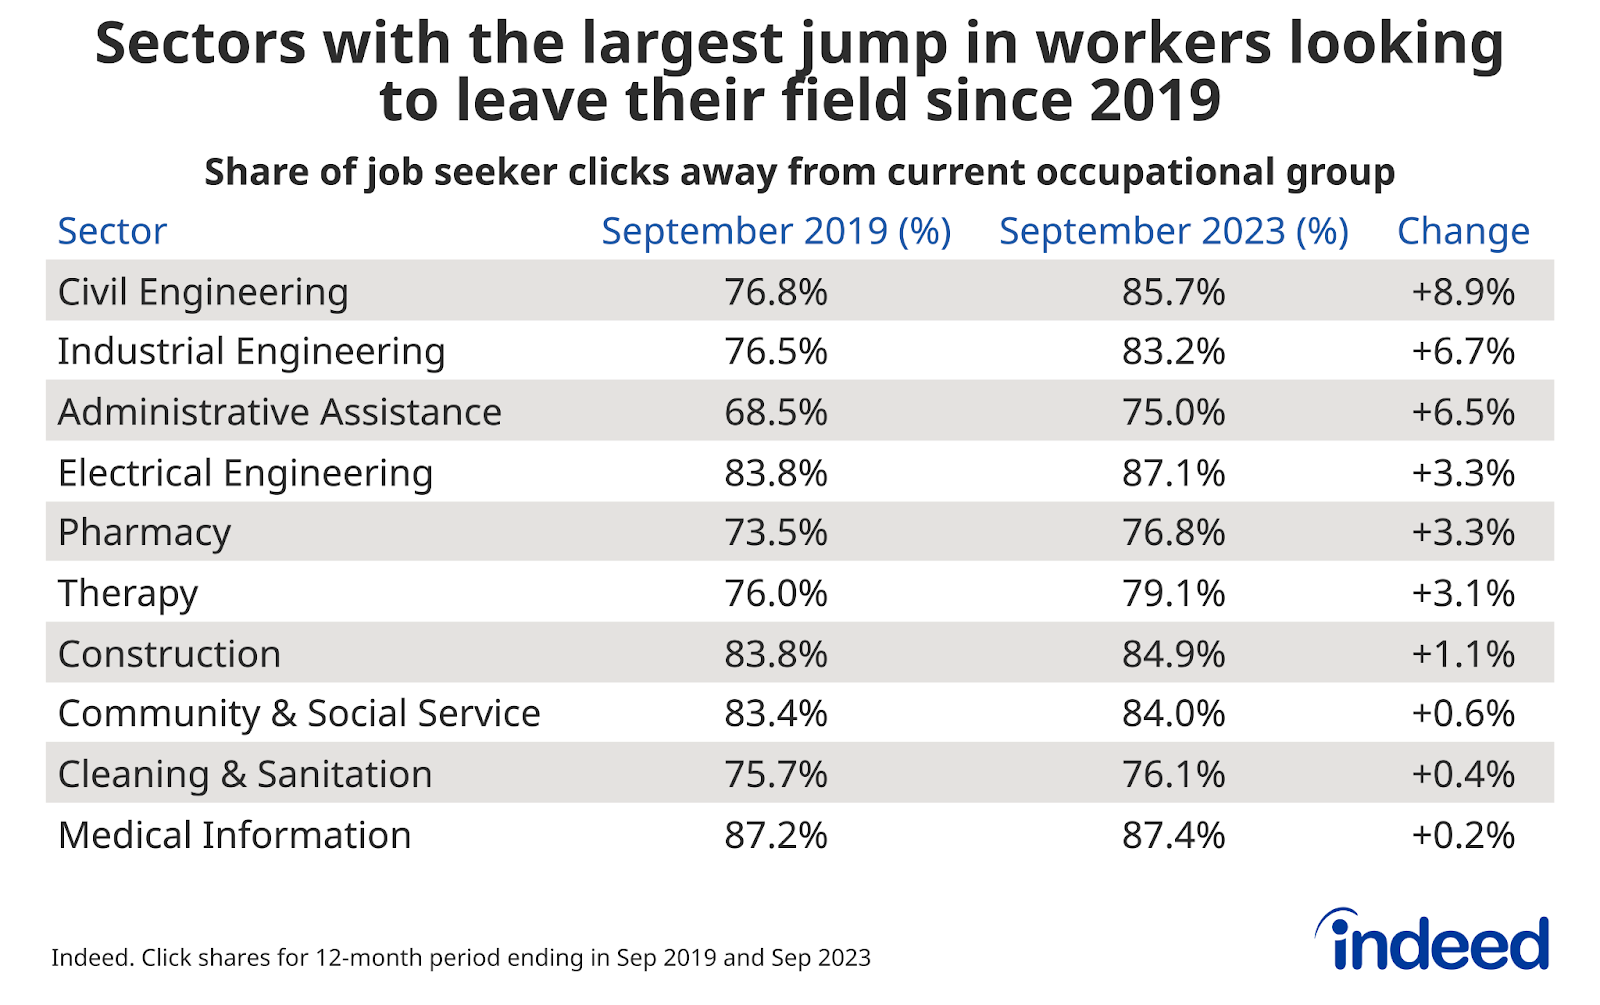
Job seekers are increasingly shifting their interest to job postings outside their current field, according to Indeed data. For example, the share of civil engineers looking at job postings outside of their field has grown by almost 9 percentage points since 2019 — from almost 77% in 2019 to more than 85% currently. If a growing share of workers in some fields are looking to leave those roles without an offsetting rise in interest from other fields, employers would need to take steps to retain current employees. Such steps could include pay hikes, increases in benefits, or changes in workplace flexibility, among others.
Wage growth looks to be settling down — hopefully, inflation will follow
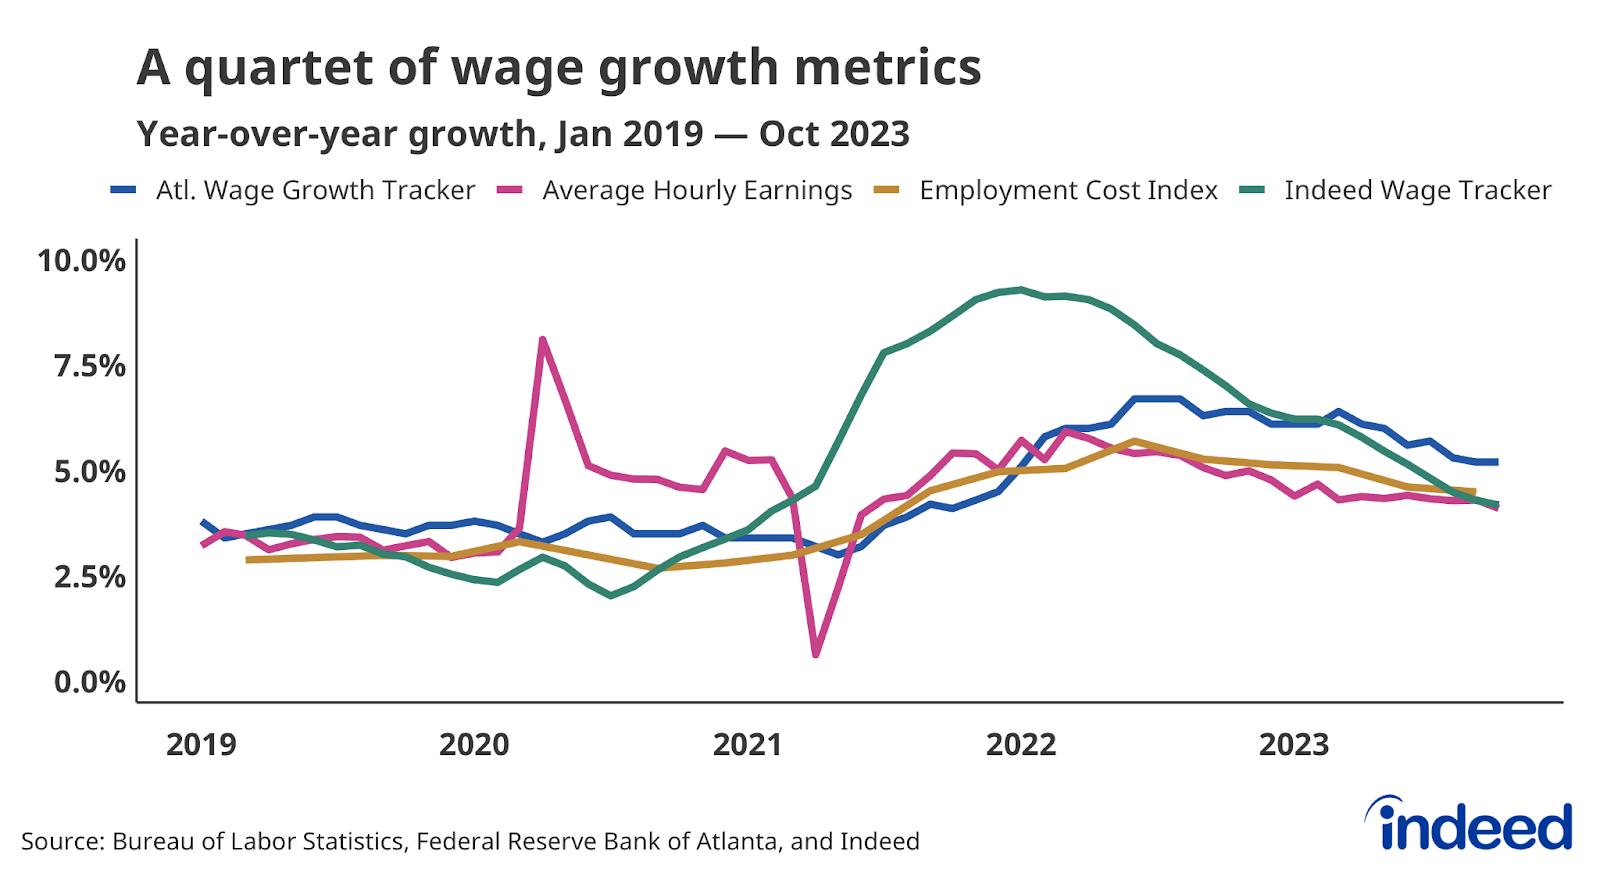
One of the most apparent signs of the ongoing US labor market cooldown is that wages are no longer growing as quickly as they recently were. Falling employer demand, increasing labor supply, and diminished quitting has resulted in employers handing out smaller raises. This slowdown in wage growth can be seen in a variety of measures of wage growth, including the Indeed Wage Tracker and those from the federal government. The Indeed Wage Tracker peaked first — in January 2022 — and the Atlanta Fed’s Wage Growth Tracker peaked last, in early 2023.
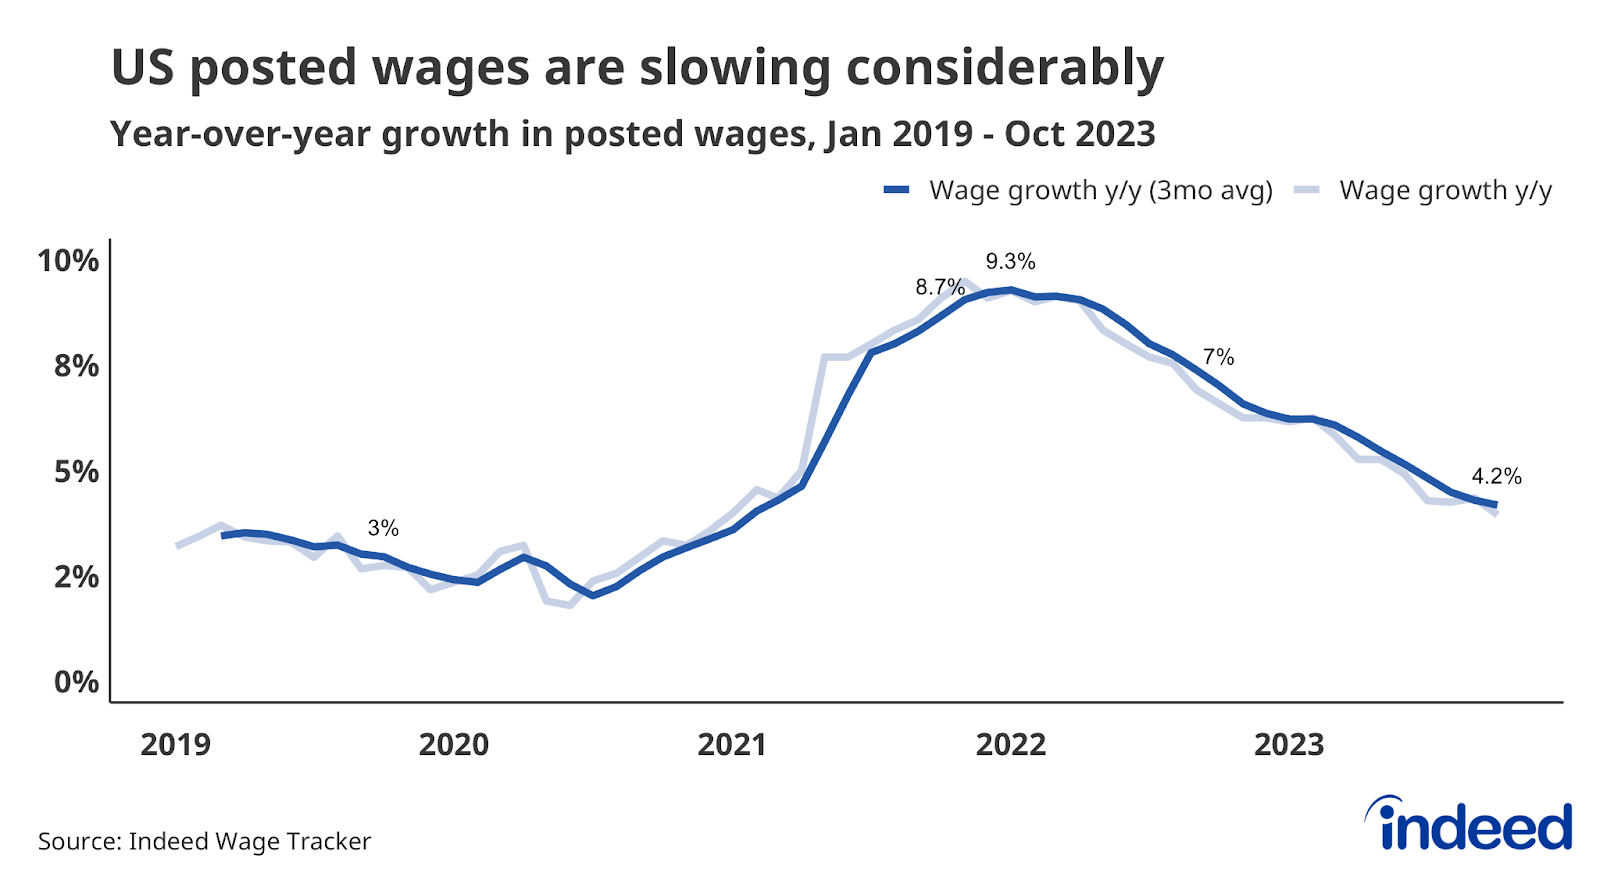
While wage growth has slowed by several measures, it hasn’t yet returned to its pre-pandemic growth pace. But there are indications it may fall to that level relatively soon. According to the latest data from the Indeed Wage Tracker, posted wages in October were up 4.2% from a year prior, down from 4.8% in July, and well below the January 2022 peak of 9.3%. If posted wages continue to slow down at roughly the rate they have for the past three months, the Indeed Wage Tracker will return to its pre-pandemic pace before the middle of next year.
Wage growth seems on a track back to the healthy and sustainable rate seen before the pandemic. Wage growth between 3.5% to 4% would be consistent with 2% inflation, assuming labor productivity grows between 1.5% and 2% annually. Labor productivity is up 2.2% over the past year, but the underlying pace might be lower than that moving forward.
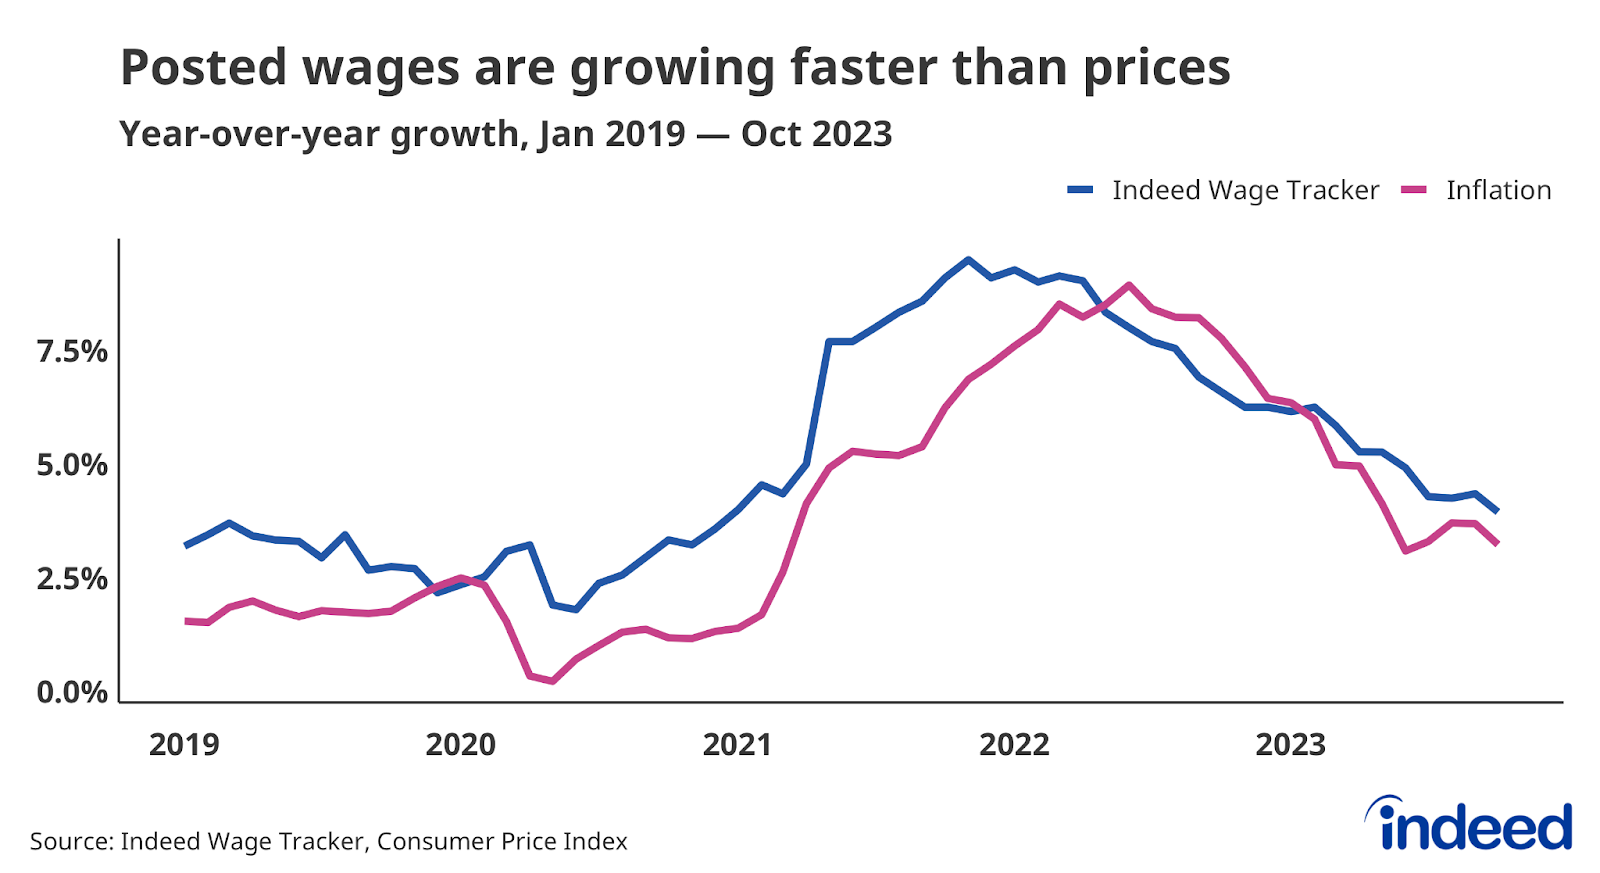
Note that the data above is nominal and does not account for inflation. Consumer prices were up 3.2% year-over-year in October, above both pre-pandemic norms and the Federal Reserve’s 2% target. By most measures, wages are currently growing slightly faster than the rate of inflation, meaning workers’ purchasing power is actually showing a modest increase. But if nominal wages continue to decelerate, inflation will also have to slow further for workers to keep receiving these inflation-adjusted raises.
The inflation outlook is hotly debated. Whether and how quickly it returns to the desired 2% annual rate depends on many factors including the effects of monetary policy, changing consumer behaviors, the stability of inflation expectations, and, of course, the state of the labor market. If wage growth stays higher for longer it could impede inflation’s fall. When, as recently as a year or two ago, wages were growing at double or more their pre-pandemic pace, many feared that inflation would also remain high. Slowing wage growth has soothed some of those fears, at least for the moment, but both wages and prices will need to continue to slow to put those concerns fully to rest.
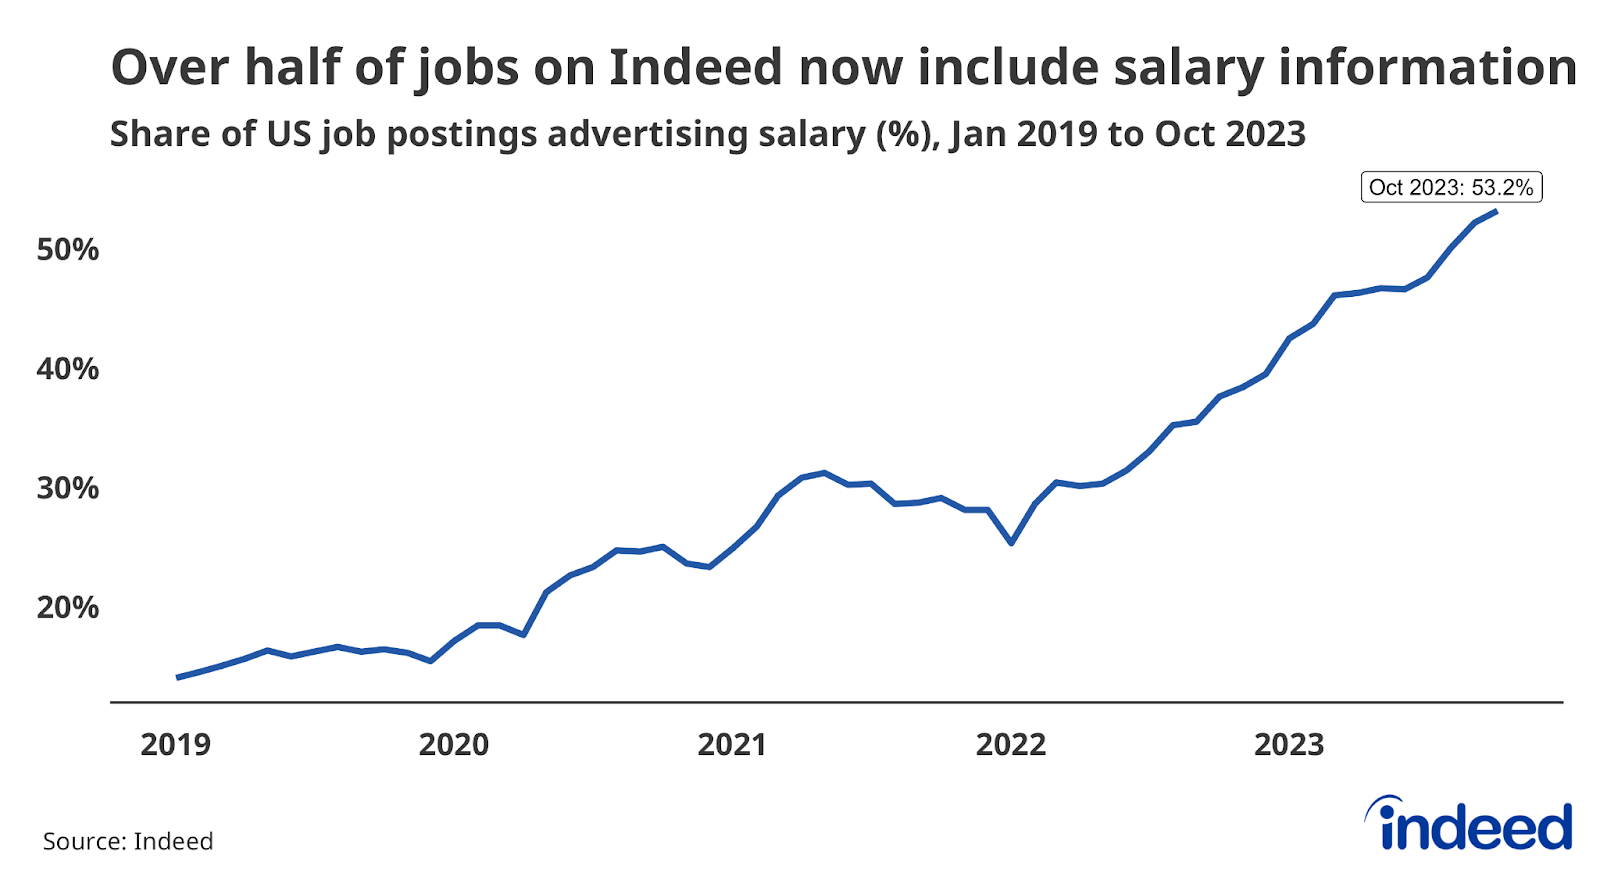
While wage growth might be slowing down, employers could be finding other ways to attract job seekers that are less costly. As Hiring Lab has documented, salary transparency has become increasingly common in the US, due in part to a rise in local regulations. But employers might also find that advertising what they pay could be a competitive necessity in a still-tight labor market. Wages might not grow as quickly next year, but employers that advertise what they’re paying may find it somewhat easier to attract quality candidates than their competition, which may keep salary information more opaque.
Watch for the usage of Generative AI in jobs that don’t create AI
Artificial intelligence, particularly generative artificial intelligence, rocketed into public consciousness at the end of 2022. These technologies have great potential to reconfigure a wide variety of jobs, and potentially create many more new jobs. The impacts will likely be felt widely but unevenly, with some occupational sectors — including Software Development — highly exposed to GenerativeAI, while others — including Driving — will feel fewer direct impacts. Even so, regardless of intensity, those effects will take some time to play out.
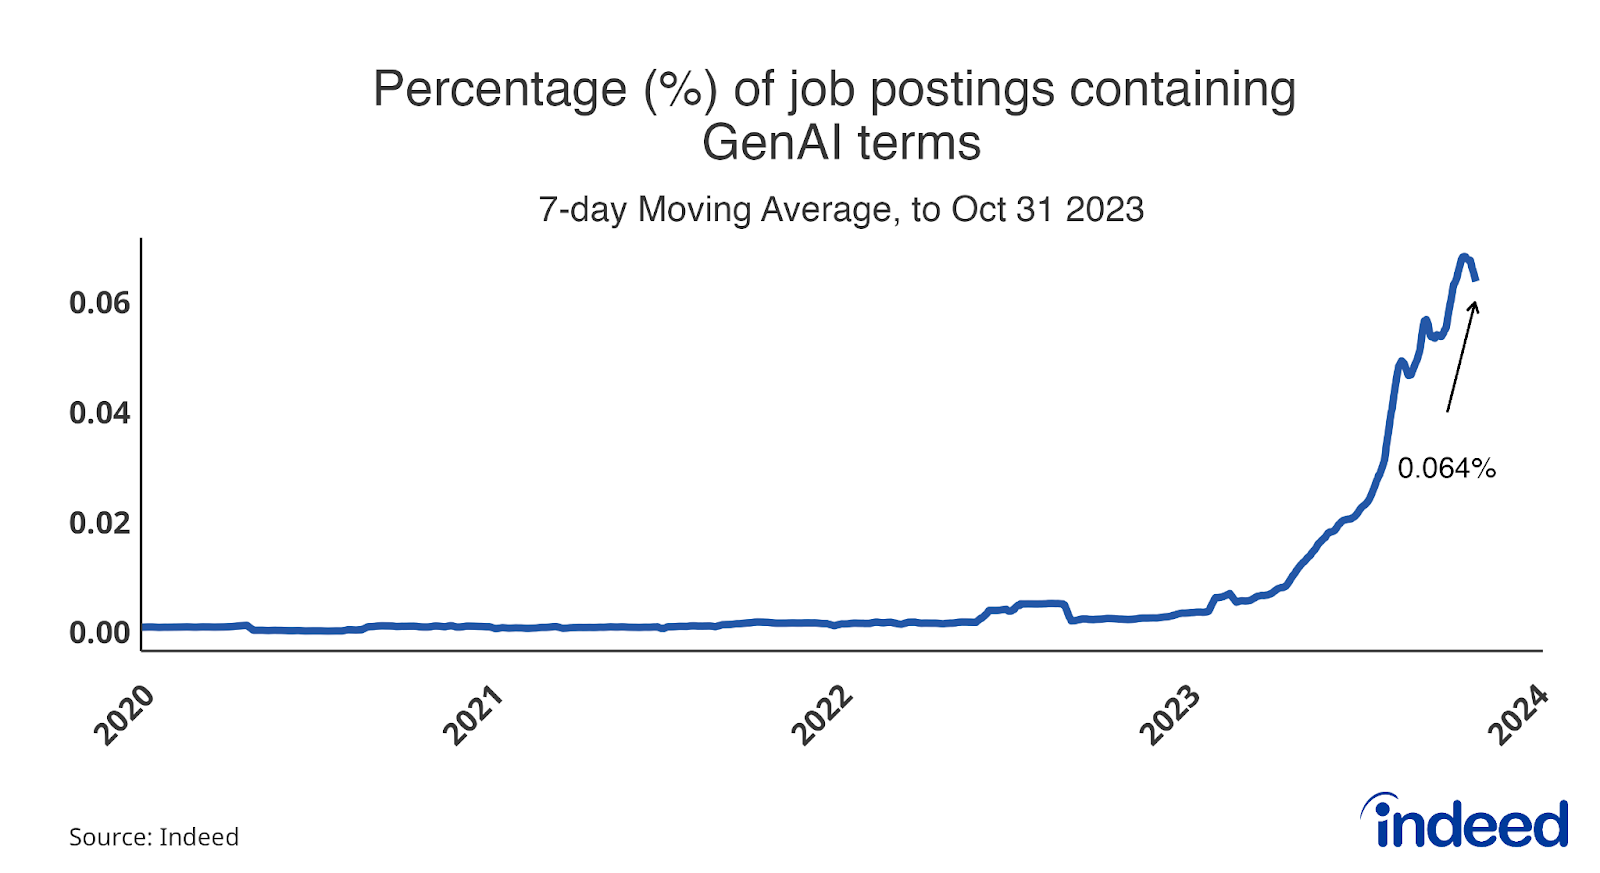
We’ll have to wait to see the long-term effects of GenAI, but it’s clear right now that jobs related to the field are surging. At the beginning of 2023, 0.003% of job postings mentioned terms related to Generative AI. This share stood at 0.06% by the end of October, a 20 times increase. Of course, only 6 in 10,000 job postings means Generative AI jobs aren’t very common, even if they are growing rapidly. Our measure not only captures jobs that create Generative AI tools, but it also accounts for postings that mention if the role will use a GenAI tool. Marketing jobs are a good example — while most Marketers aren’t actively creating AI tools, they are certainly using them in their work, and showing up in our tracker as a result.
Increased usage of GenAI and other technologies — in addition to an increase in jobs developing those tools — could reshape the broader labor market. GenAI jobs might increase in the years ahead, but if the growth comes primarily from those jobs that create the tools, without corresponding growth in roles that simply use these tools, the economic impact of AI and GenAI could be small. For example, the power of personal computing didn’t become apparent until it was used in a mass capacity, not just in a few technology and research companies. So when it comes to GenAI jobs moving forward, we’ll be sure to track the overall level and the occupational sectors leading the way.
Conclusion
In many ways, these first few post-pandemic years are uncharted territory. More evidence emerges daily that our economic maps and contingency plans may be outdated and insufficient to guide us on what comes next. So far, the labor market has shown that a high-demand environment and tight labor supply need not be permanently inflationary. Wage growth can slow without a spike in unemployment. Workers who left the labor market can be drawn back. The optimistic view of the market may actually be the correct view.
It’s also possible that we are entering a period in which the easiest hurdles on the road to a soft landing have already been cleared, leaving only the highest and most difficult for the last mile of the race. That the labor market’s journey to this point has been relatively painless does not guarantee that actual pain is not coming. The full effects of the past 20 months of tightened monetary policy may be ahead of us, and things may slow further, as is widely expected. And if conditions do not continue to cool as expected, then the Federal Reserve may feel it has no choice but to tighten the screws even further, forcing a more immediate slowdown in place of the only gradual one we’ve seen so far.
There’s a case for optimism for 2024, but it’s best not to oversell it.
Methodology
Data on seasonally adjusted Indeed job postings are an index of the number of seasonally adjusted job postings on a given day, using a seven-day trailing average. February 1, 2020, is our pre-pandemic baseline, so the index is set to 100 on that day. We seasonally adjust each series based on historical patterns in 2017, 2018, and 2019. We adopted this methodology in January 2021. Data for several dates in 2021 and 2022 are missing and were interpolated. Non-seasonally adjusted data are calculated in a similar manner except that the data are not adjusted to historical patterns.
The number of job postings on Indeed.com, whether related to paid or unpaid job solicitations, is not indicative of potential revenue or earnings of Indeed, which comprises a significant percentage of the HR Technology segment of its parent company, Recruit Holdings Co., Ltd. Job posting numbers are provided for information purposes only and should not be viewed as an indicator of the performance of Indeed or Recruit. Please refer to the Recruit Holdings investor relations website and regulatory filings in Japan for more detailed information on revenue generation by Recruit’s HR Technology segment.
To calculate the average rate of wage growth, we follow an approach similar to the Atlanta Fed US Wage Growth Tracker, but we track jobs, not individuals. We begin by calculating the median posted wage for a given country, month, job title, region, and salary type (hourly, monthly, or annual). Within each country, we then calculate year-on-year wage growth for each job title-region-salary type combination, generating a monthly distribution. Our monthly measure of wage growth for the country is the median of that distribution. Alternative methodologies, such as the regression-based approaches in Marinescu & Wolthoff (2020) and Haefke et al. (2013), produce similar trends. More information about the data and methodology is available in a research paper by Pawel Adrjan and Reamonn Lydon, Wage growth in Europe: evidence from job ads, published in the Central Bank of Ireland’s Economic Letter series.
The analysis of Generative AI job postings involved extracting job postings directly related to Generative AI, using specific keywords indicating its presence, such as “Generative AI,” “Large Language Models,” and “Chat GPT.”
We assess foreign job seeker interest in the US by tracking the share of total clicks on Indeed job postings in the US by job seekers with IP addresses outside of the US. Job seekers whose location could not be determined were removed from the analysis.
We calculate pay transparency share in US job postings by dividing the number of unique job postings with a salary into a total count of unique advertisements in a given month. Pay information is extracted from postings published on Indeed.com. Salaries advertised as being paid daily or weekly are omitted from the analysis.
The analysis of the potential increases in the labor force participation rate assumes that labor force participation rates for workers ages 25 to 34, ages 35 to 44, ages 45 to 54, and ages 65 plus would all return to their respective all-time highs. We don’t assume an increase for workers ages 55 to 64 as that group is already at an all-time high. The participation rates are all calculated as the annual average of the non-seasonally adjusted data. The increases in these rates are all assumed to take place over 2-year periods. These participation rates are then applied to the Congressional Budget Office’s January 2023 report, The Demographic Outlook: 2023 to 2053.