Editor’s Note: Indeed’s AI at Work is a series of insightful research reports from Hiring Lab, Indeed’s economic research arm. This research is designed to provide data and new insights into the impact of AI on the labor market to help employers and job seekers better understand and prepare for the changing workforce. For a PDF summary of key findings from this research, please click here.
Key Findings:
- Every job faces some amount of exposure to potential change as generative artificial intelligence (GenAI) tools become more widespread, which means every worker in those jobs also faces some potential exposure.
- Jobs that employ a large share of young workers aged 16-24, including food preparation & service, generally have less exposure to GenAI. As workers age into their mid-career years, they tend to move into roles that require skills that are more exposed to GenAI.
- Women tend to work in jobs with slightly more exposure to GenAI than men, but the differences are minor.
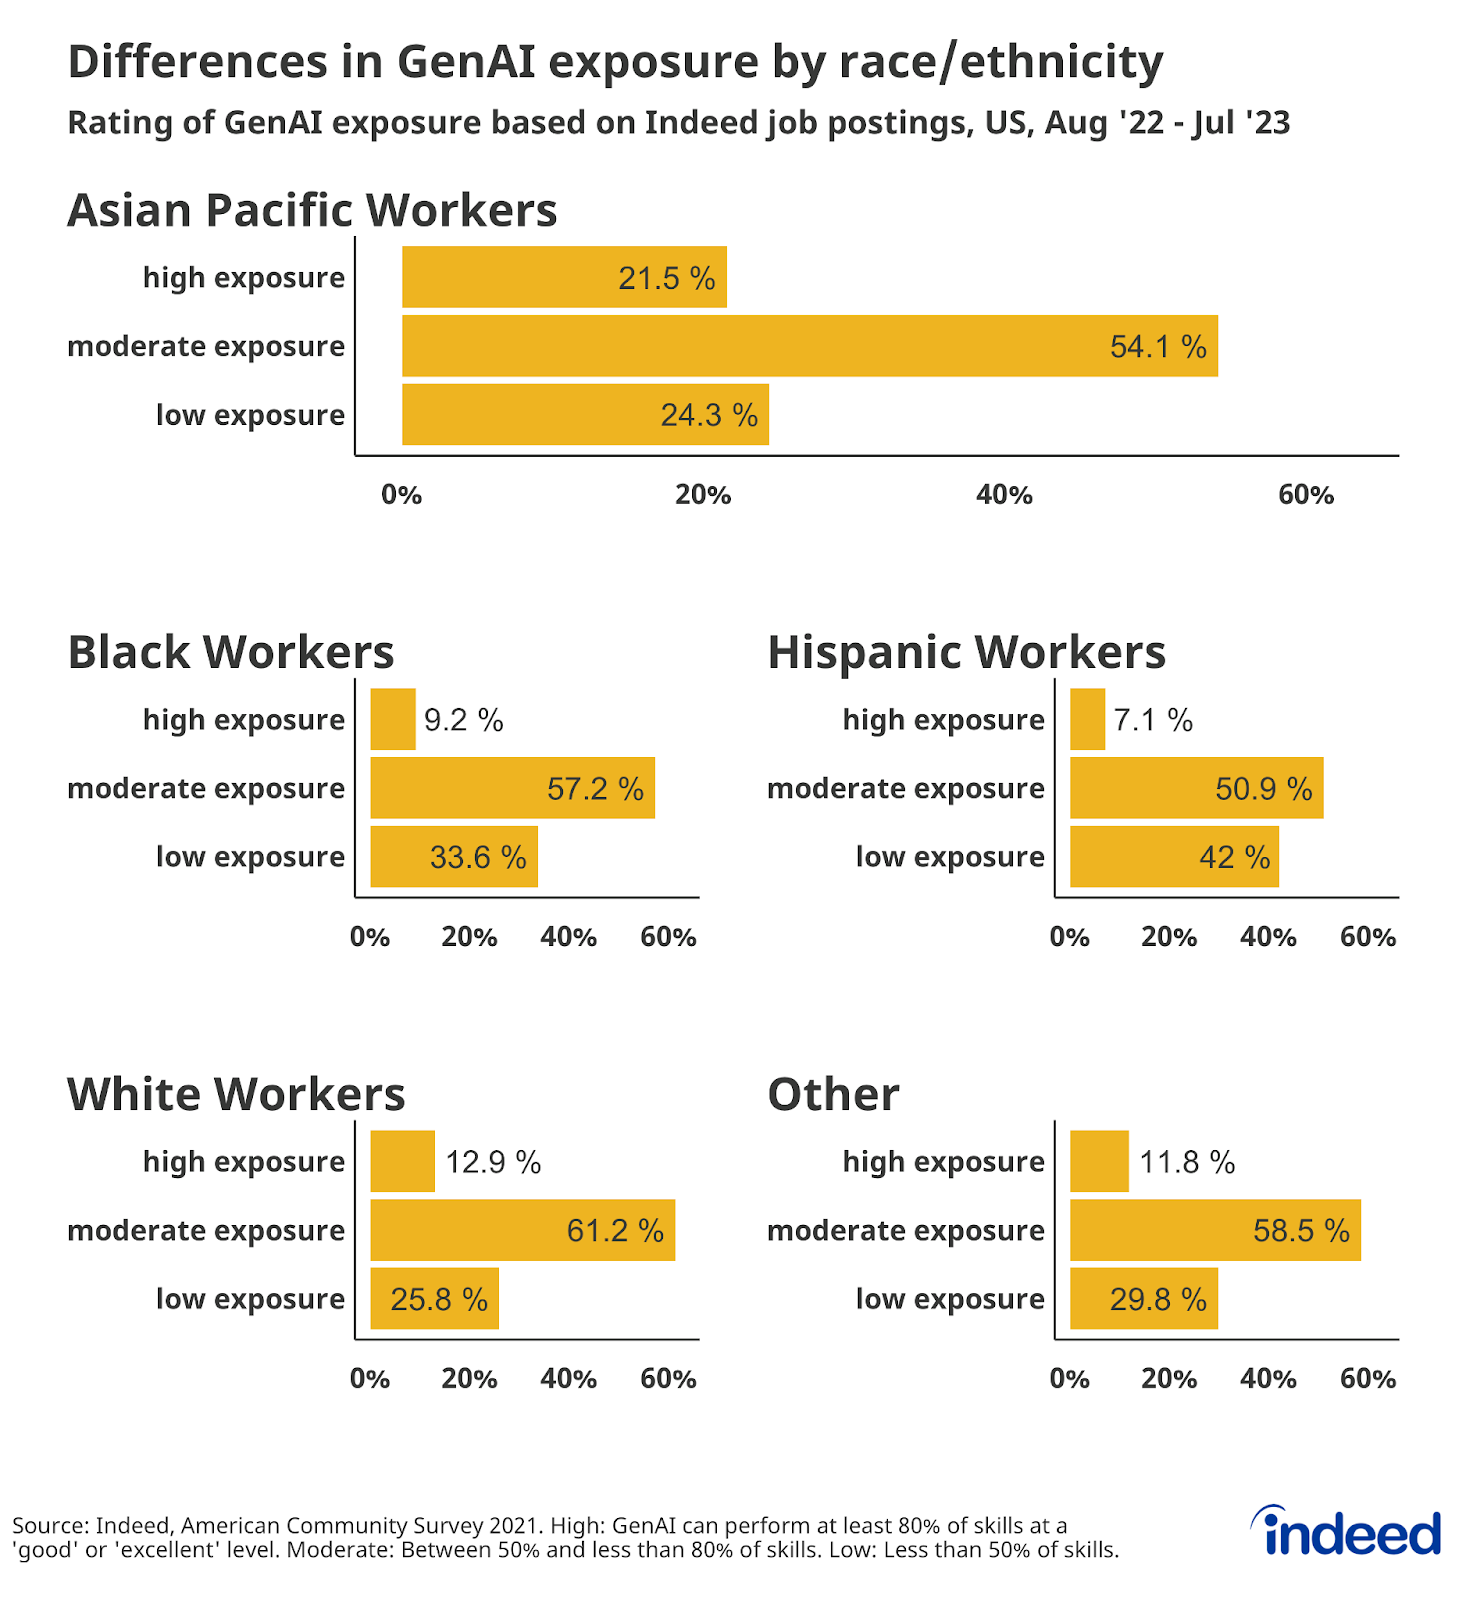
- The biggest demographic differences in exposure to GenAI are by race & ethnicity. Asian American/Pacific Islander workers tend to be more represented in jobs with the highest potential exposure to GenAI, while Hispanic workers are employed in occupations with the least potential exposure.
Since every job faces some amount of exposure to potential change as generative artificial intelligence (GenAI) tools become more widespread, then every worker in those jobs also faces some potential exposure. But who a worker is — their age, gender and/or race — is not nearly as big an indicator in determining the level of their potential exposure to GenAI as what that worker does.
Still, understanding who is currently most exposed to GenAI is important for policymakers and employers as they make decisions on the use of the technology going forward. It is also important for workers to know how their exposure to GenAI is likely to change as they move throughout their careers, advancing through the ranks and/or periodically changing fields altogether.
Indeed Hiring Lab paired our earlier work examining the skills most and least exposed to GenAI with data on age, gender, and race from the Census Bureau’s American Community Survey. Exposure to GenAI is rated as “high,” “moderate,” and “low.” If GenAI rates itself as “good” or “excellent” at performing 80% or more of the skills inherent in a given field, that field is determined to have high potential exposure. Jobs in which between 50% and less than 80% of skills can be performed in a “good” or “excellent” manner were determined to have a moderate potential exposure to GenAI. Jobs in which less than half of skills could be done in a “good” or “excellent” manner were determined to have a low potential for exposure.
On average, younger, male, and/or Hispanic people tend to work in fields that GenAI is less likely to disrupt. The results also suggest that, independent of their race/gender/age, workers’ exposure to GenAI may change as they move into and out of certain occupations over time.
A question for the ages
Among all demographic factors examined for this analysis, age is the only one that changes over the course of a worker’s career. As workers age and the types of jobs for which they are qualified change, so too does their potential exposure to GenAI — from relatively limited in their earliest working years, to more exposed by their mid-career years, to somewhat less exposed again when they are at their oldest.
Fields that tend to employ the youngest workers also face the lowest potential exposure to GenAI. Just 5.6% of employed workers aged 16-24 work in fields determined to have the highest potential exposure to GenAI, while 38.4% of workers in this age group work in occupations with the lowest potential exposure.
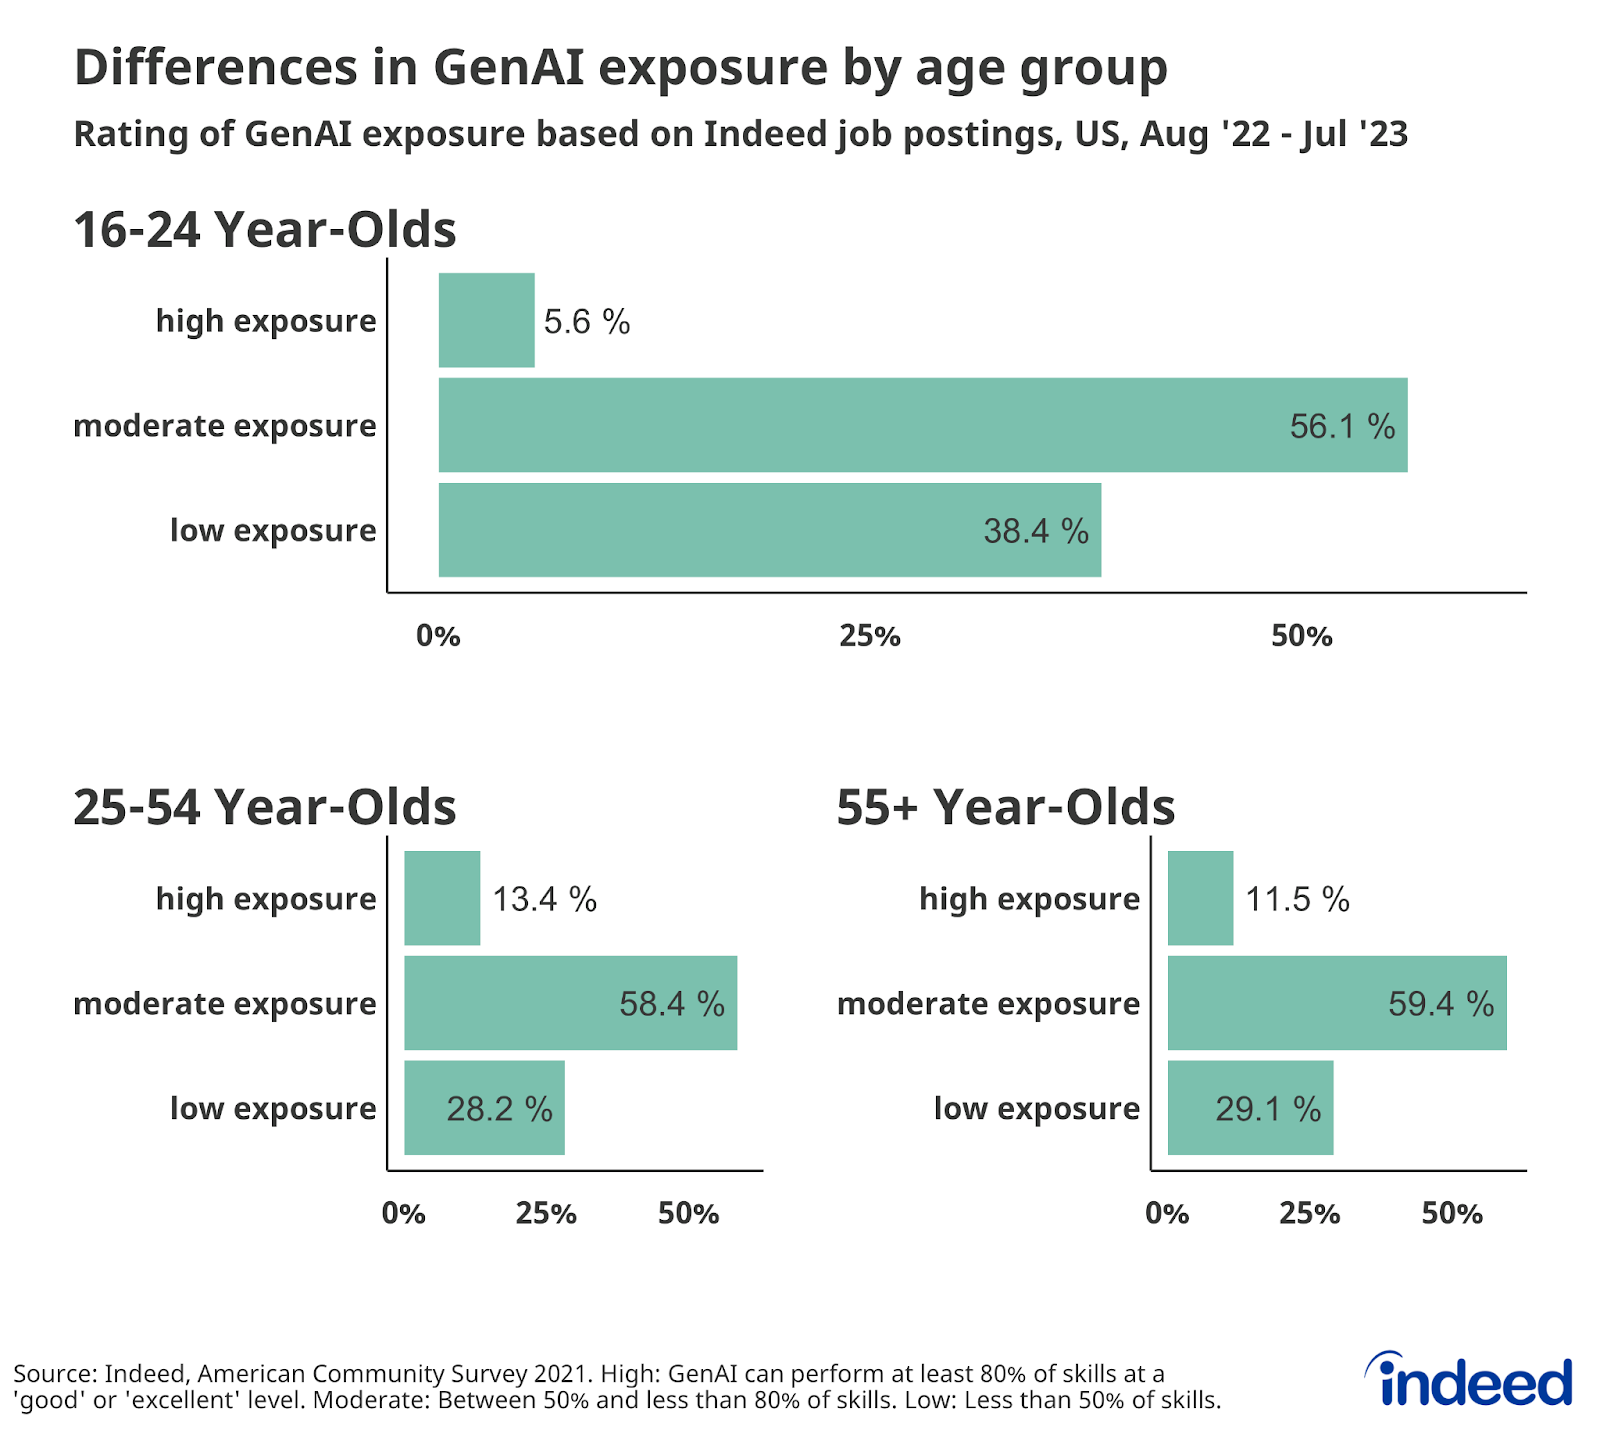
Mid-career professionals face the highest potential exposure to GenAI — 13.4% of workers aged 25-54 work in a highly exposed role, while only 28.2% work in a field determined to be least exposed. Exposure to GenAI-driven change fades slightly as workers continue to age, with 11.5% of the oldest US workers, those aged 55+, working in highly exposed fields and 29.1% working in the least-exposed fields.
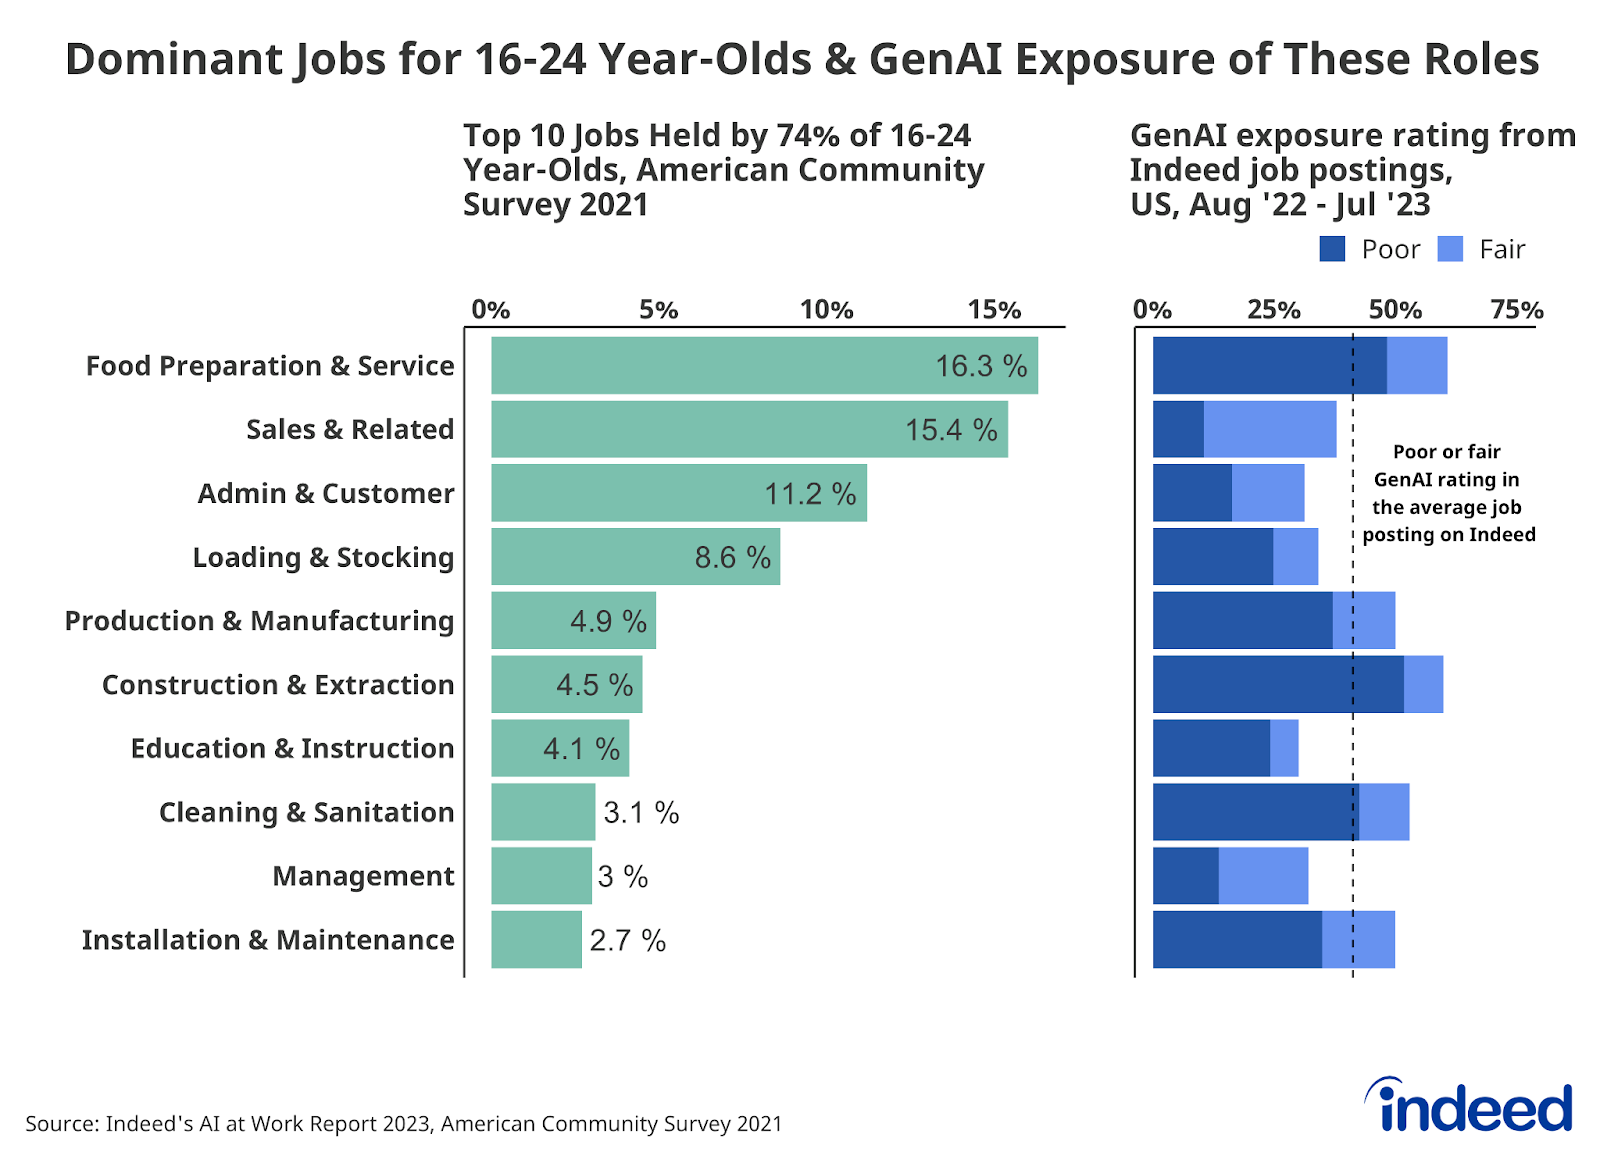
Younger workers are potentially more insulated from GenAI-driven change because of the fields they tend to work in. Because many of these younger workers have limited professional experience and/or have not yet completed their education, they tend to cluster in roles where advanced skills are not as necessary and/or where required skills can be learned quickly on the job. For example, 16.3% of employed 16-24-year-olds work in food preparation & service jobs, the most common job in that age group and one that does not require particularly advanced skills nor skills that GenAI is particularly good at. GenAI is “poor” or “fair” at 60.6% of skills required for the typical food preparation & service job. GenAI is worse at performing five of the 10 most common jobs held by 16-24-year-old workers than it is at the average job posted on Indeed over the past year — the share of skills it can do in a “good” or “excellent” manner is lower than it is in the typical job posting.
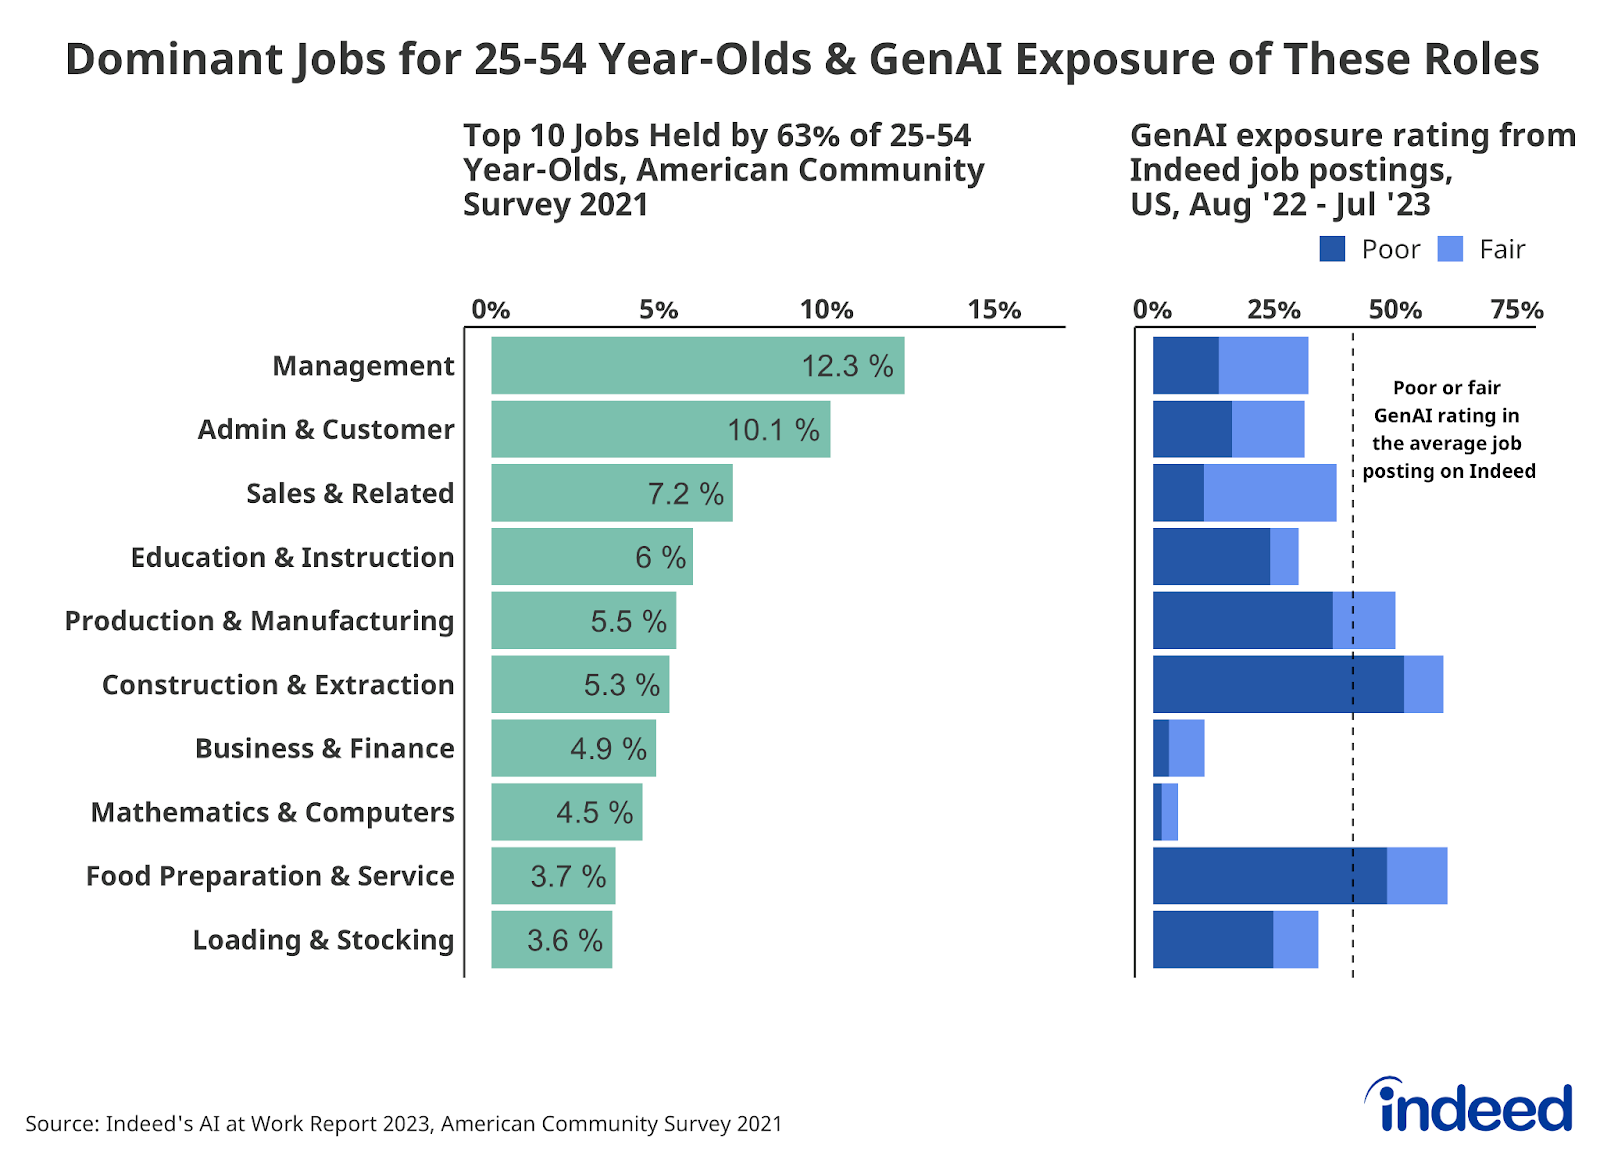
As they finish their education and/or gain new skills through work experience as their career develops, young workers then move into comparatively more exposed jobs as they age. Yes, many mid-career workers aged 25-54 do work in fields like food preparation/service in which fewer skills are subject to GenAI exposure, but the shares of these workers employed in these fields are much smaller. While roughly 1-in-6 (16.3%) employed 16-24-year-olds work in food prep/service, fewer than 1-in-20 (3.7%) employed 25-54-year-old workers work in that field.
But roughly 1-in-8 mid-career workers (12.3%) work in management — a field in which GenAI can perform 67.9% of required skills in a “good” or “excellent” manner — compared to just 3% of employed 16-24-year-olds. Management is a position achieved typically only after several years of experience have been gained — experience many 16-24-year-olds are likely to lack. While there is some overlap in the 10 occupations most commonly held by 16-24 and 25-54-year-olds, there is also a lot that is different between the two lists.
Several highly exposed occupations, including “Business & Finance” and “Mathematics & Computers,” do not appear on the list of the 10 most common fields for the youngest workers, but do appear on the list of common jobs for mid-career workers. These fields require not only experience but may also require an advanced academic degree, technical certification, and/or a specialized license — things older workers are much more likely to possess. GenAI is better at performing 7 of the 10 most common jobs for 25-54-year-olds than it is at the average job posted on Indeed over the past year (relative to a typical job posting, it can perform a higher share of skills in these jobs at a “good” or “excellent” level).
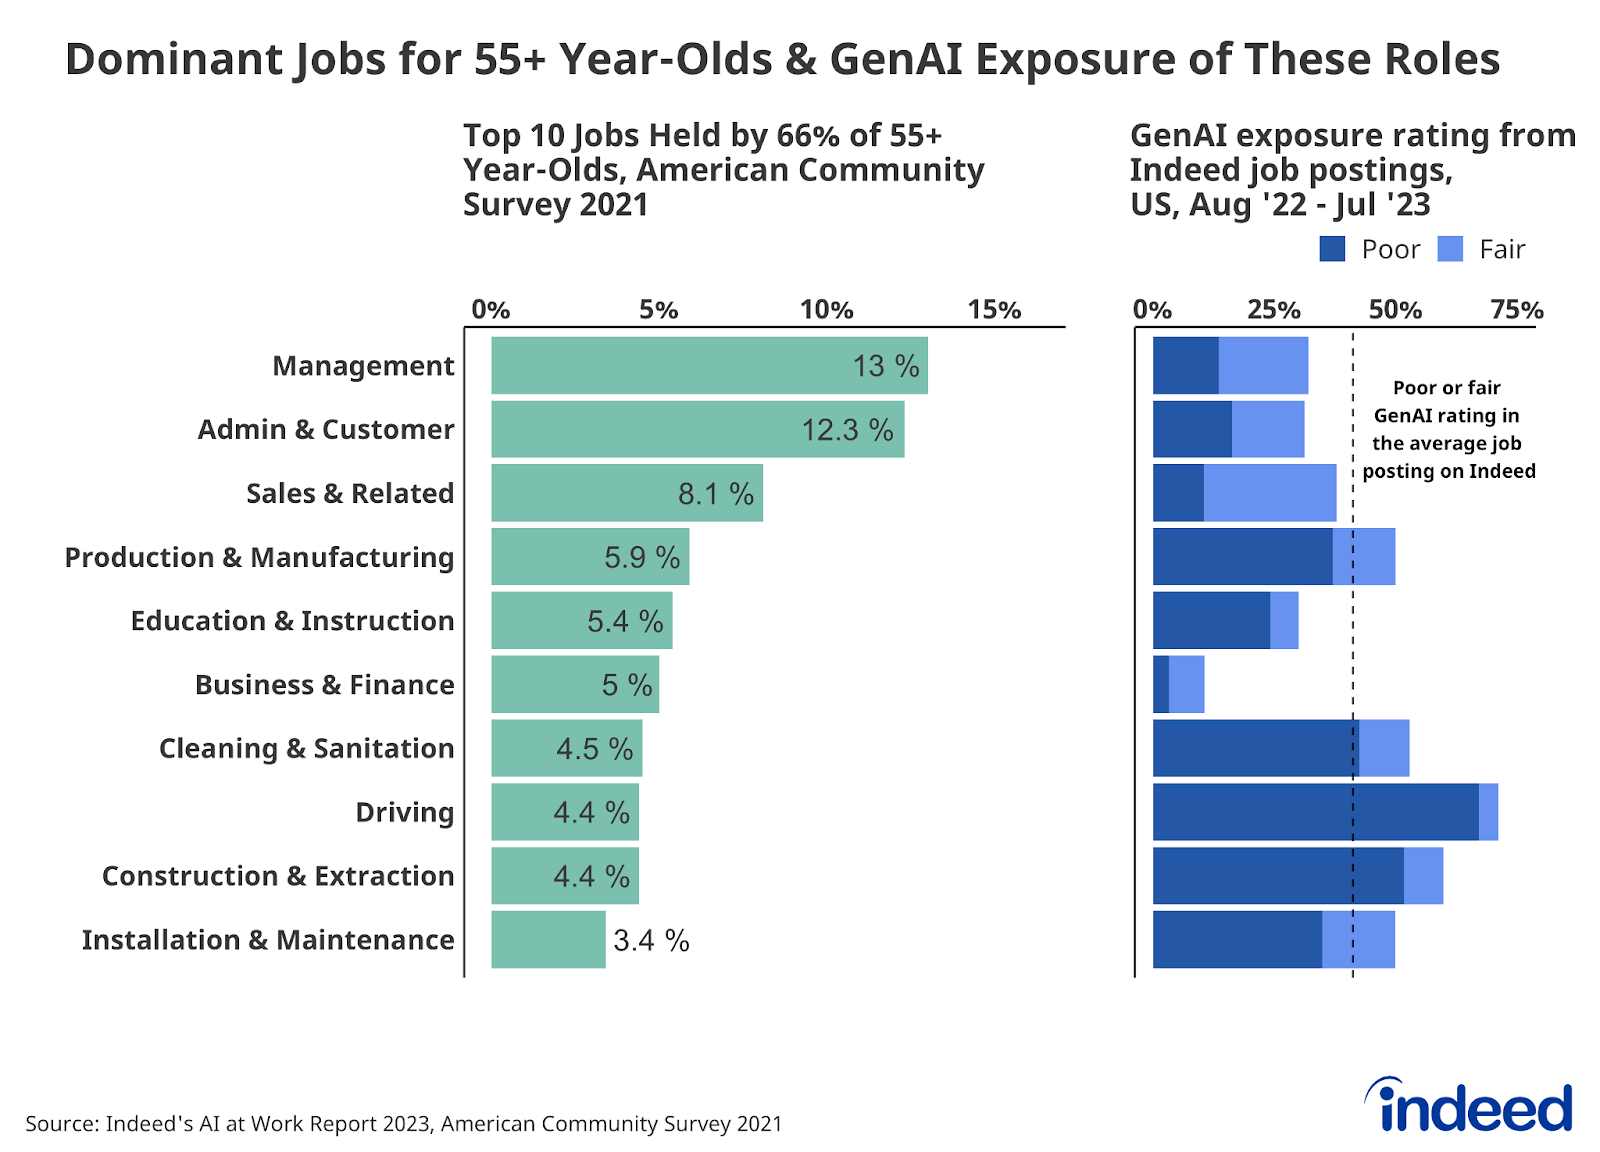
The list of the 10 most common jobs for the oldest workers — those aged 55 and up — includes a handful of occupations not found in the middle age group, including driving, and cleaning & sanitation, that GenAI largely does not possess the skills to perform reasonably well. Similar to their younger selves, the oldest workers tend to be employed in jobs that require the kinds of hands-on and/or socially interactive tasks at which GenAI falls short, reducing their potential exposure to the technology. GenAI is “poor” or “fair” at half or more of the skills inherent in 5 of the 10 most common jobs for those aged 55+.
On the basis of sex
Similar to workers of various ages, potential exposure to GenAI based on sex is also generally not determined by whether a given worker identifies as a woman or man, but rather by the jobs in which women and men are more commonly employed. And unlike differences in potential exposure across ages, the differences in potential exposure among men and women are far less pronounced.
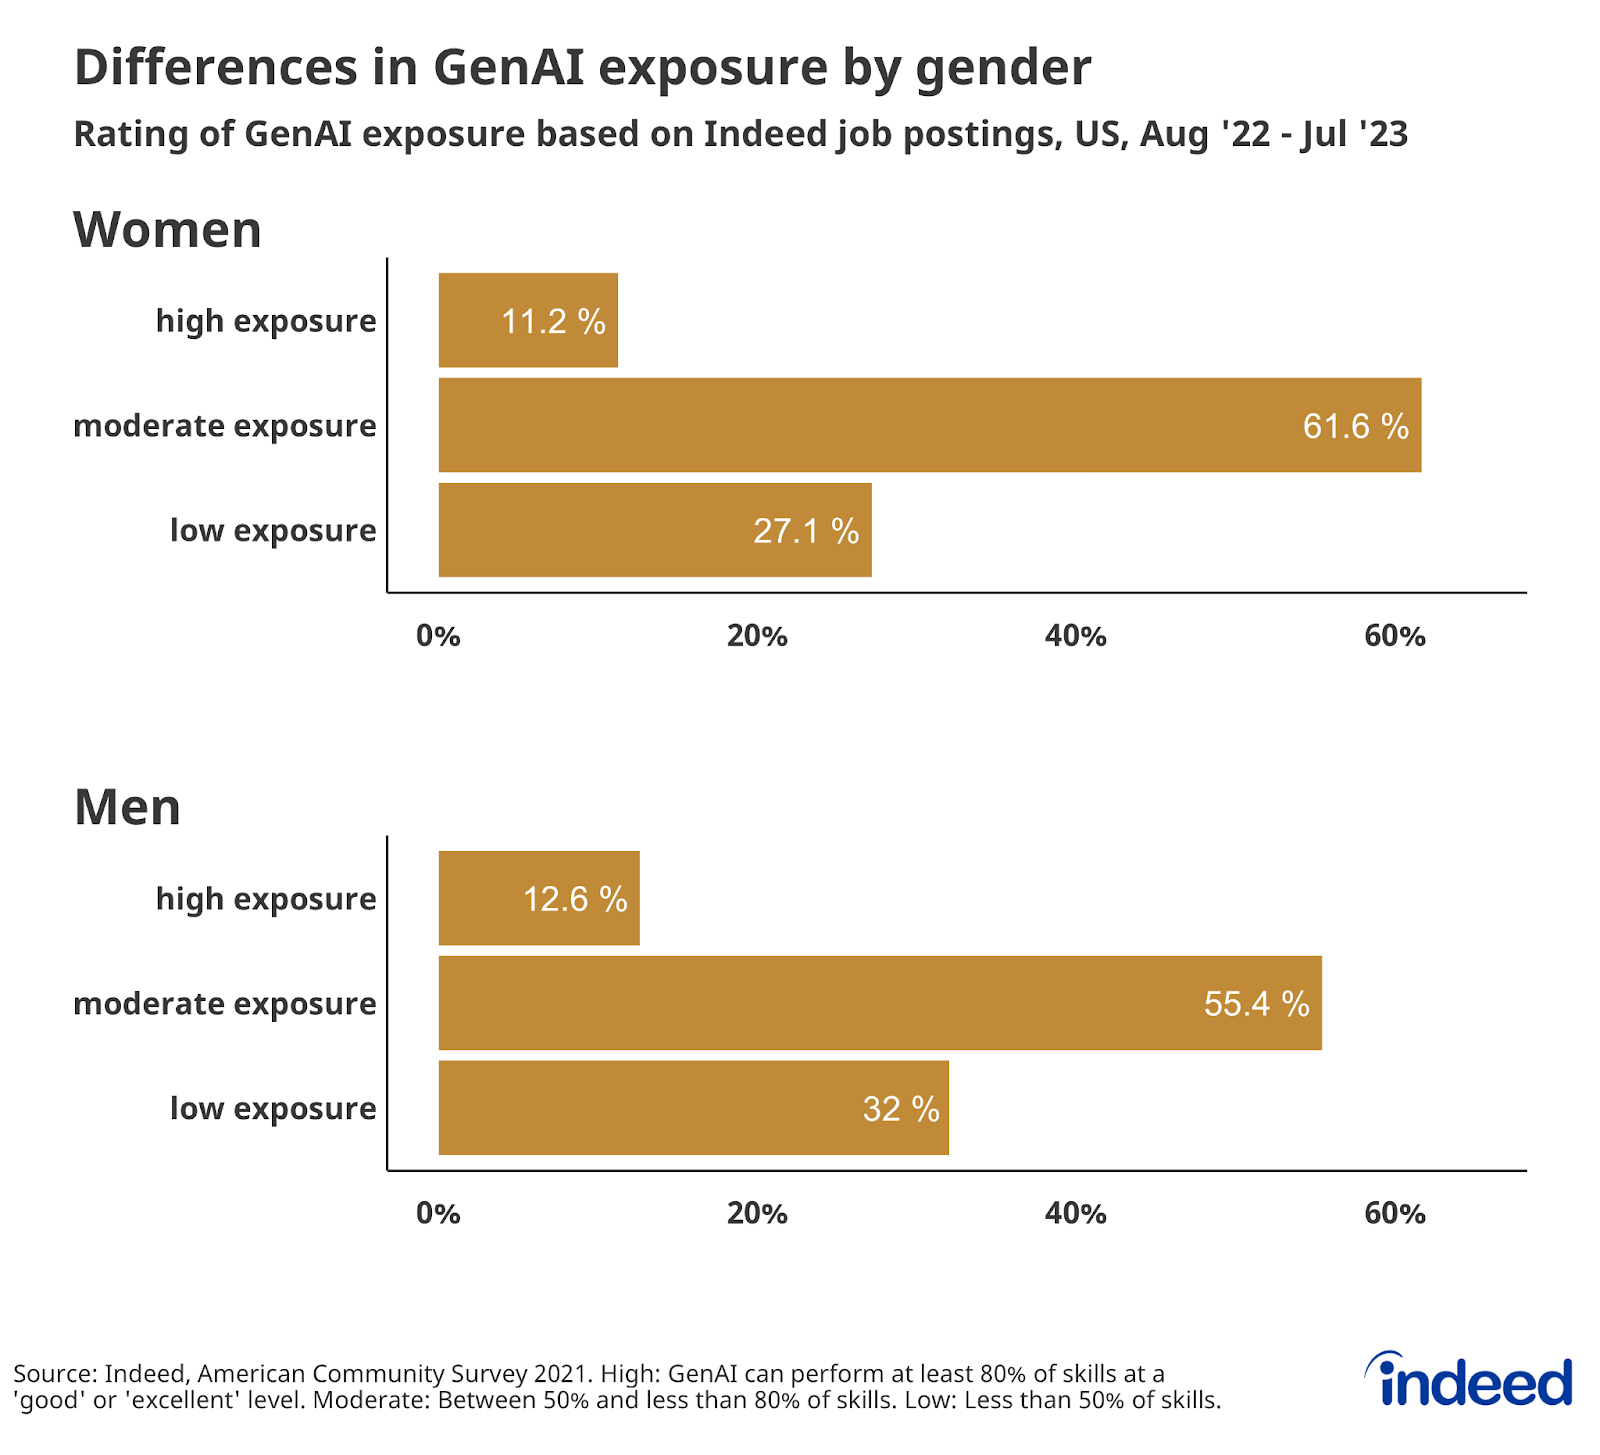
While a slightly higher share of men (12.6%) work in jobs with the highest level of potential exposure to GenAI than women (11.2%), the share of men working in the least exposed jobs is noticeably higher than women. Almost a third (32%) of men work in jobs with the lowest potential GenAI exposure, compared to only about a quarter (27.1%) of women. Roughly two-thirds (68%) of employed men work in fields that are moderately or highly exposed to GenAI, compared to almost three-quarters (72.8%) of women.
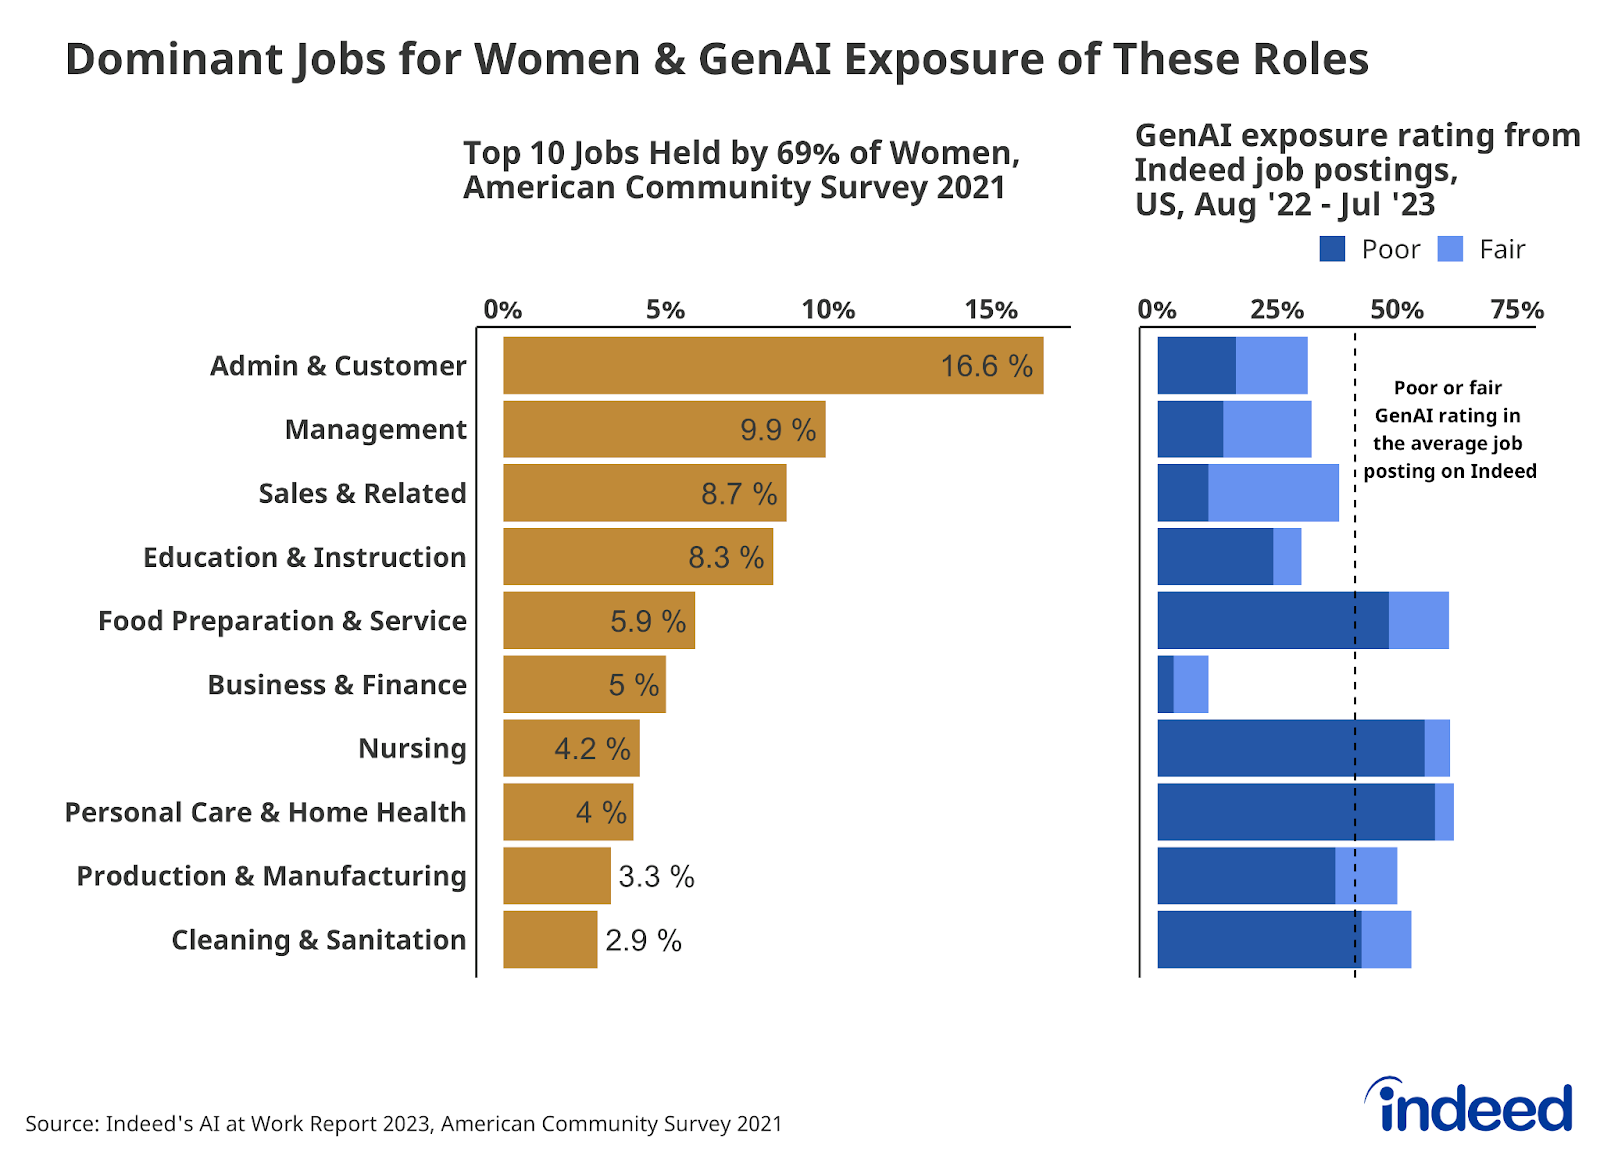
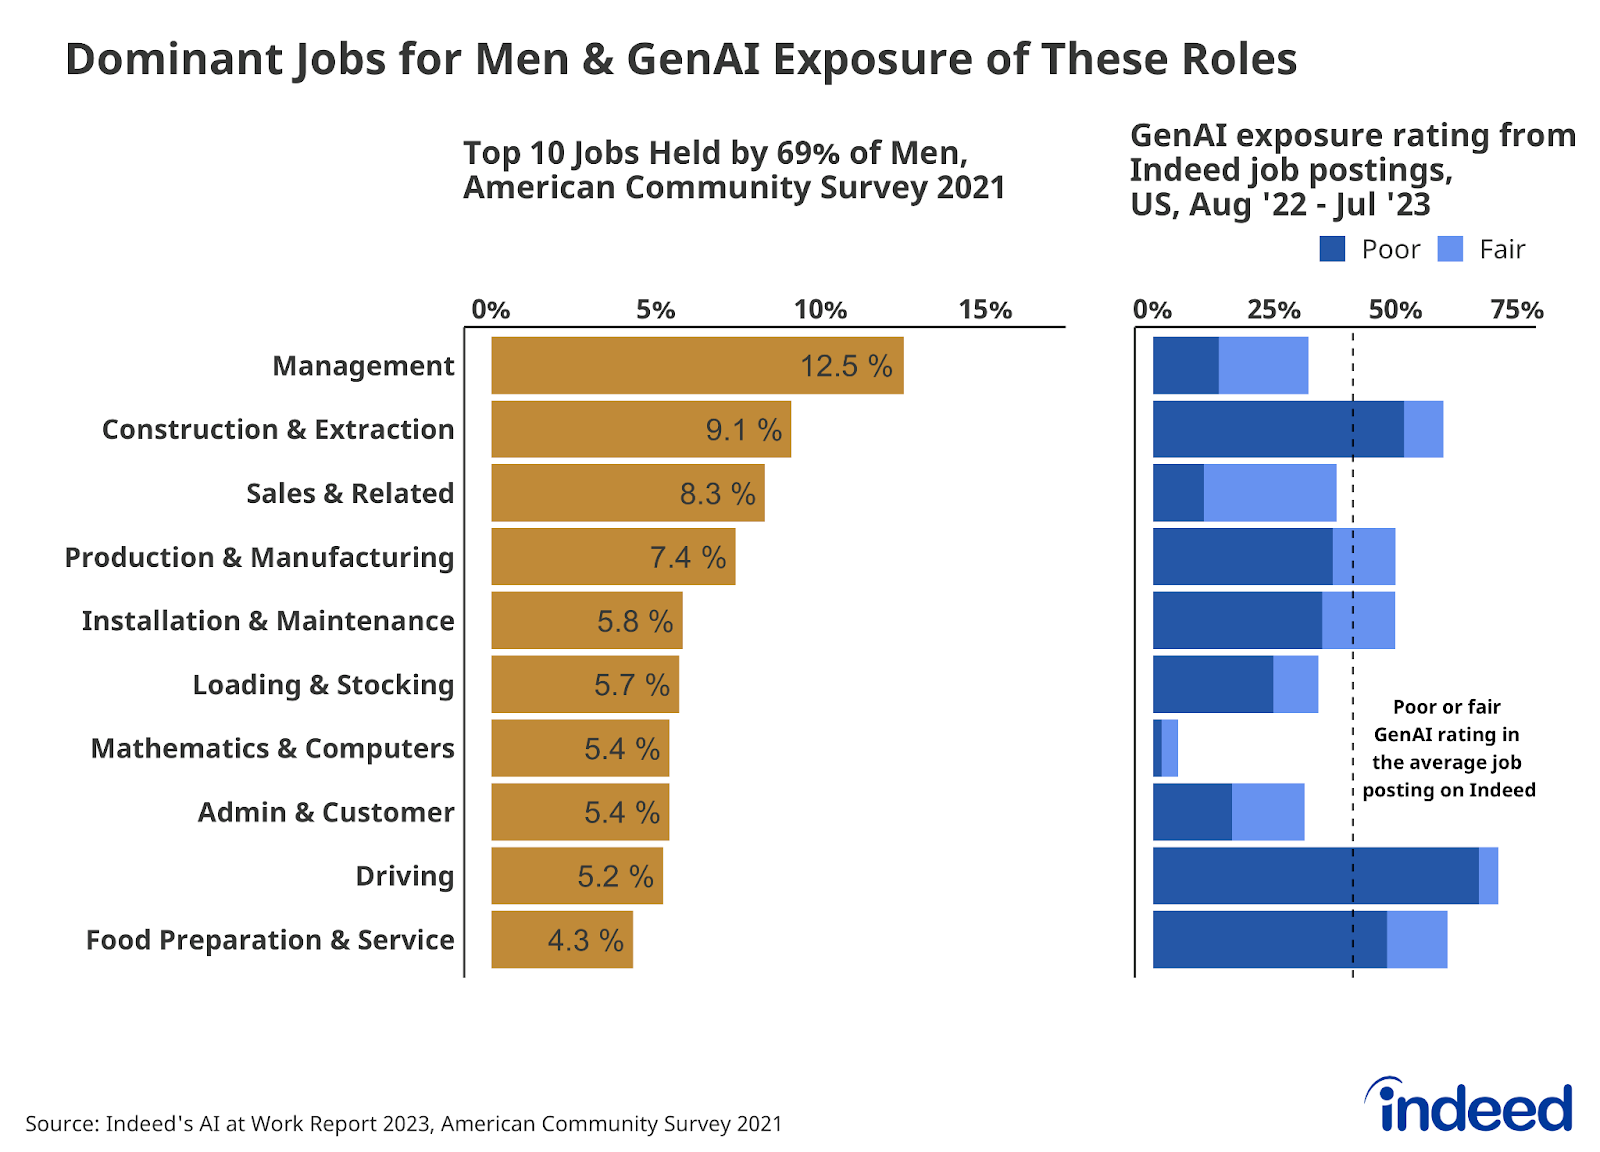
The lists of the 10 most common jobs for men and women, while different on the surface, have at least one important thing in common: Both men and women are well-represented in the kinds of hands-on and/or socially intensive jobs that GenAI tends to perform more poorly. For example, GenAI is “poor” or only “fair” at 59.7% of skills necessary for construction work — and almost 1-in-10 employed men (9.1%) work in construction. GenAI is “poor” or only “fair” at 60.9% of nursing tasks and 61.7% of personal care & home health tasks — sectors that employ a combined 8.2% of employed U.S. women. In five of the 10 most common jobs for both men and women, GenAI is worse than it is at the average job posted on Indeed.
The power of diversity
The largest demographic differences among groups by their potential exposure to GenAI-driven change in the jobs they tend to occupy is by race/ethnicity. Workers of Asian/Pacific Islander descent (AAPI) face the highest potential level of exposure: 21.5% of AAPI workers are employed in sectors with the highest level of potential exposure, and just 24.3% work in sectors with the lowest exposure. Hispanic workers face the least potential exposure — just 7.1% of Hispanic workers are employed in high-exposure fields, while 42% work in fields with the lowest potential exposure.
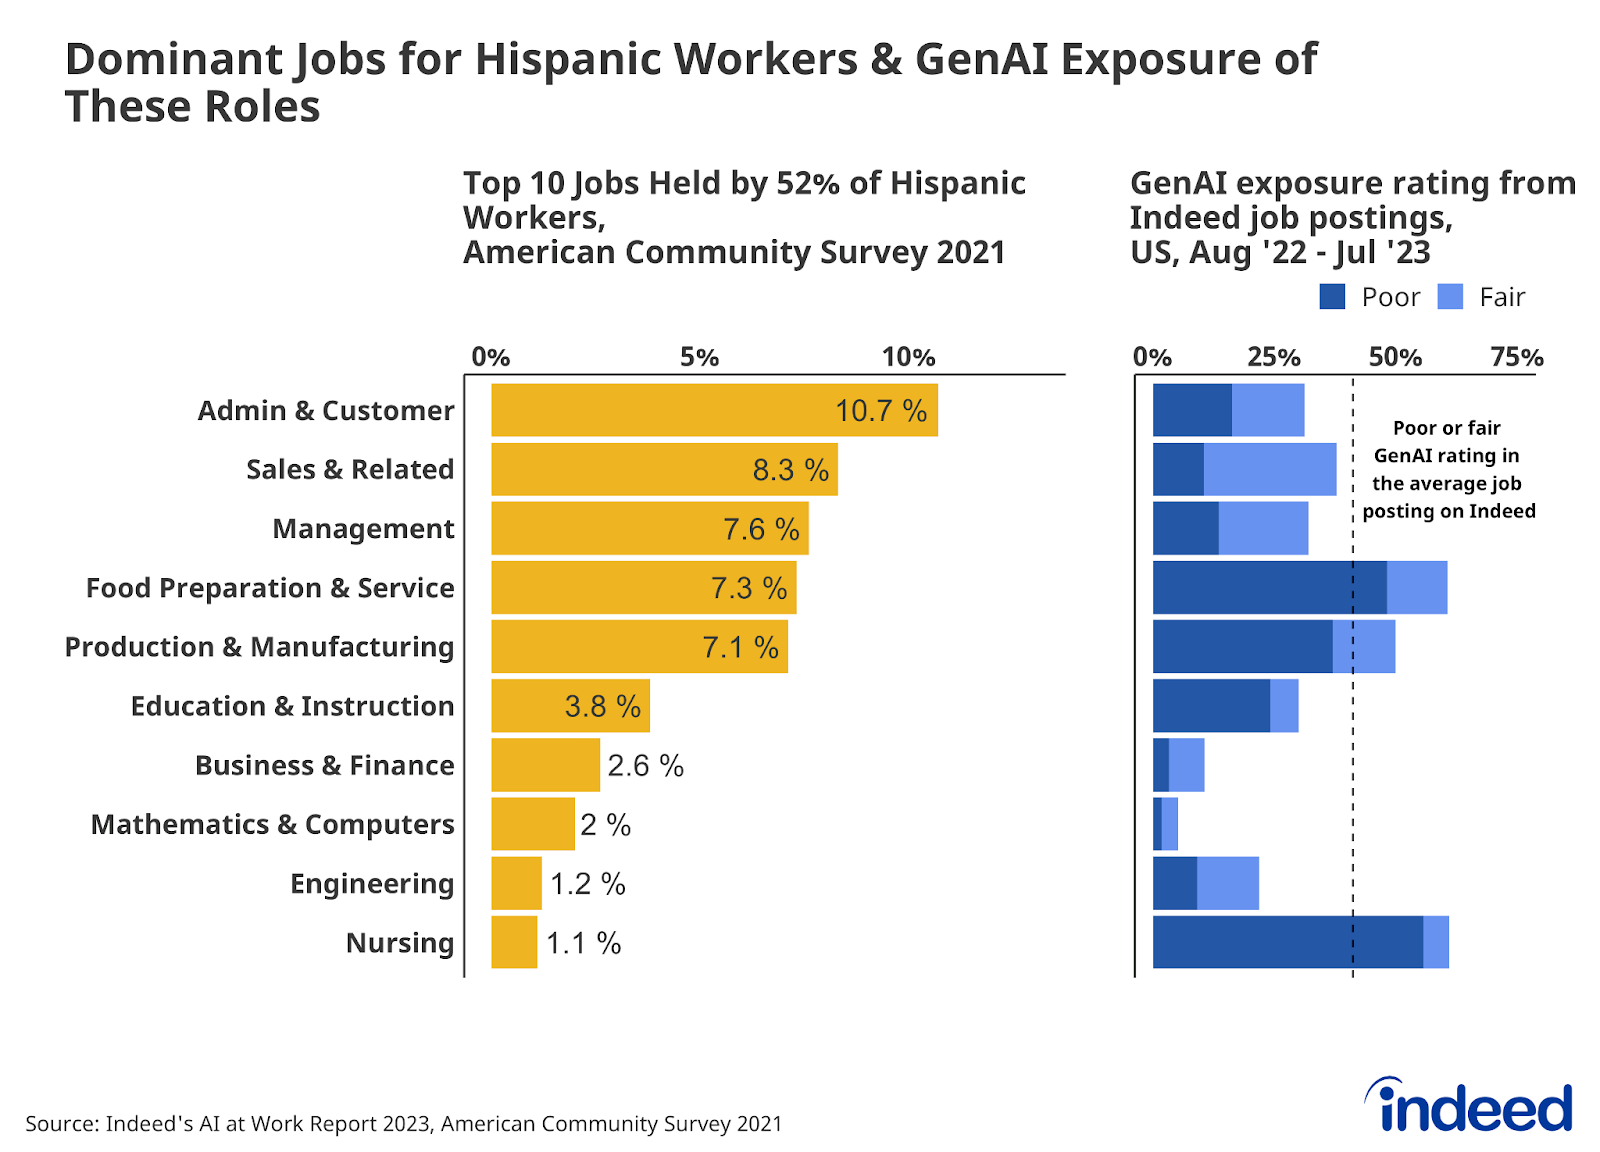
While workers of all races/ethnicities work across virtually every job category to some extent, some groups are simply more concentrated in certain sectors than others. And just like with age and gender, it is this concentration — or lack thereof — that helps determine their overall exposure to GenAI. If workers in a given group are more concentrated in a sector that requires skills GenAI is good at, then those workers will be more exposed. In cases where workers of a certain race/ethnicity are spread across a wider range of industries, as is the case with Hispanic workers, then they may be more insulated.
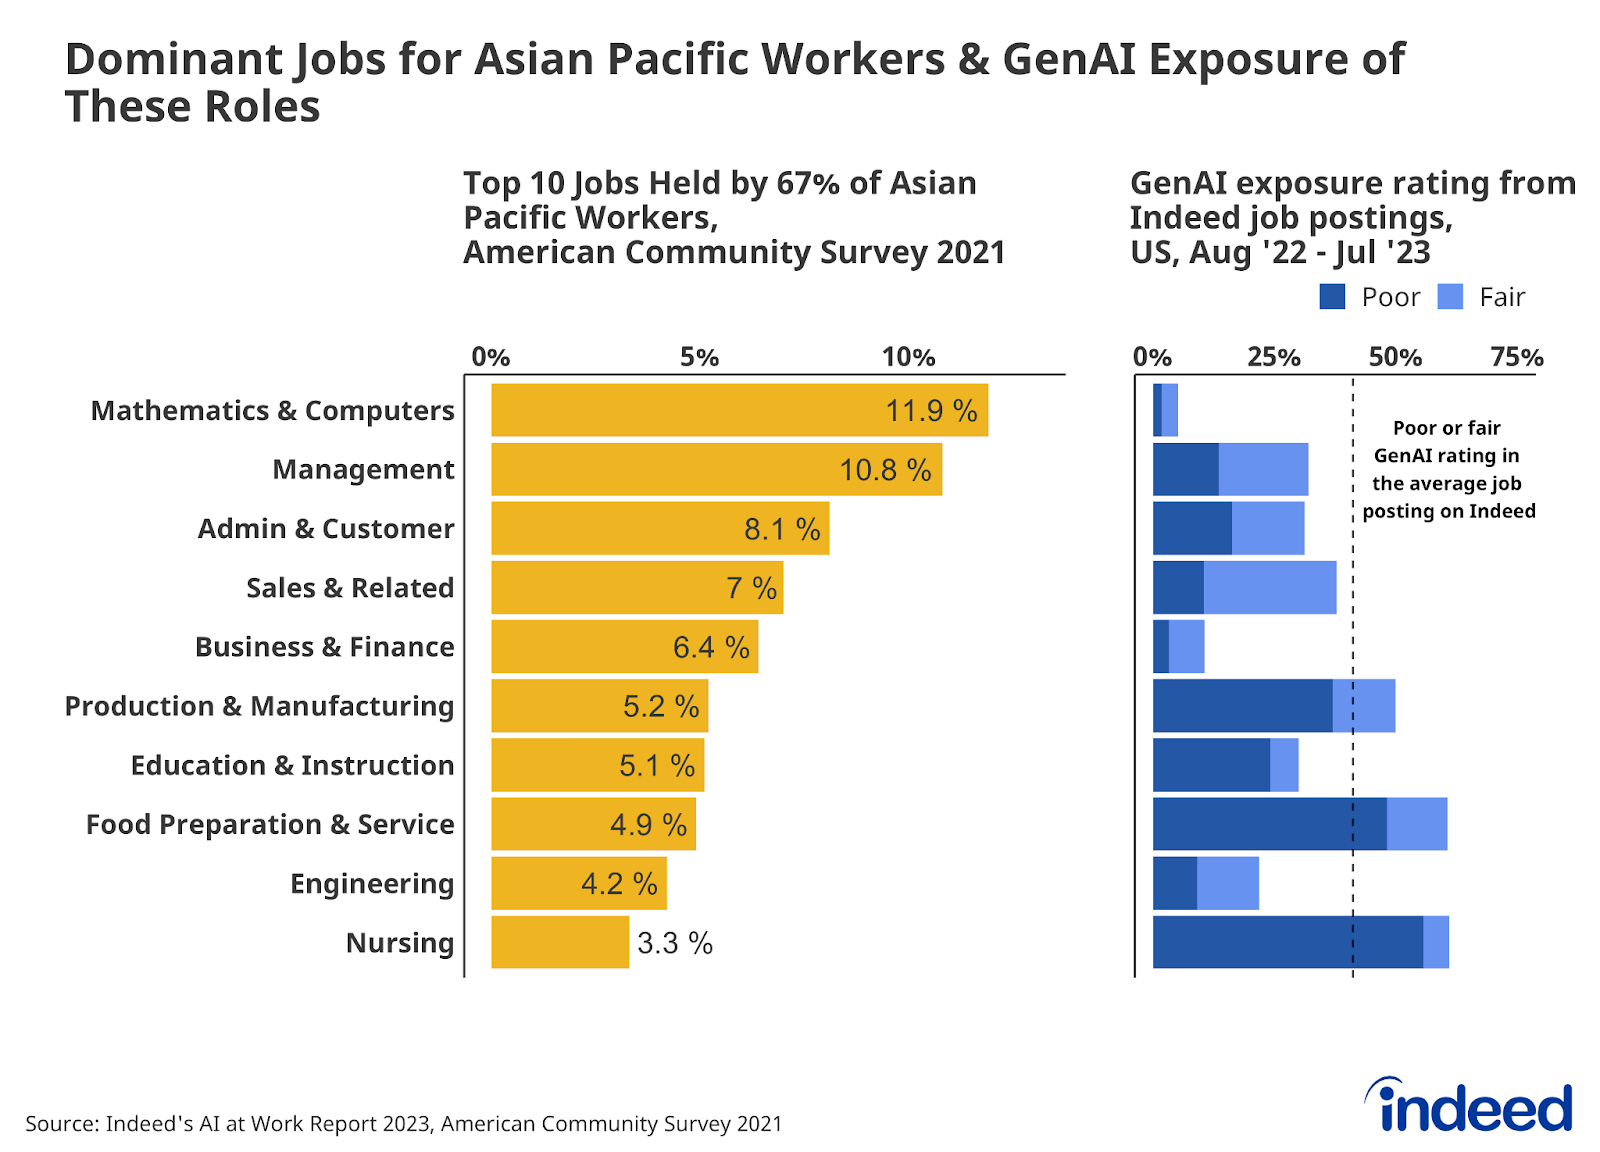
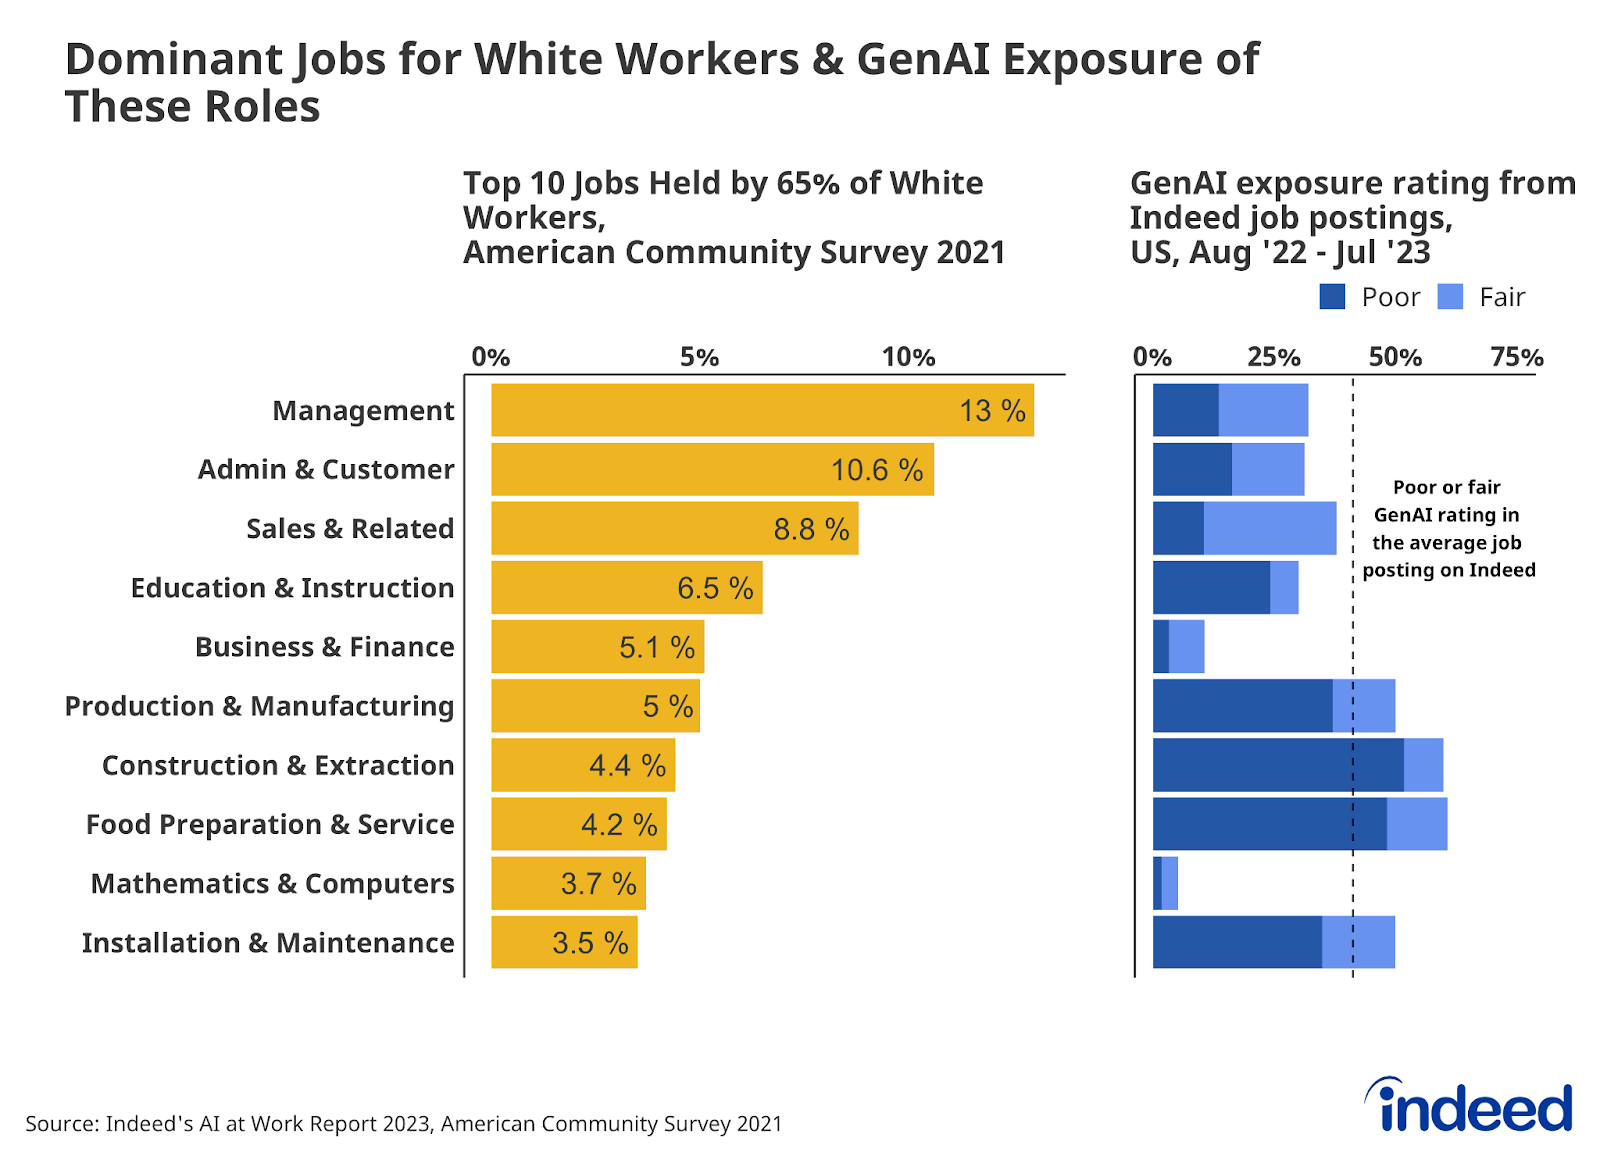
Mathematics & Computers is a good example of a sector that GenAI is well-poised to disrupt — it is “good” or “excellent” at performing almost all (94.9%) skills inherent to the field. Mathematics & Computer jobs also employ a fair number of workers from many groups — it is on the list of 10 most common occupations for white workers, AAPI workers, and Hispanic workers. But the concentration of AAPI workers in this field is significantly higher than for other races/ethnicities. Almost 1-in-8 (11.9%) AAPI workers are employed in Mathematics & Computers jobs, compared to 3.7% of employed white workers and 2% of employed Hispanic workers. Because AAPI workers are far more concentrated in a field that is known to be far more ripe for potential disruption than others, the average exposure of AAPI workers is pushed up.
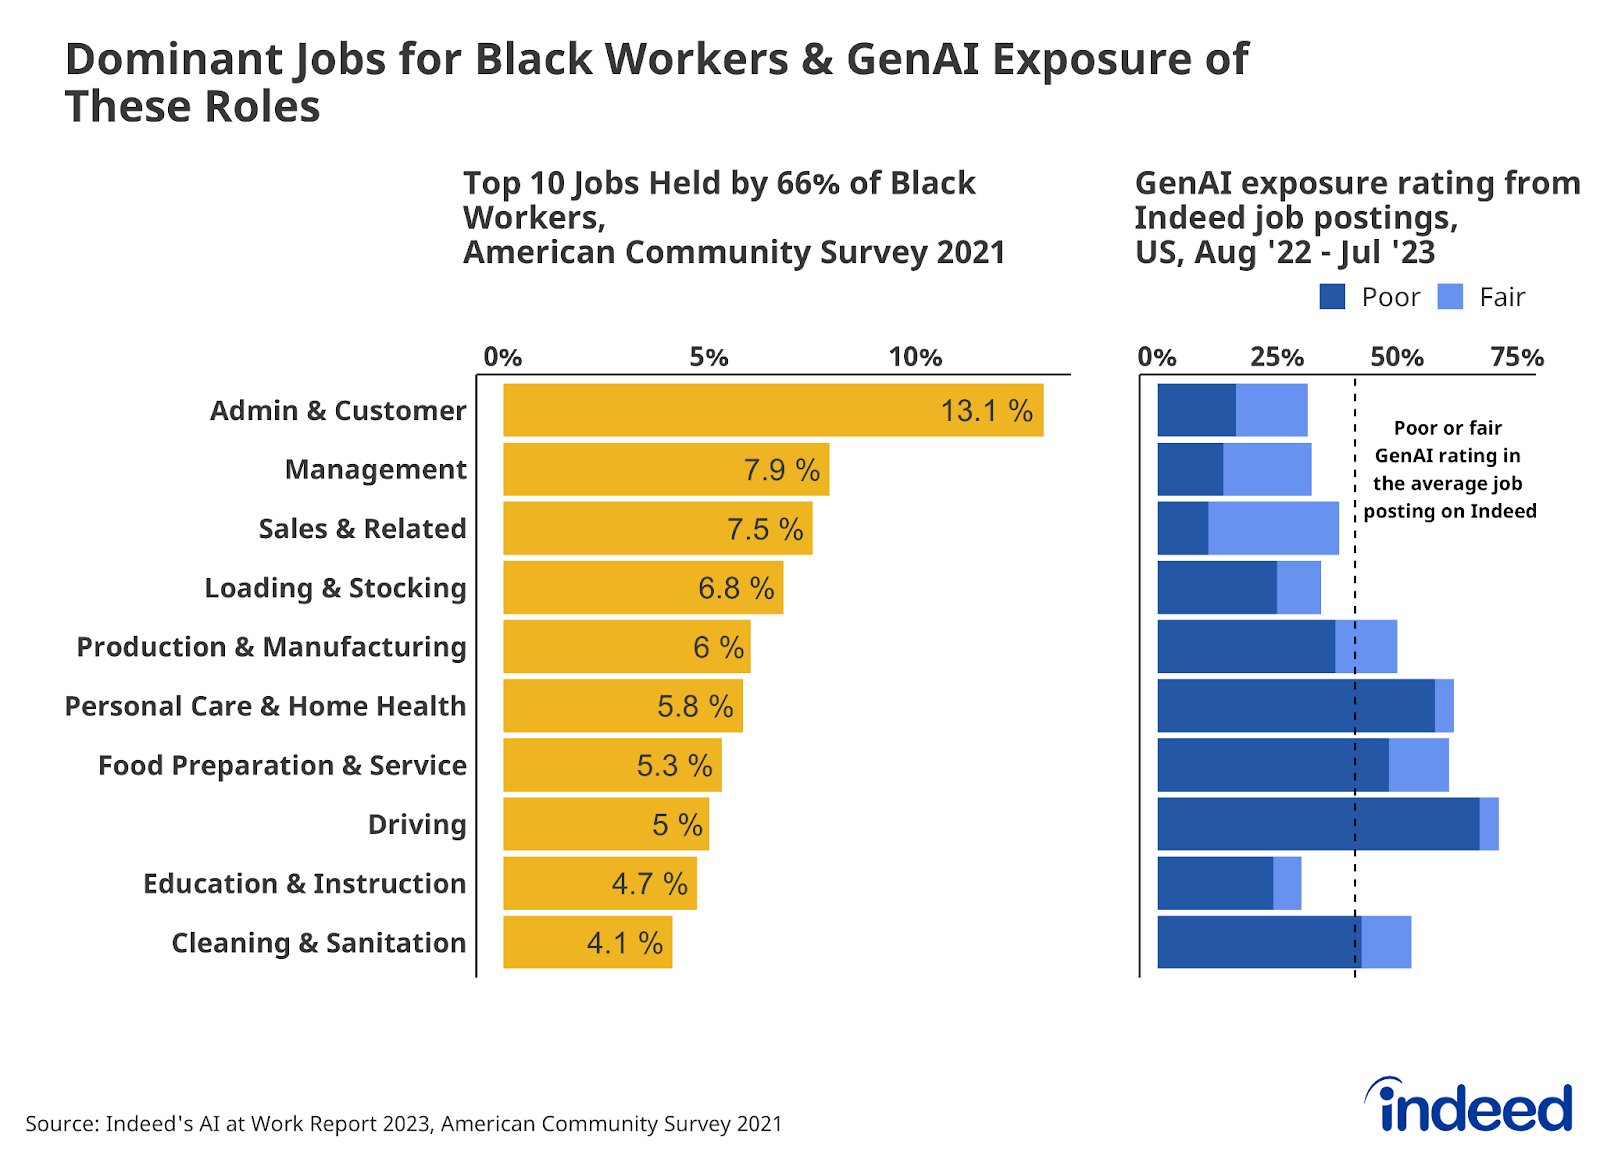
It is important to note that any average will fall well short of a complete picture of the impact of GenAI on individual workers. Any individual worker is no more or less exposed simply because of their race/ethnicity (or age or gender). An AAPI truck driver, for example — one of the occupations least exposed to GenAI — has the exact same level of exposure to GenAI as a Black, white, or Hispanic driver.
The concentration of workers of a given race/ethnicity in certain sectors also speaks to another important finding. More than two-thirds (67%) of AAPI workers are concentrated in the 10 most common jobs for that racial group, the highest among all groups included in this analysis. In contrast, the 10 most common fields for Hispanic workers employ only slightly more than half (52%) of that population, the lowest among all groups analyzed. The greater variety of jobs in which Hispanic workers are employed may help lower their overall average exposure. Yes, many Hispanic workers are employed in some highly exposed sectors, but they also work in many less-exposed sectors, and the two seem to be in better balance than for other groups, leading to a lower exposure on net.
Conclusion
There are many complex economic and social reasons why certain demographic groups tend to fall into certain occupations more than others, and this research does not attempt to identify or analyze those reasons. But simply quantifying which groups are represented in which jobs, and knowing which of those jobs is more or less exposed to GenAI-driven change, is still incredibly valuable.
It is far too early to tell if a given job, or a given worker in that job, being impacted by GenAI is objectively “good” or “bad.” As artificial intelligence tools improve and more companies and workers learn to harness them, this current snapshot of which workers are sorted into those industries more or less prone to disruption will almost certainly change. New jobs and new ways of working will emerge, older jobs may change or fade in popularity and different groups of people are likely to find themselves employed in different roles as time goes on.
The rapid development of AI has opened many exciting new doors for job seekers and employers, and the technology may yet deliver incredible productivity and economic gains that are widespread and equitable. But embracing these developments responsibly will require care, consideration, and clear-eyed assessment. There are a lot of ways that biases can be built into an AI model or system, however unintentional, and it’s critical to ensure that existing inequities in the labor market are not perpetuated as AI evolves.
There is nothing that says policymakers, employers, and workers have to passively stand by as these evolutions take place. The AI future will ultimately be what we choose to make it, and we can make informed, affirmative choices designed to keep the workplace equitable and fair. To make those choices going forward, we must understand the current situation in the present.
Methodology
This research is based on Indeed Hiring Lab’s debut AI at Work report and the GenAI performance rating derived from that work. This analysis maps 2022 SOC codes from the Bureau of Labor Statistics to Indeed data (roughly 1% of employment could not be mapped to our Indeed classification of jobs). Some Indeed occupational groups used in the first analysis were aggregated into new groups as part of this process, so occupational groups used in this research differ slightly from those used in earlier analyses. After mapping Indeed data to SOC codes, these groupings of occupations were applied to all employed individuals (weighted by PERWT) in the 2021 Census Bureau’s American Community Survey. Individuals were then grouped by age, race, and gender, to calculate each group’s employment in each occupation-group.