Editor’s Note: Indeed’s AI at Work is a series of insightful research reports from Hiring Lab, Indeed’s economic research arm. This research is designed to provide data and new insights into the impact of AI on the labor market to help employers and job seekers better understand and prepare for the changing workforce. For an in-depth examination of the job skills most- and least-likely to be exposed to change from generative artificial intelligence, and why, please find our additional research here.
Key Points:
The emergence of generative artificial intelligence (GenAI) is rapidly reshaping the job market, with a surge in GenAI-related job postings starting in 2023. But a broader measure of AI job postings shows an easing over the past 18 months amid a wider tech slowdown.
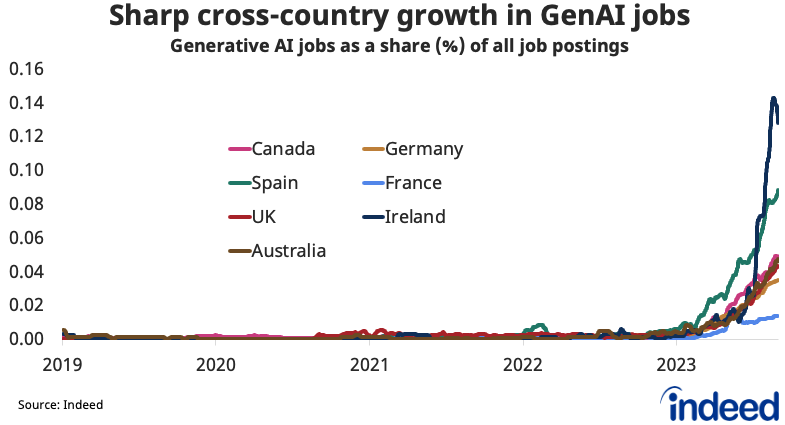
- Across all major countries analyzed, jobs related to generative AI have experienced significant growth since the start of 2023.
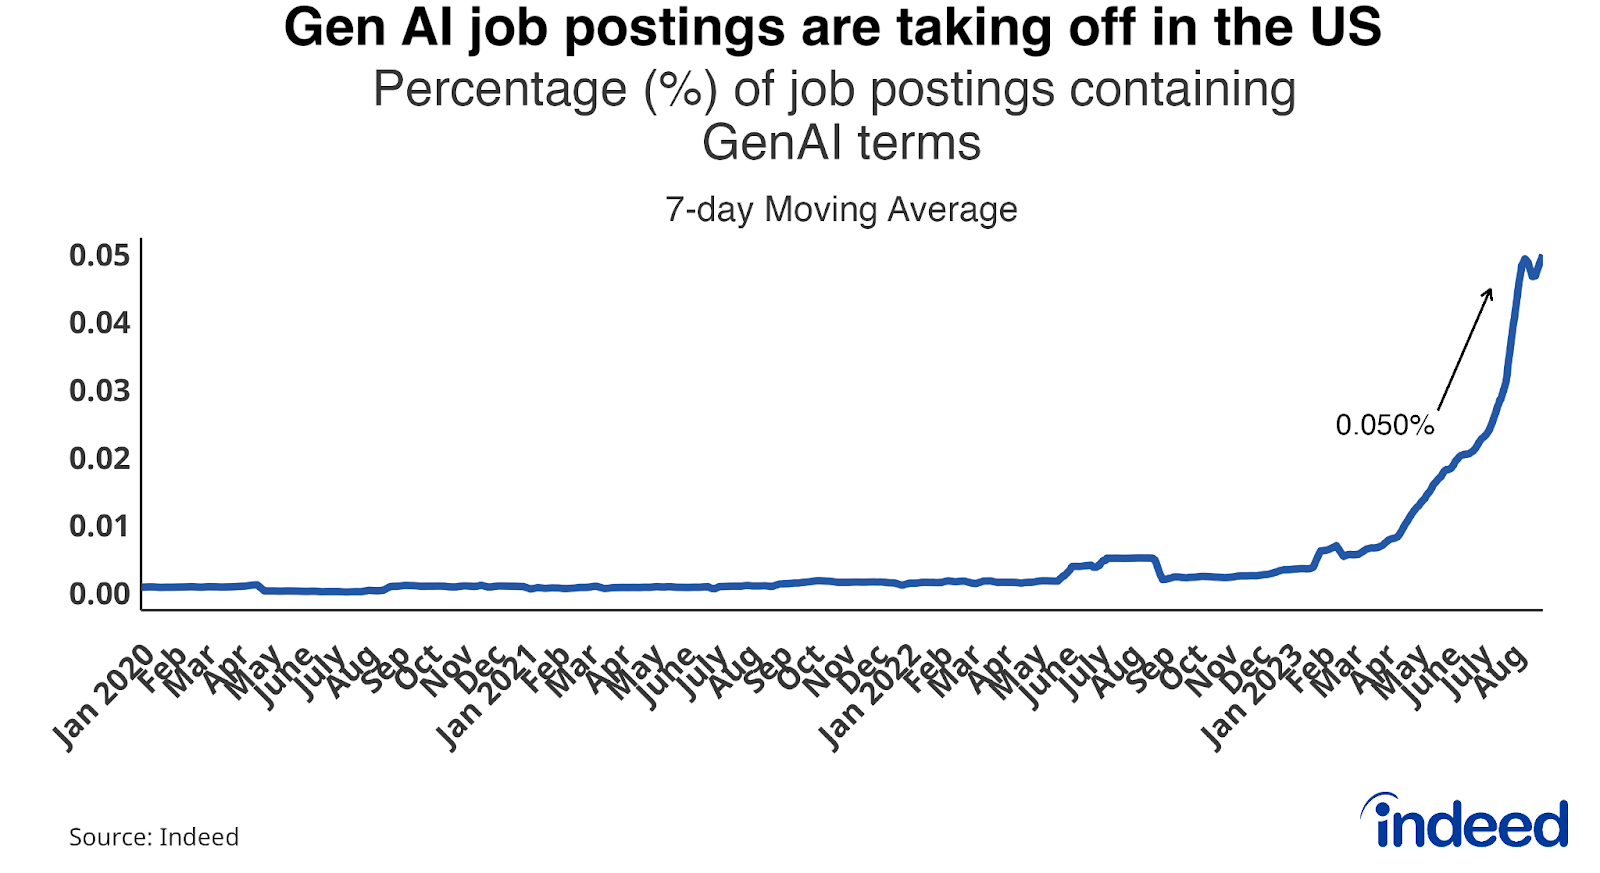
- In the few months after the public launch of ChatGPT and other GenAI tools, GenAI jobs rose from near zero to 0.05% of all US job postings on Indeed.
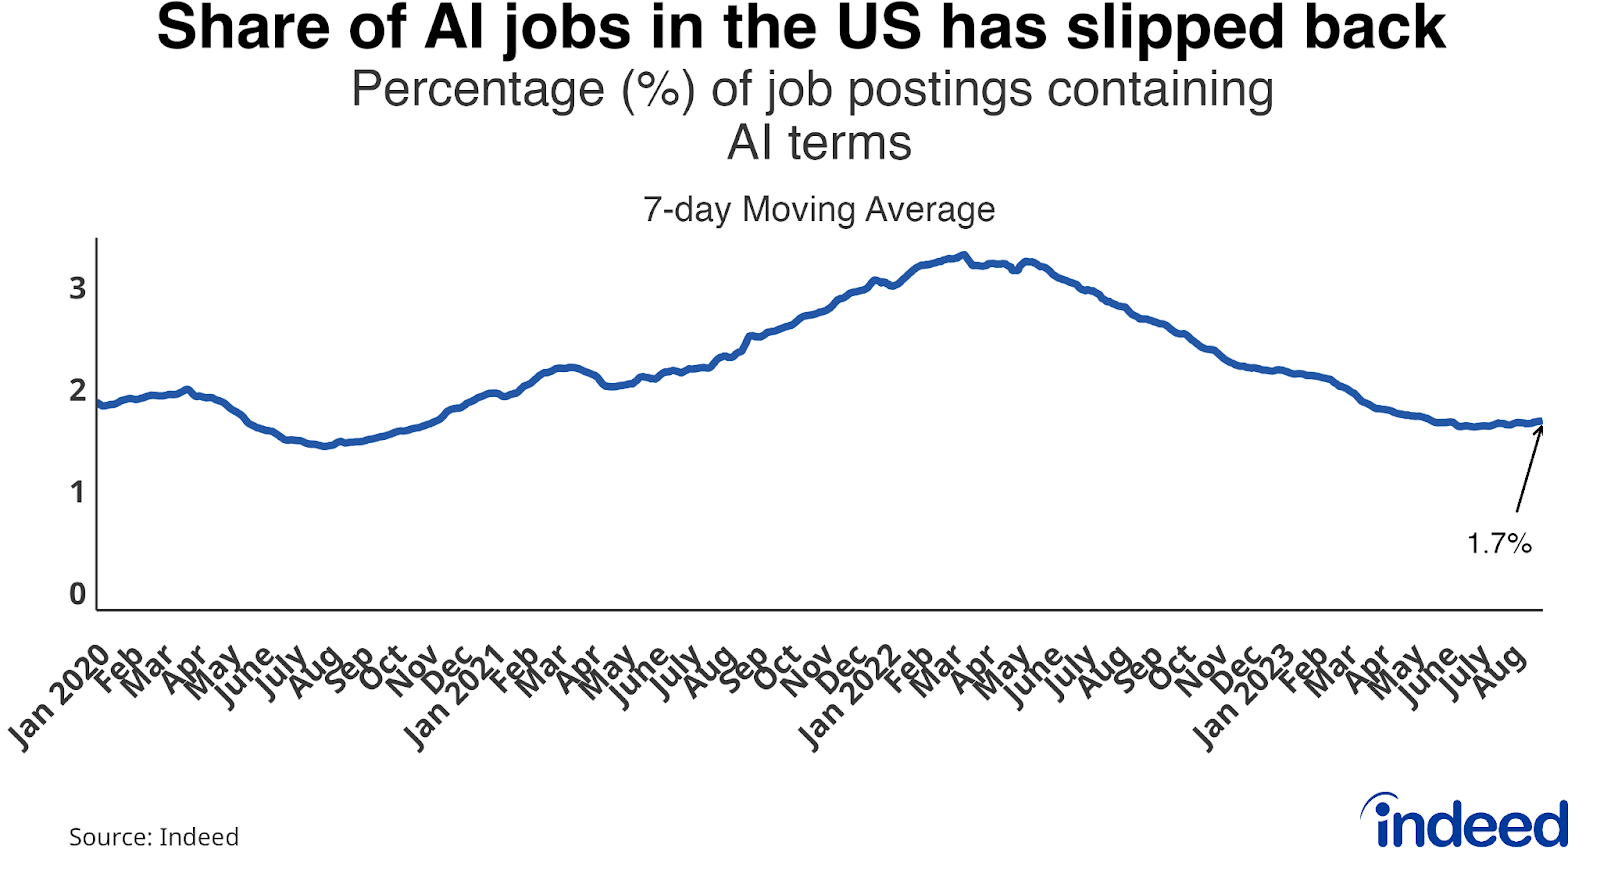
- A wider measure of AI jobs had been growing as a share of all jobs until early 2022. But that trend has since reversed amid a broader tech slowdown.
- In the US, the AI job postings share fell from 3.3% in March 2022 to 1.7%, as of August 2023.
The rise of broad artificial intelligence technologies over the past several years, and the rise of more specific generative artificial intelligence (GenAI) technology like ChatGPT over the past year, has ignited interest in the technologies’ vast potential to change the world of work. But while job postings for the former, broader sector have fallen lately (along with the larger tech sector), growth in the latter, more-specific GenAI category has skyrocketed—a clear sign of the technology’s potential to create new jobs, and not just change existing ones.
Jobs related to GenAI, which can produce various types of content—including text, imagery, audio, and synthetic data—have risen from virtually nothing to a still-small but quickly growing share of all jobs, as employers rush to hire workers who can harness the technology. The trend is not isolated, either—GenAI jobs are flourishing, albeit from a very low level, in virtually every large, developed economy analyzed.
GenAI goes global
Looking at job postings containing keywords specific to GenAI, we observe sharp growth beginning in early 2023. As of the end of August, 0.05% of all US job postings contained GenAI-specific terms, a five-fold rise in the past four months alone.
Similar trends are evident across other countries, with rapid growth from a near-zero base seen across the board. Ireland has a notably high share of GenAI jobs at 0.13%.
Wider AI job trends
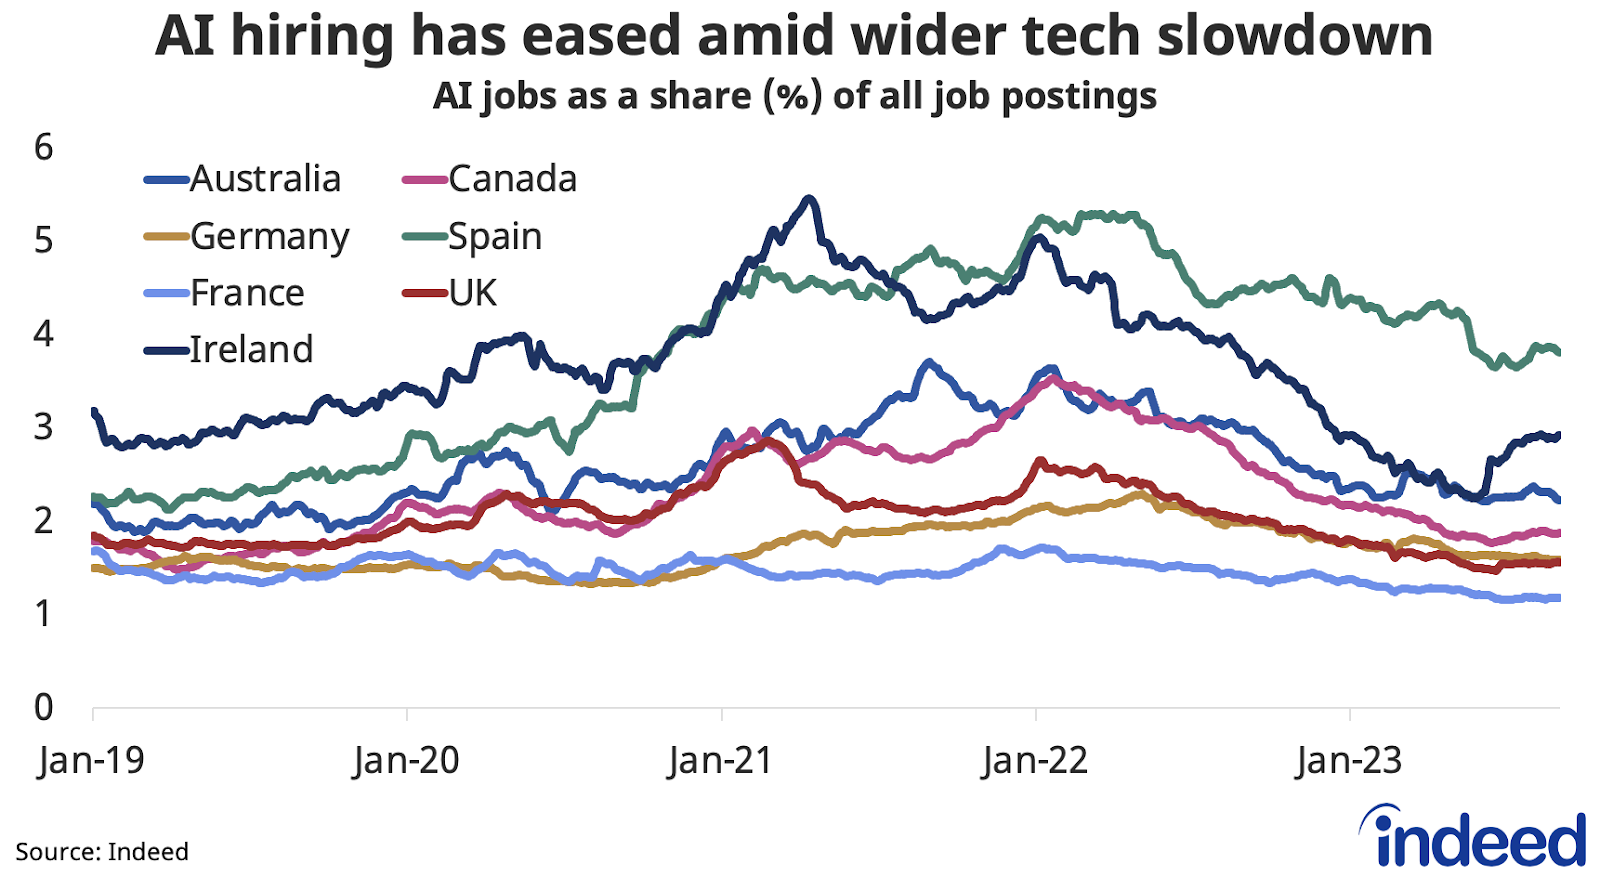
But when looking at trends in broader AI job postings—fields like machine learning, data science, and machine vision, that may not necessarily include work on or with dedicated GenAI tools—there has been a notable slowdown over the past 18 months. This has coincided with a broader slowdown across the tech sector and a generalized slowdown in tech hiring over the period, with job postings in categories such as software development having slowed sharply.
In the US, the share of all jobs that are broader “AI” jobs has fallen from 3.3% in March 2022 to 1.7%, as of August 2023. That said, there are signs of stabilization in the past three months.
Similar trends are apparent in other countries, with the share of AI job postings having fallen back over the past year. Looking at international comparisons, Spain leads on AI job postings share at 3.8%, followed by Ireland at 2.9% (having seen an uptick over the past three months). That’s followed by Australia (2.2%) and Canada (1.9%). Germany and the UK both sit at 1.6%, while France is at 1.2%.
Which occupational categories do AI jobs fall under?
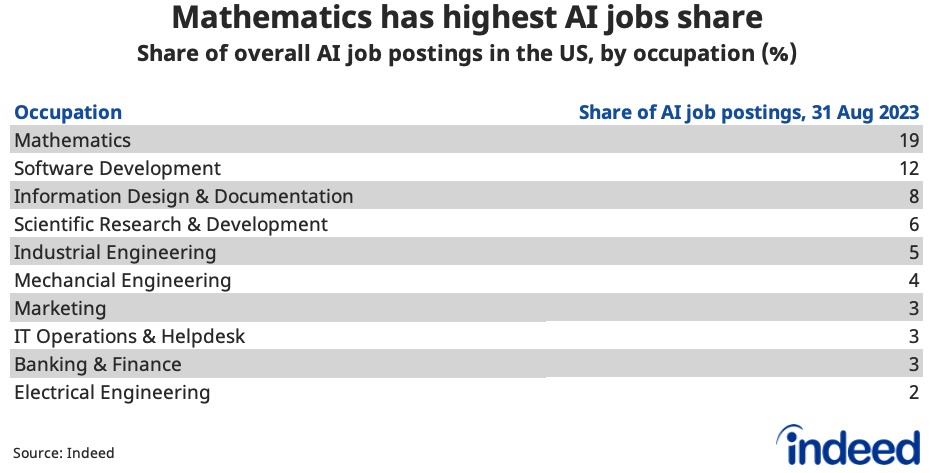
Across all countries, AI job postings are concentrated in mathematics (which includes data science jobs), tech, science, and engineering categories.
In the US, the mathematics category (which includes data science jobs) leads the way, with almost one in five AI job postings falling into that field. That’s followed by software development (12%), information design & documentation (8%), scientific research & development (6%), and industrial engineering (5%). Other occupations with noteworthy AI jobs shares include marketing and banking & finance.
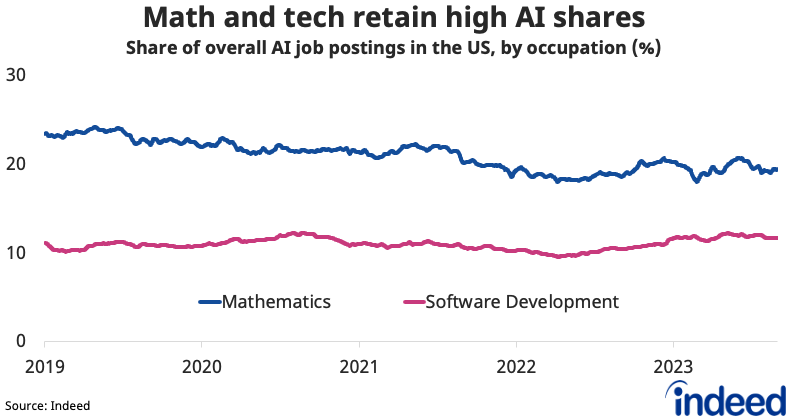
The share of AI jobs in the leading categories has remained fairly stable over time. Mathematics accounted for 21% of overall AI job postings in the US at the start of 2019 and is now at 19%, while software development saw its share rise slightly from 11% to 12%.
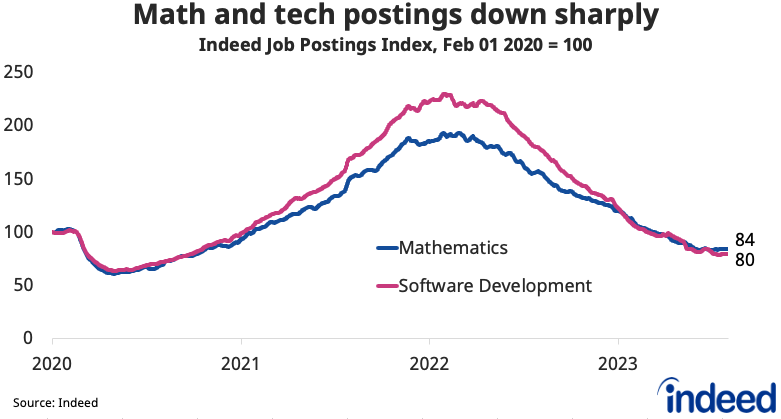
By contrast, total job postings (not just AI) in those categories have plunged over a similar period and sit below pre-pandemic levels. Mathematics postings are down 56% from their early-2022 peak, while software development postings are down 65%. While total job postings remain more than 25% higher than pre-pandemic levels, total postings for mathematics and software development are down 16% and 20%, respectively, over the same time. This lends weight to the notion that the slowdown in overall AI jobs likely owes more to the broader deceleration in the tech sector than any compositional shift in AI jobs away from tech categories.
Methodology
Generative AI
The analysis involved extracting job postings directly related to Generative AI, using specific keywords indicating its presence, such as “Generative AI,” “Large Language Models,” and “Chat GPT.”
AI
This analysis involved extracting job postings related to AI generally, using a broader list of keywords indicating skills associated with AI.