
Key points
- Relative to the rest of the country, job postings overall have declined faster in metros that have traditionally featured a high share of jobs that can be done remotely.
- Job postings have declined by almost half year-over-year in some of these metros, but the share of postings in remote-friendly sectors is down across cities.
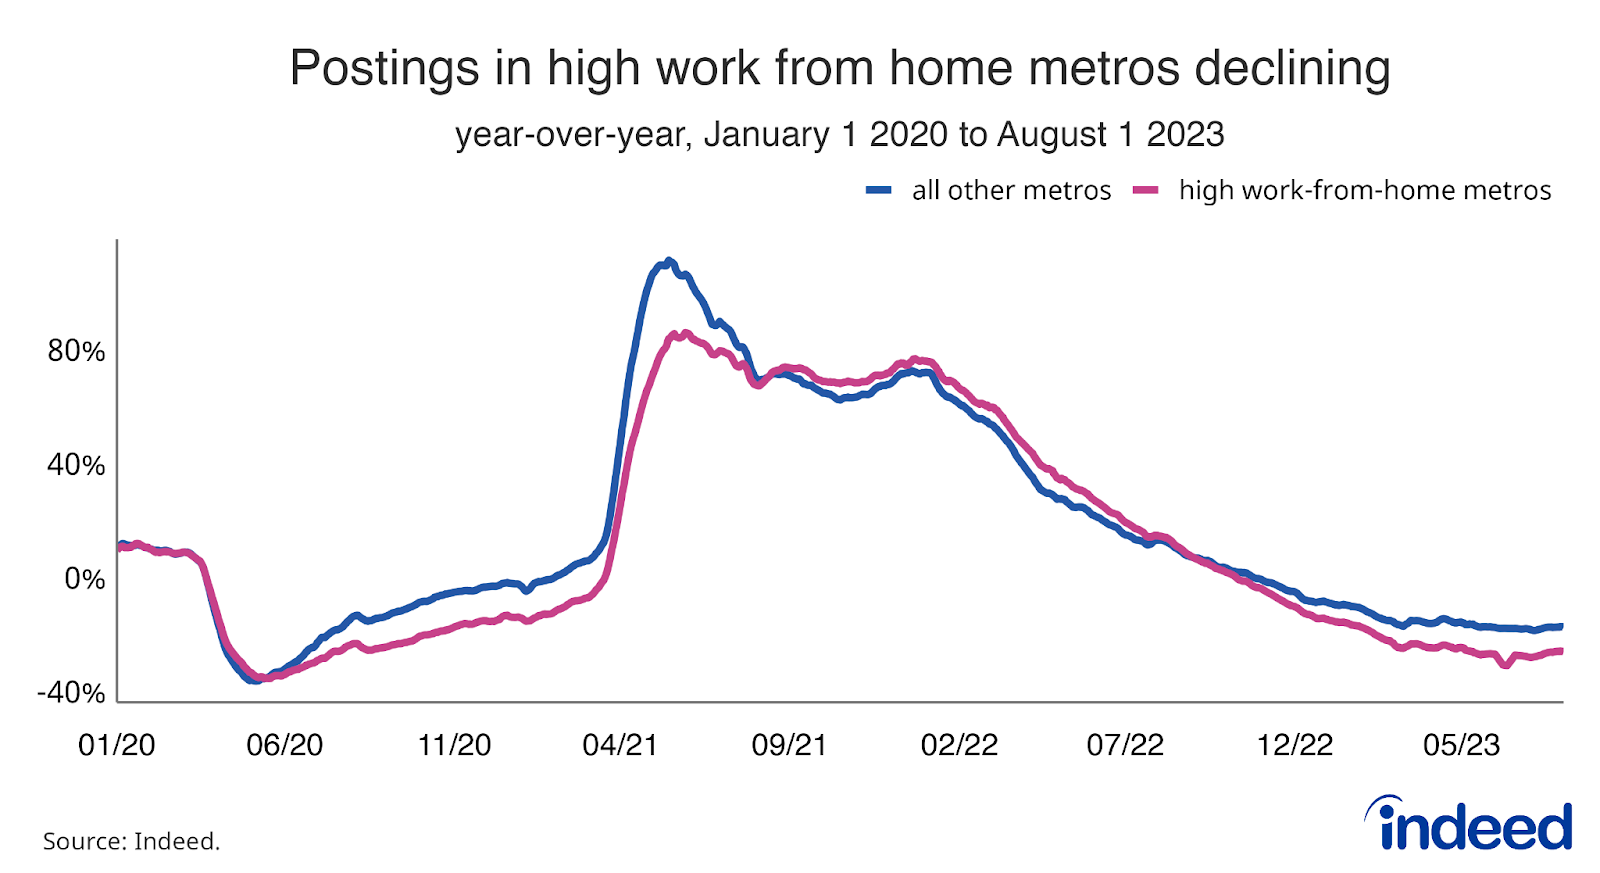
During the pandemic, postings for in-person service roles like restaurant and retail work—roles highly dependent on foot traffic from in-office workers—fell the most in many areas that have traditionally featured a high proportion of jobs that can be done remotely. Three years later, the tables have turned—in many of those same areas, postings for jobs that can potentially be done remotely are falling fast relative to national norms.
Nationwide, job postings were down 16% year-over-year in August. But job postings in many high-remote-eligible metros—metros in which a higher-than-average share of jobs can potentially be done remotely, but not necessarily where a high share of jobs are being done remotely—were down more than 40% over the same period. These metros represent double losers: Areas that shed many in-person service roles in the pandemic’s early years, and continue to shed remote-friendly jobs today as hiring pulls back in many traditionally remote-friendly sectors including tech and sales.
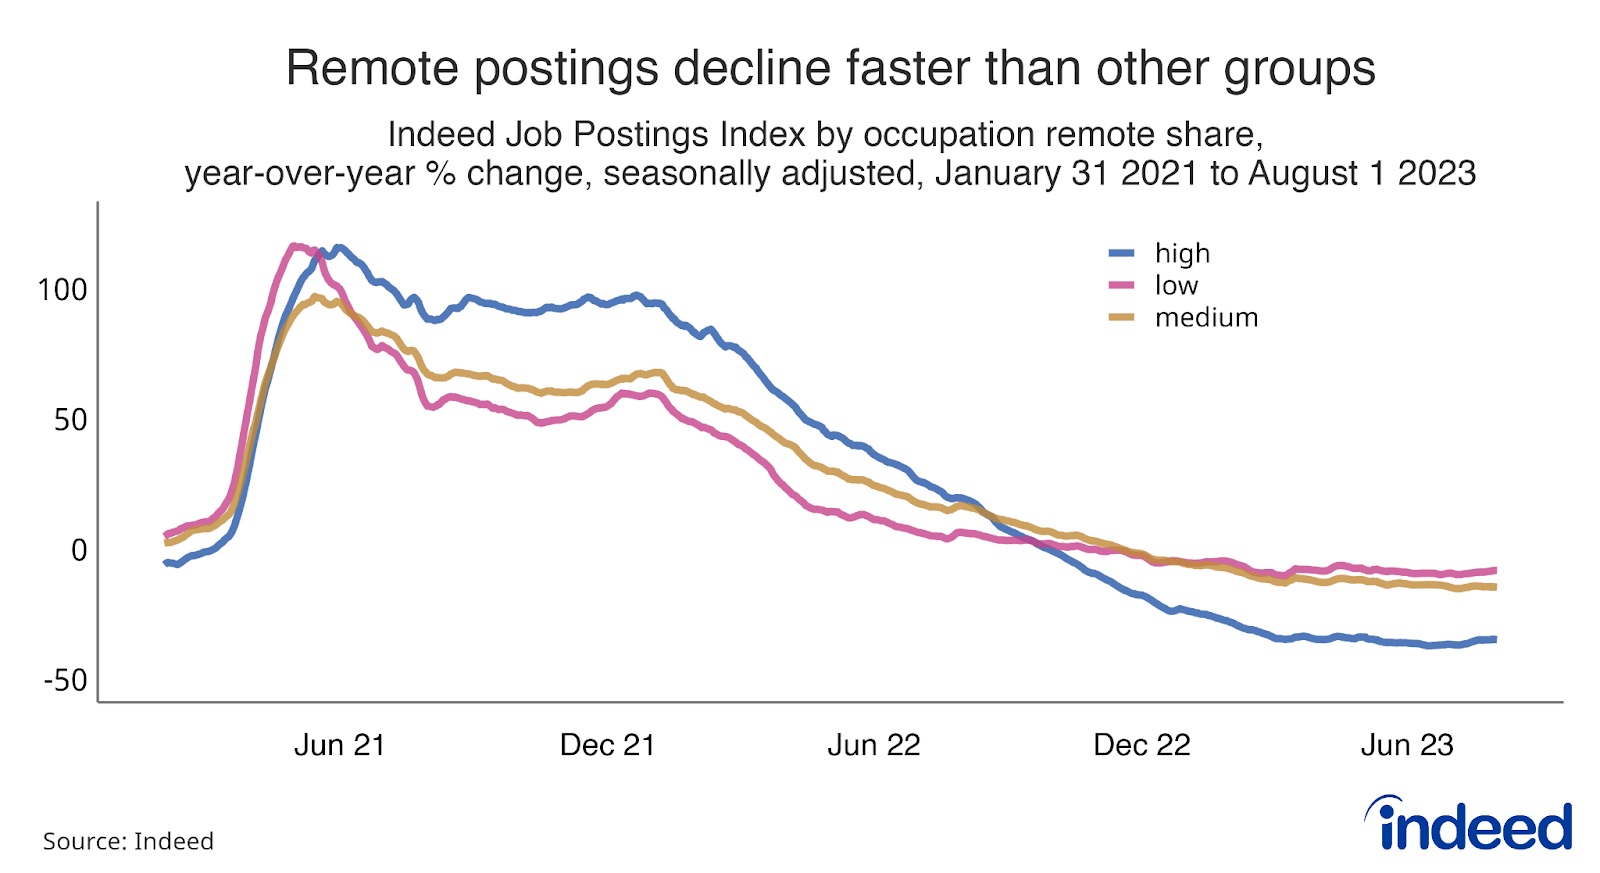
Across all metros analyzed (those with at least half a million residents), postings for software development jobs have fallen the most over the past year, down 58% from August 2022—a reversal from levels that reached 130% above pre-pandemic levels as recently as March 2022. Job postings for Information Design and Documentation roles followed closely behind, with a decline of 51% over the past year. With the exception of Banking and Finance, sectors with the highest year-over-year declines in total job postings are also those with a large share of jobs that can potentially be done remotely. And it is postings in these relatively more “remote-friendly” sectors that are falling fastest.
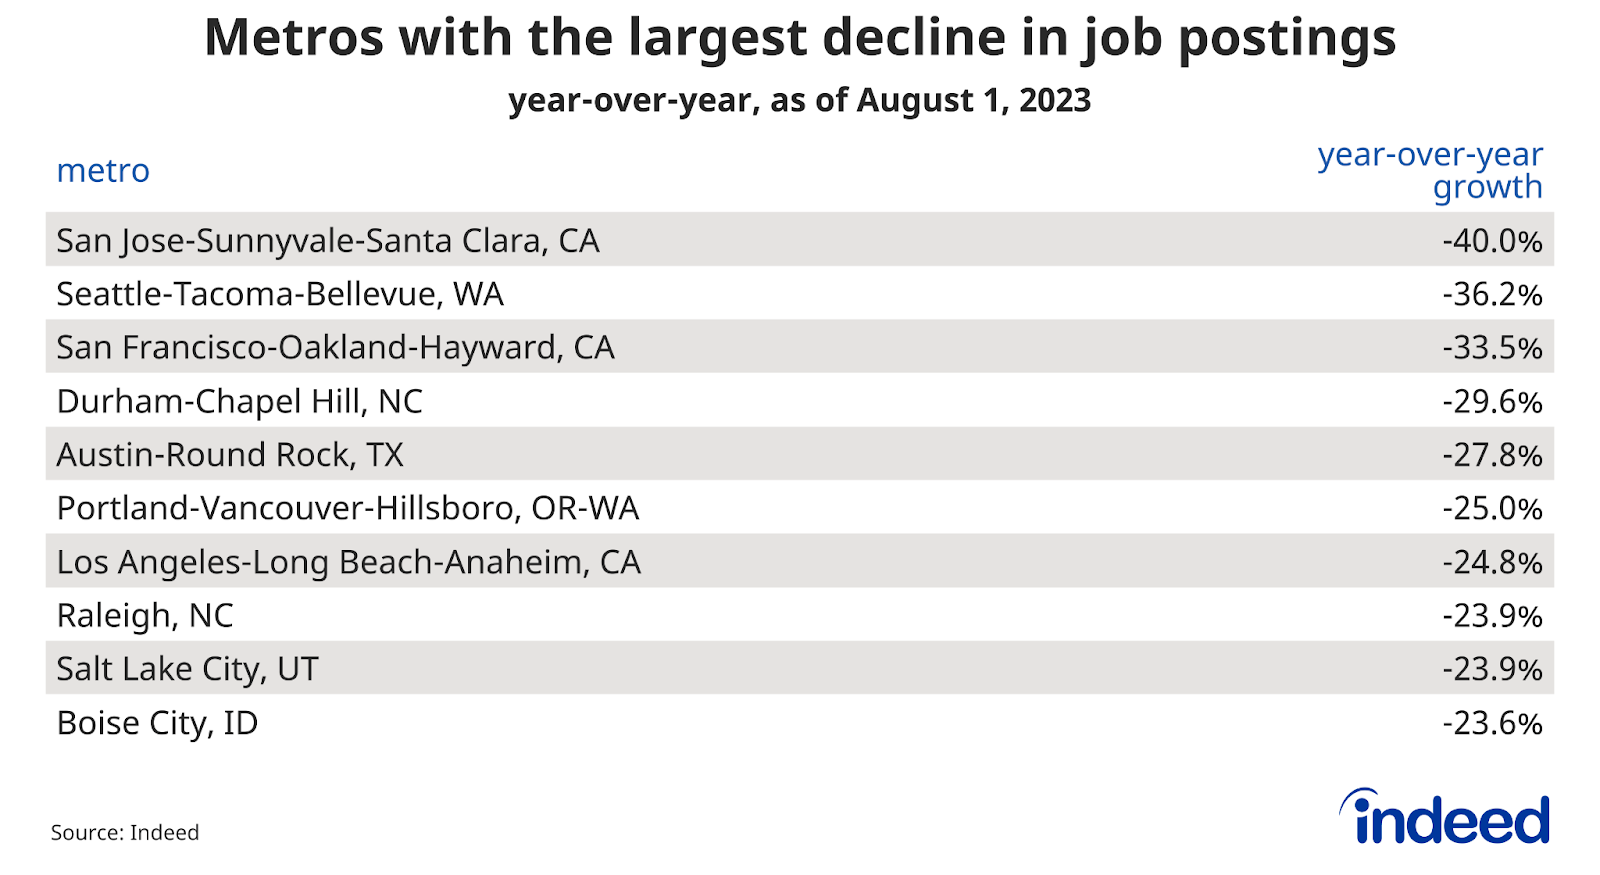
Metros with the largest drop in postings
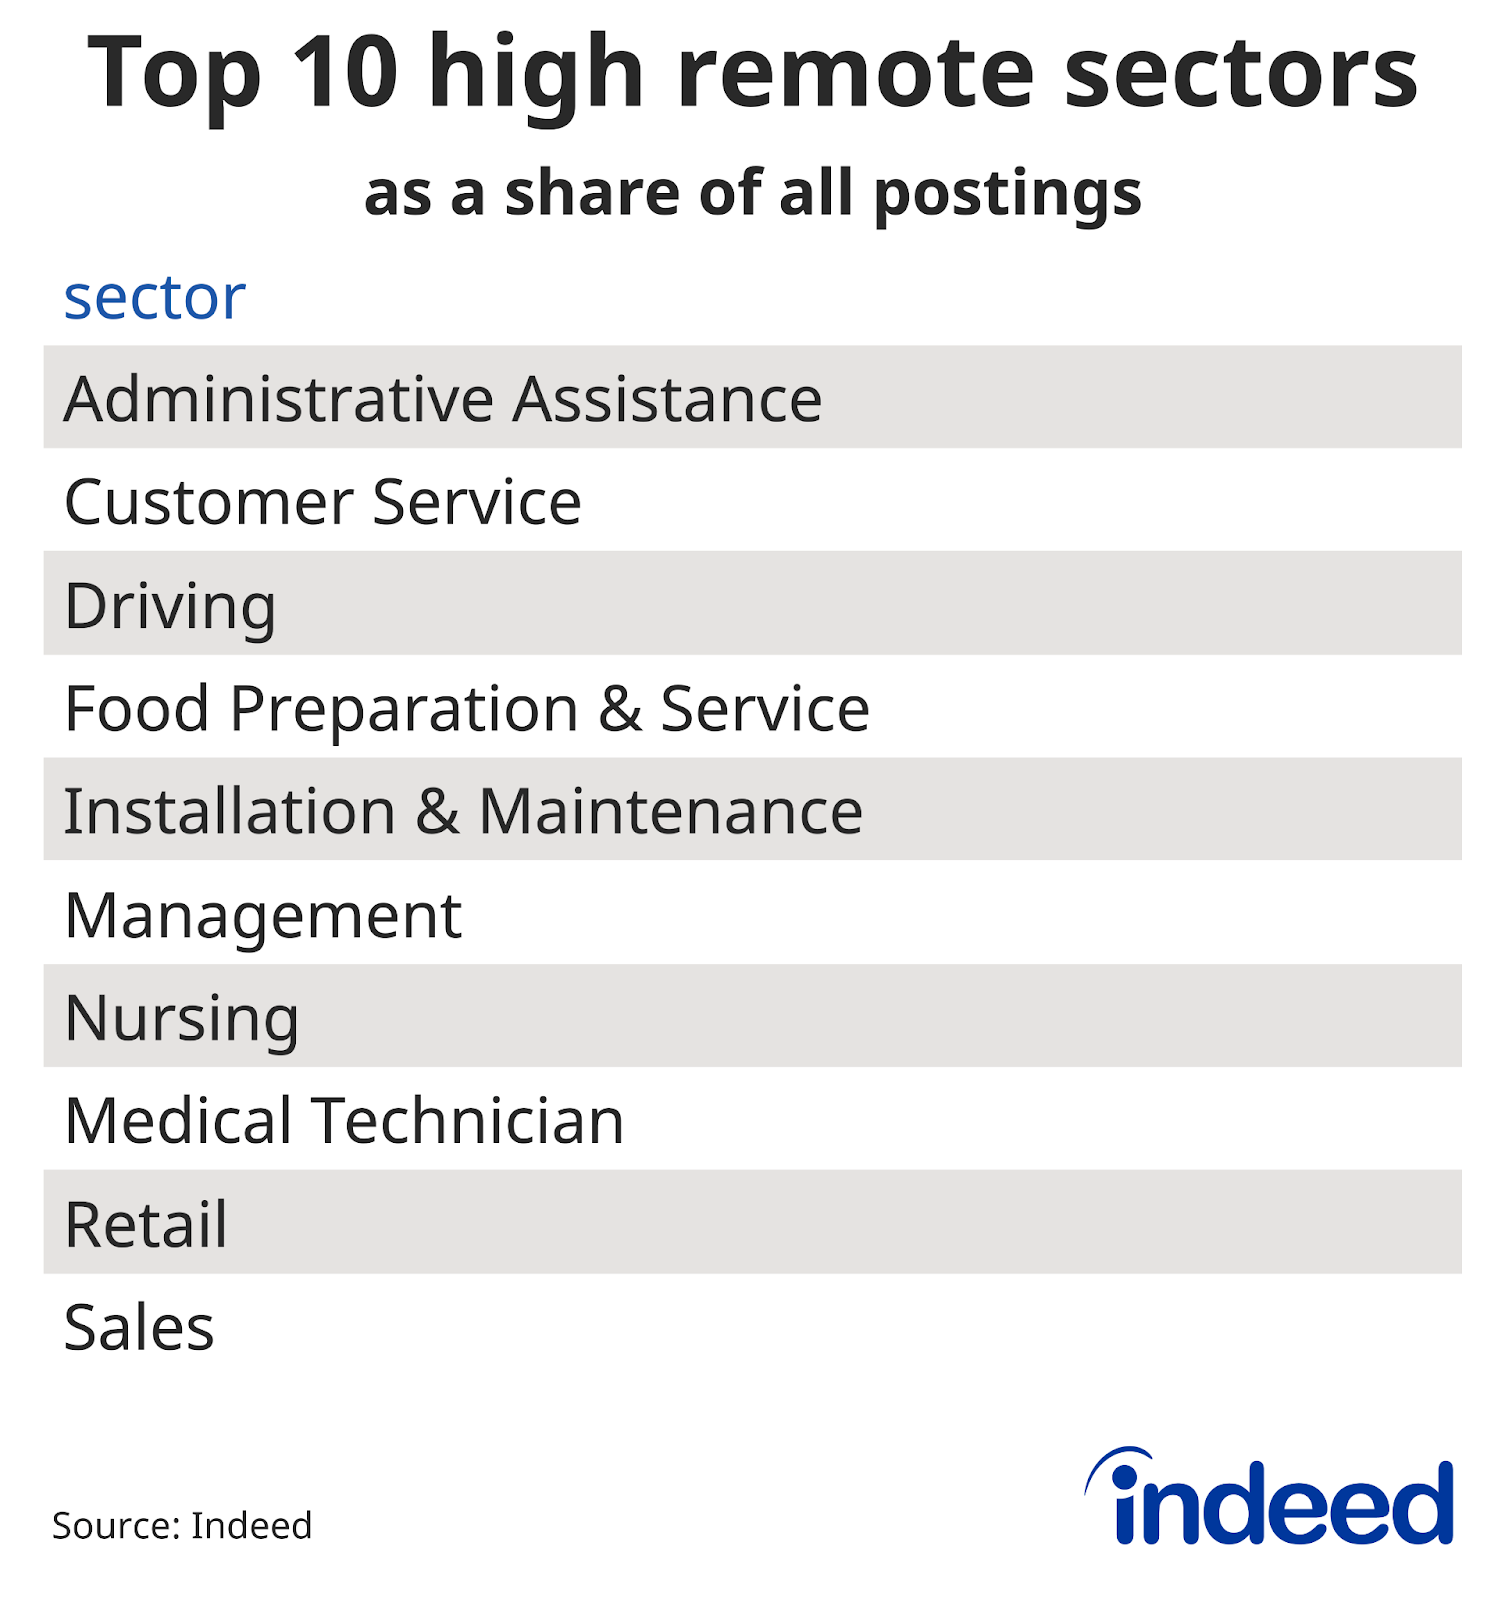
Remote-friendly professional sectors—sectors in which a large share of jobs can potentially be done remotely—include a number of tech roles (software development, information design, and IT operations/helpdesk) in addition to other roles such as human resources and marketing.
Many of the metros in which these roles are most concentrated—including tech-heavy San Francisco, Seattle, and Austin—were considered pre-pandemic “superstar cities” on the basis of their rapid growth and attractiveness to workers in highly paid sectors. The estimated share of occupations within these metros that can be done remotely is outlined in the table below.
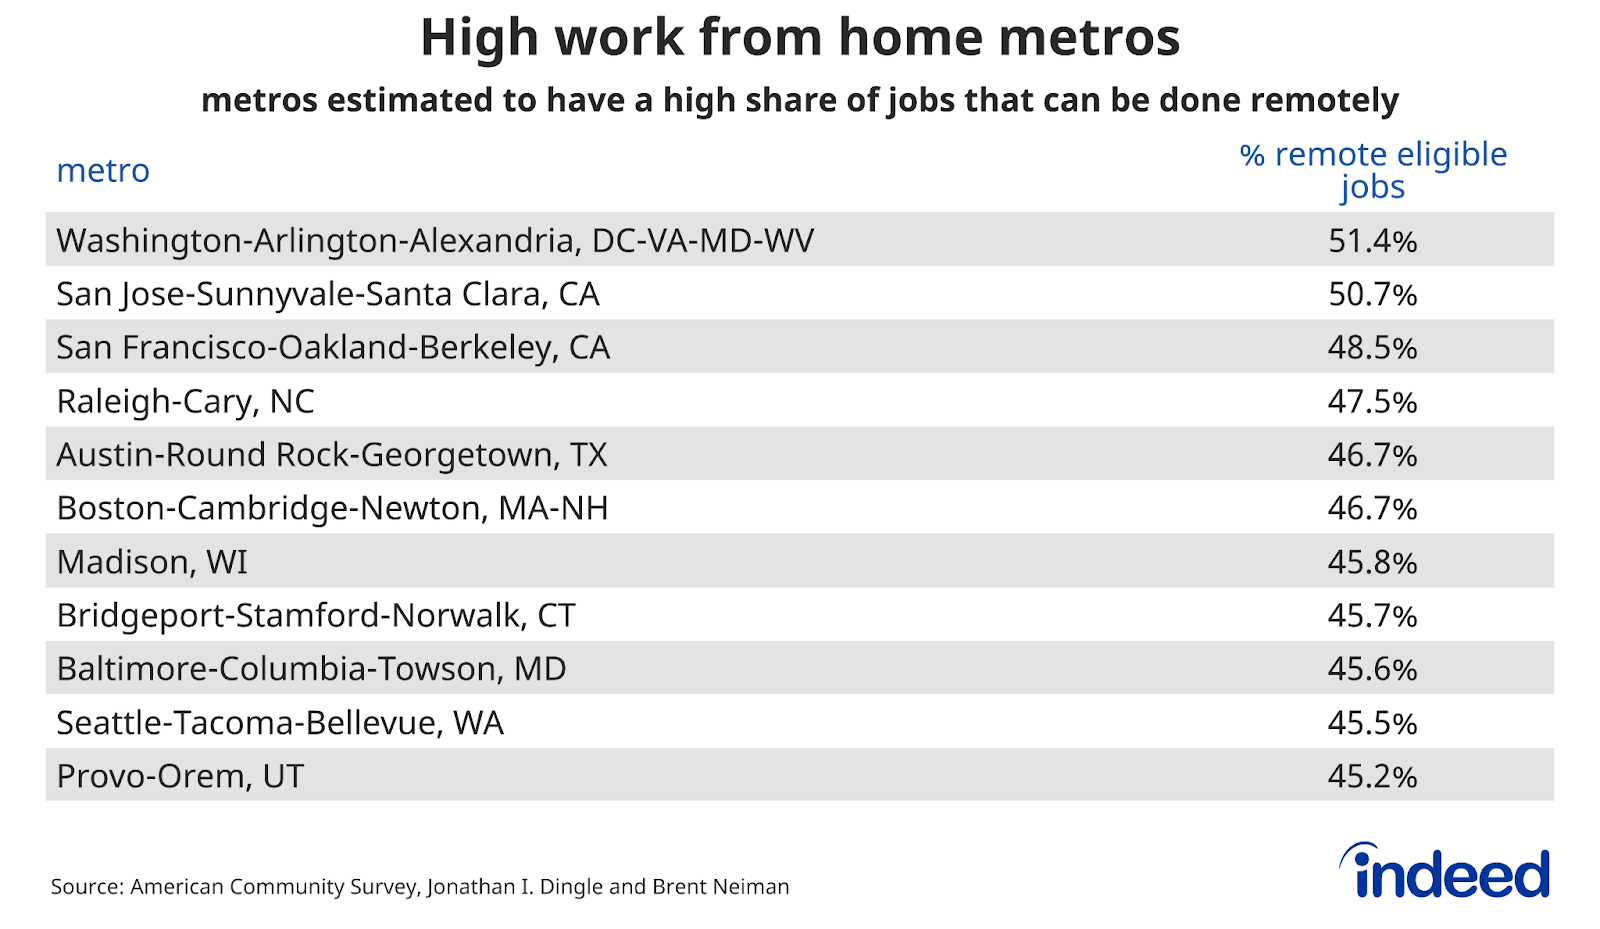
As of August, almost a third of job postings (32%) were in remote-friendly sectors in the San Jose metro—the heart of Silicon Valley and home to many of the exact kinds of tech jobs that have long been open to remote work. At the same time, overall job postings in the San Jose metro were down 40% year-over-year. Overall postings in the Seattle (down 36.2% year-over-year) and San Francisco metros (-33.5%)—two areas also famed for their deep tech roots—follow a similar trend. It is no coincidence that the list of metros with the highest share of potentially remote jobs, and the list of metros with the highest overall declines in job postings over the past year, look so similar.
However, the data suggest the decline in overall job postings in these areas is not necessarily attributable to a decreased interest in remote work and/or any observable rejection of back-to-office policies. Both job postings from employers that mention remote work, and searches from workers seeking remote/flexible opportunities, have stayed relatively stable over a period similar to that covered in this analysis. This tells us that the steeper-than-average decline in postings overall in these areas is attributable to a decline in jobs that are easier to do outside an office.
High work-from-home sectors declining across metros
The graph below illustrates the finding that metros with higher-than-normal shares of jobs that can be done remotely are currently being hit harder by the broad-based overall decline in job postings than in other areas. For example, less than 30% of all jobs in Bakersfield can potentially be done remotely, and job postings there have fallen by only about 5% year-over-year. But in the San Jose metro area, where a majority (50%) of local jobs can potentially be done remotely, job postings are down 40%.
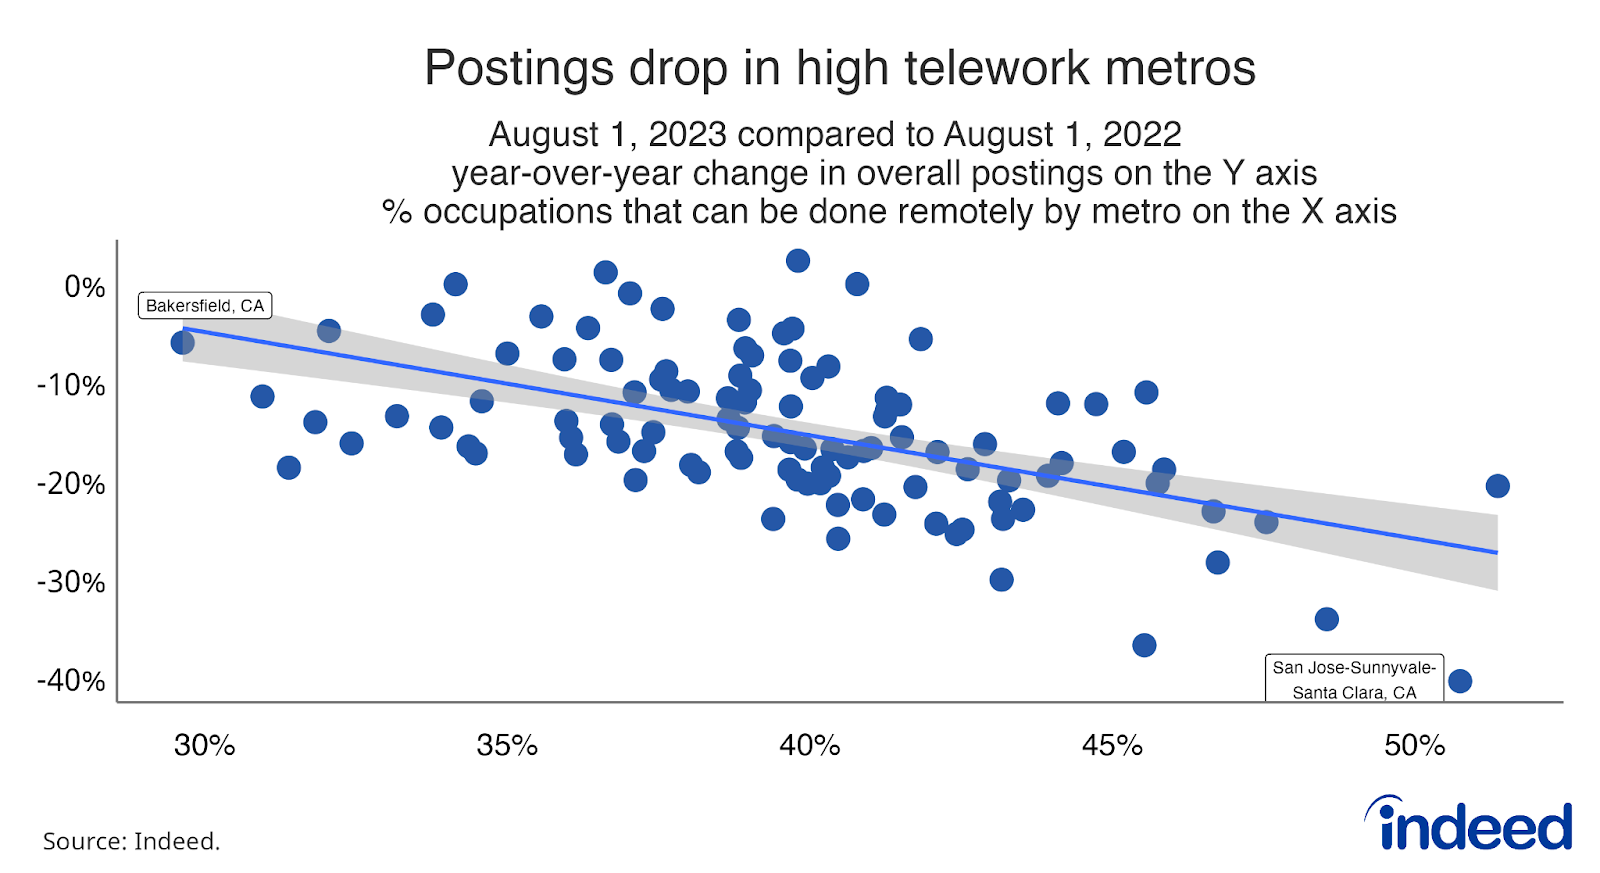
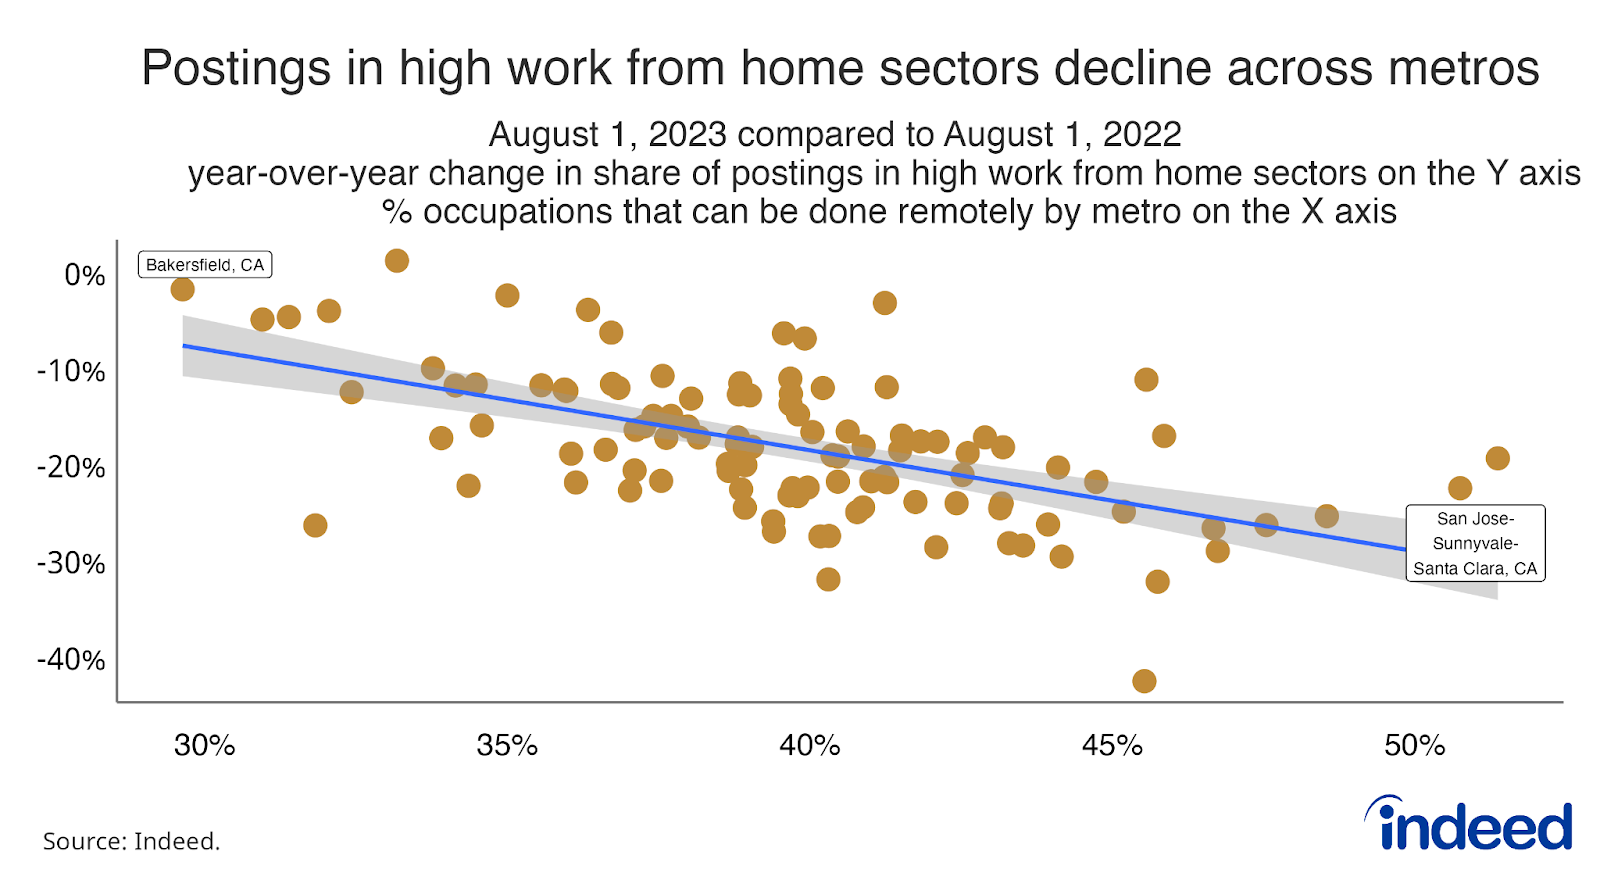
Focusing only on the year-by-year change in postings for jobs with a high potential to be done remotely, versus the change in job postings overall, reveals greater geographic variation in impacted areas. In Bakersfield CA, postings for jobs with high remote potential were down just 2% year-over-year in August, and just 14% of the area’s job postings are considered remote-friendly. On the other end, in the San Jose metro area, more than 30% of local job postings are considered remote-friendly, and postings for those specific kinds of highly remote jobs were down 22% year-over-year.
Conclusion
Job postings in metros where more jobs can potentially be done from home may be bearing the brunt of the broad-based decline in postings overall over the past year, but this isn’t unique to these metros themselves. Early in the pandemic, the ability of many jobs—mainly tech jobs—to be done remotely was a prime driver of the decline in in-person postings in these large, rich metros in the first place. Now, in-person service sectors are rebounding, and fading levels of remote-eligible jobs are dragging total postings down in metros with large shares of jobs that can be done remotely. Rather than being limited to so-called “superstar” cities along the coasts, the change in the shares of high remote postings is felt in cities across the country.
Methodology
Work-from-home metros are based on American Community Survey data on county employment by occupation, along with Jonathan Dingel and Brett Neiman’s analysis of whether occupations can be done from home. These were combined to estimate the share of a metropolitan area’s jobs that can be done from home. The national average is 37%. Among large metros, the work-from-home share ranges from 51% in Washington and San Jose to 30% in Bakersfield CA. In this post, “work-from-home metros” are those with a share of 45% or higher.
The remote/hybrid tiers of occupational sectors were determined by sorting each sector by their average remote/hybrid share of job postings in 2019. The sectors are then split into three tiers, each covering one-third of job postings in 2019.
Data on seasonally adjusted Indeed job postings are an index of the number of seasonally adjusted job postings on a given day, using a seven-day trailing average. February 1, 2020, is our pre-pandemic baseline, so the index is set to 100 on that day. We seasonally adjust each series based on historical patterns in 2017, 2018, and 2019. We adopted this methodology in January 2021. Data for several dates in 2021 and 2022 are missing and were interpolated. Non-seasonally adjusted data are calculated in a similar manner except that the data are not adjusted to historical patterns.
The number of job postings on Indeed.com, whether related to paid or unpaid job solicitations, is not indicative of potential revenue or earnings of Indeed, which comprises a significant percentage of the HR Technology segment of its parent company, Recruit Holdings Co., Ltd. Job posting numbers are provided for information purposes only and should not be viewed as an indicator of performance of Indeed or Recruit. Please refer to the Recruit Holdings investor relations website and regulatory filings in Japan for more detailed information on revenue generation by Recruit’s HR Technology segment.