
Key points:
- It’s a paradox: In places where more people can work from home, like tech hubs and finance centers, job postings have declined more than in such tourism destinations as Las Vegas and Orlando.
- Local retail and personal services sectors have suffered more in places where more of their local customers are able to work from home.
- Inequality in tech hubs, finance centers, and other work-from-home metros may worsen during this pandemic.
No place in the US has been untouched by the COVID19 economic crisis. In every large and mid-size labor market, job postings on Indeed fell at least 24% relative to last year’s trend. Nationally, job postings bottomed around May 1 and have improved a bit since then.
However, this crisis has hit different places unevenly. In some metros, job postings plummeted as much as 60%. Even seven weeks into a modest rebound, job postings in many large metros remain 40% below last year’s trend. Furthermore, while many of the markets initially hit hardest have recovered somewhat, others have fallen behind. Most surprisingly, metros like Seattle, San Francisco, and New York, where more people can do their jobs from home, have seen some of the biggest drops in job postings.
The metros with the biggest job-posting declines
Job postings have declined relative to last year’s trend in all large and mid-size markets. Among metros with populations greater than 500,000, Honolulu, Seattle, and San Francisco have experienced the largest drops. In smaller metros, job postings have fallen most in vacation and resort destinations like Maui, Napa, and Atlantic City, as well as college towns like Charlottesville VA and Ann Arbor MI.
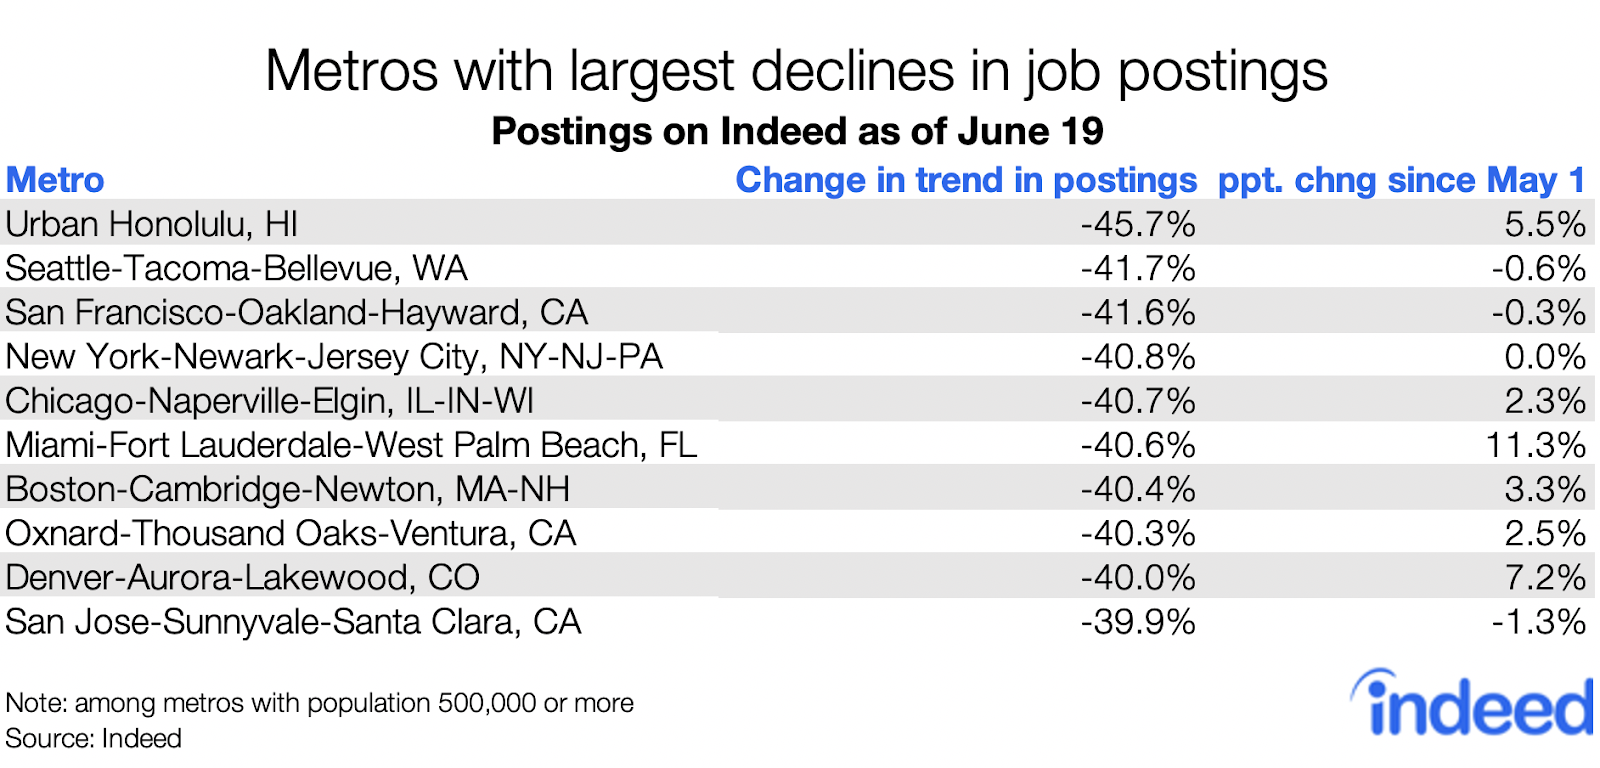
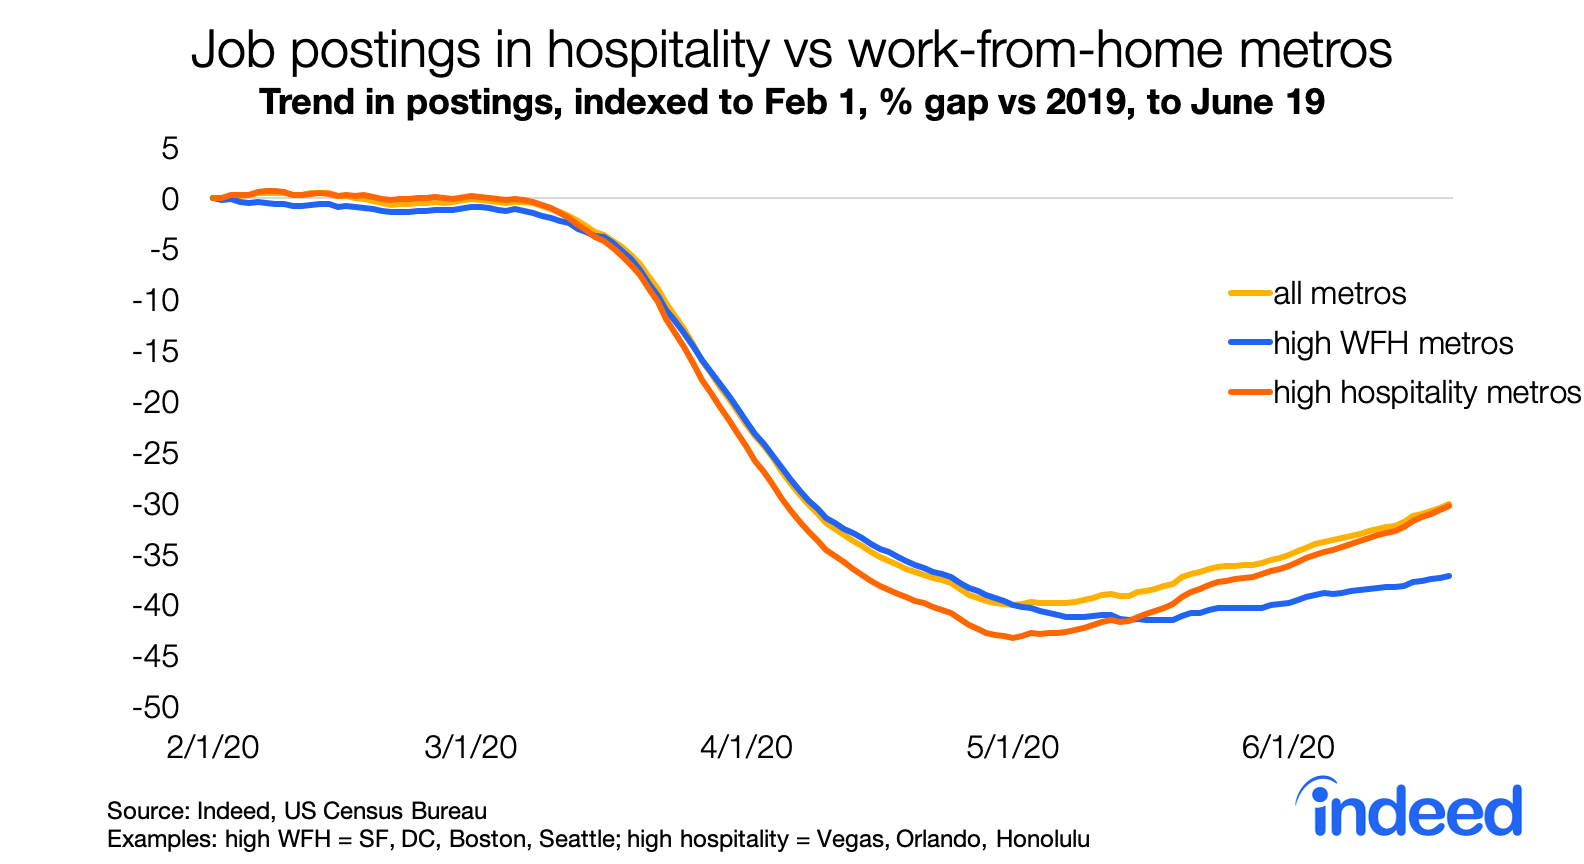
Nationally, job postings bottomed around May 1 when they reached a low of 39% below last year’s trend before recovering slightly to 29% below trend on June 19. But not all metros have followed the same path. Sunbelt destinations like Miami, Orlando, and Las Vegas experienced the largest declines in March and April when the leisure & hospitality sector effectively shut down. Since then, they have improved. In contrast, job postings in San Francisco, New York, Seattle, and San Jose fell less initially, but haven’t risen above their May 1 levels. Metros where more people work in occupations that can be performed from home, like tech and finance, have fallen behind.
The job mix affects postings more than local death rates or distancing do
The most important reason job postings are down more in some places than others is the local job mix. This economic crisis is most severe in the leisure & hospitality sector, which has registered the biggest drop in job postings on Indeed, as well as the largest percentage decline in payroll employment and largest increase in unemployment, according to the US Bureau of Labor Statistics. Personal services like dental and beauty & wellness also fell sharply, though they have started to rebound in recent weeks.
A metro’s job mix explains the depth of its jobs decline more than the local severity of the pandemic does. To be sure, the places with more severe COVID19 health crises also have had worse economic crises. Some especially unfortunate metros, including New York, Boston, and Philadelphia, have had both high death rates and big job slowdowns. Other places have suffered relatively smaller health or employment setbacks: Detroit has had high death rates but smaller job-posting declines, while San Francisco has faced steep job losses but lower death rates.
To put numbers on it, the correlation between death rates and metro job posting declines is 0.32, a modest relationship on a scale in which zero means no correlation and one a perfect correlation. But when you adjust for the job mix, the relationship disappears. The correlation between death rates and the job posting decline falls to 0.05 — not statistically significant.
The relationship between the job posting trend and one of the most widespread responses to the virus — physical distancing — is stronger. Anonymized mobile-device data examined by metro area show how much people are moving around during the pandemic relative to their pre-pandemic habits, providing a measure of physical distancing. We can assume that if people aren’t moving, they’re probably staying at home and interacting less with others. In the pandemic, mobility fell most relative to pre-pandemic patterns in metro San Jose, New York, and San Francisco, and least in mid-size and smaller metros in the South. Places where mobility fell more had larger declines in job postings, with a fairly strong 0.62 correlation.
But again, when you compare metros with the same mix of jobs, social distancing has only a weak relationship with the job posting decline. After adjustment,the correlation between distancing and the job posting dropoff falls to 0.11 — still statistically significant, but much smaller.
In short, it’s the job mix that drives local differences in this economic crisis. But there’s a twist.
The paradox of the work-from-home cities
The sectors with the biggest job posting drops are in shut-down sectors like hospitality & tourism and the arts. But the metros with the largest posting declines are those with higher shares of jobs that can be done from home, like tech and finance. The share of workers in occupations that can be done from home is highest in Washington, San Jose, and San Francisco, and smaller metros like Los Alamos NM, Boulder CO, and Ithaca NY.
As shown above, work-from-home metros like San Francisco and Boston have had bigger job posting declines than travel destinations like Las Vegas and Orlando. But if the local job mix explains why some places are doing better than others, why aren’t job postings down more in tourist-dependent Orlando and Las Vegas than in Boston and San Francisco?
Here’s where it gets really interesting. In sectors that serve local customers in person, job postings have fallen more in metros where people are more likely to have jobs that can be done from home, allowing them to practice more physically distancing. Job postings in these in-person service sectors — retail, food preparation, sales, and beauty & wellness — have fallen more in metros where people are more likely to work from home, like San Francisco, Washington, Boston, and Seattle.
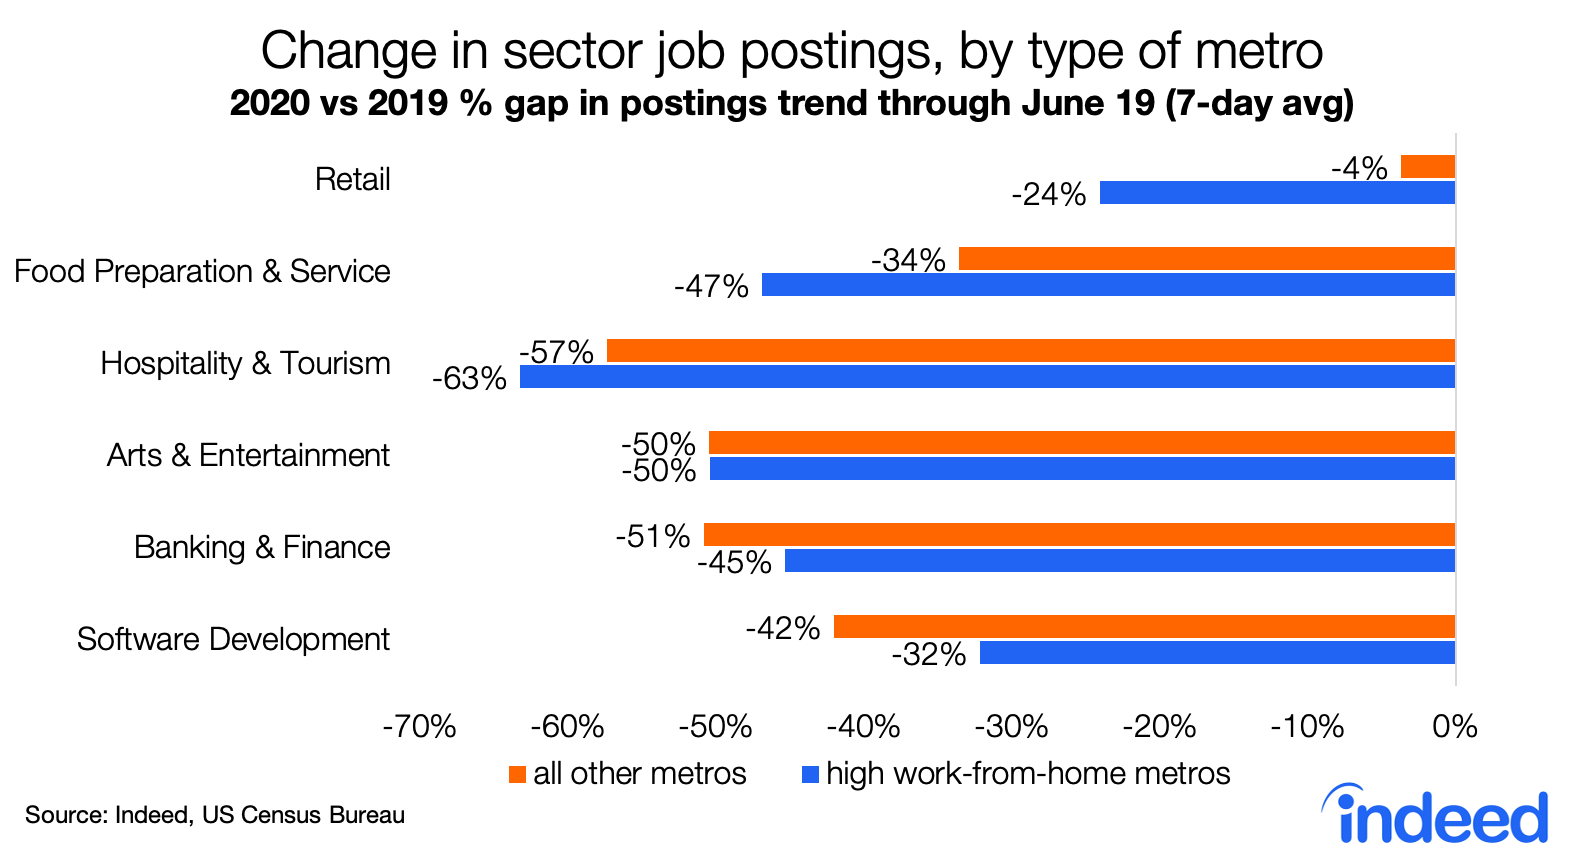
In contrast, sectors that serve national or global customers, like the arts and hospitality, have had similarly large declines both in metros where lots of people or fewer people can work from home. Demand in these sectors doesn’t depend on local customers and is therefore less affected by whether their neighbors stay close to home. And in sectors where people can more easily work from home, like tech and finance, the job posting decline was smaller in the higher work-from-home metros.
The retail sector shows that the drag on local demand in work-from-home metros came mostly from a slower rebound, not a faster decline. Through the end of April, retail job postings fell in both high work-from-home and other metros. The decline was steeper in work-from-home metros, but the gap was only five percentage points on April 28. Then, retail job postings in most metros started climbing substantially. But retail job postings continued falling for another ten days in the high work-from-home metros before starting a slower recovery. On June 19, retail job postings in high work-from-home metros were 24% below last year’s trend, versus just 4% below trend in all other metros — a stunning 20-point gap.

Conclusion: Two lessons about the labor market
These patterns offer two lessons about the labor market during the pandemic.
First, even though many sectors are national or global, local economic connections matter. Retail and personal-services sectors have suffered more in places where a larger share of local customers have been able to work from home. This is consistent with recent evidence that richer people’s spending has dropped more, hurting businesses more in richer neighborhoods than in poorer neighborhoods.
Second, inequality in tech hubs, finance centers, and other work-from-home metros — which was already high to begin with — may be worsening during this pandemic. In high work-from-home metros, job postings in well-paying sectors like finance and tech have fallen less than the national average, while job postings in worse-paying retail and service sectors have fallen more than the national average. That means that, in these metros, opportunities may be drying up more for people who were already struggling.
Methodology
To measure job posting trends, we calculated the seven-day moving average of the number of US job postings on Indeed. We index each day’s seven-day moving average to the start of the year (Feb 1, 2020 = 100 for 2020 data, and so on), or another date if specified . The “change in trend in postings” represents the percent change in job growth rate from February 1 compared with the same date the year before. Military job postings are excluded. Job posting data are based on publicly available information on the Indeed US website, limited to the United States, are not a projection of future events, and include both paid and unpaid job solicitations.
Death rates are from daily counts of COVID19 cases and deaths compiled and reported by the New York Times based on reports from state and local health agencies. The mobility / physical distancing measure comes from Descartes Labs.
Work-from-home metros are based on American Community Survey data on county employment by occupation, along with Jonathan Dingel and Brett Neiman’s analysis of whether occupations can be done from home. These were combined to estimate the share of a metropolitan area’s jobs that can be done from home. The national average is 37%. Among large metros, the work-from-home share ranges from 51% in Washington and San Jose to 30% in Bakersfield CA. In this post, “work from home metros” are those with a share of 45% or higher.
This post uses all 933 Core Based Statistical Areas (metropolitan and micropolitan), as defined in 2017. Correlations and regressions are weighted by population.