Key Points:
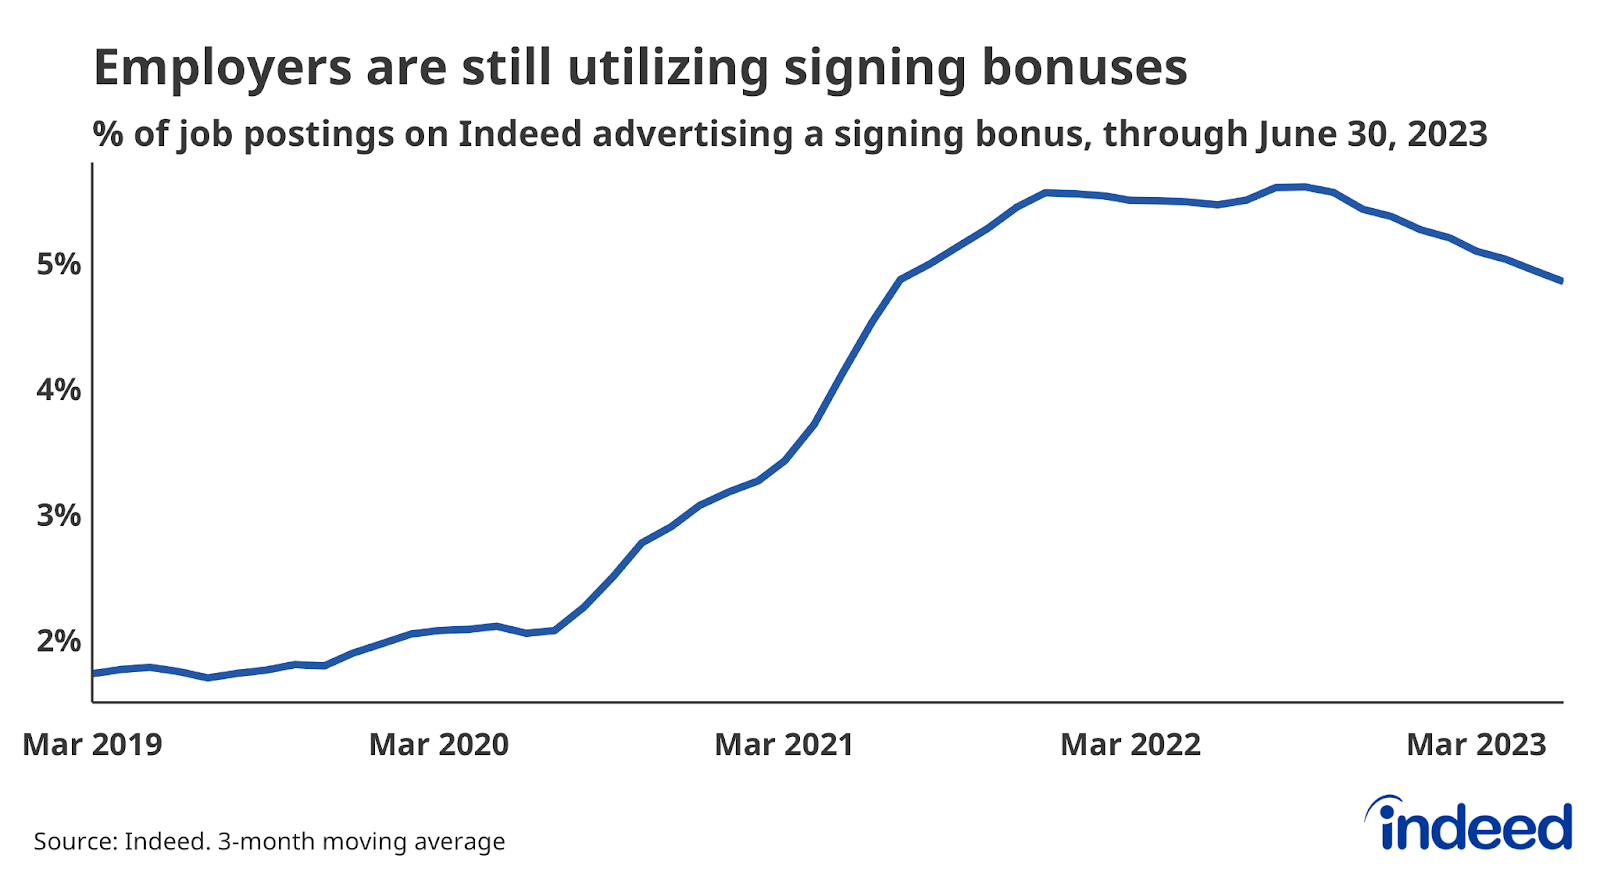
- Almost 5% of US job postings mentioned signing bonuses in June, down from recent highs but still well above pre-pandemic levels.
- The level of job postings is falling but still elevated, with postings down 16% year-over-year, but still 29% above their pre-pandemic level as of July 21, 2023.
- Nominal wage growth remains strong but is cooling gradually as the labor market continues to find a more sustainable balance between supply and demand.
- Layoffs remain low by historical standards, despite painful cuts in some sectors including tech and media, and the overall labor market remains robust as elevated demand for workers keeps joblessness low and employment growing.
Despite cooling wage growth and a gradual decline in the number of US job postings, demand for workers in the US remains strong by virtually any measure. Recruiters continue to make strong efforts to attract candidates, particularly through the use of signing bonuses, which have nearly tripled between early 2020 and today. While the share of postings mentioning signing bonuses has fallen somewhat lately from recent highs, it remains elevated and is an important signal of the true price employers are willing to pay to attract workers, even as wage growth overall shifts into a lower gear.
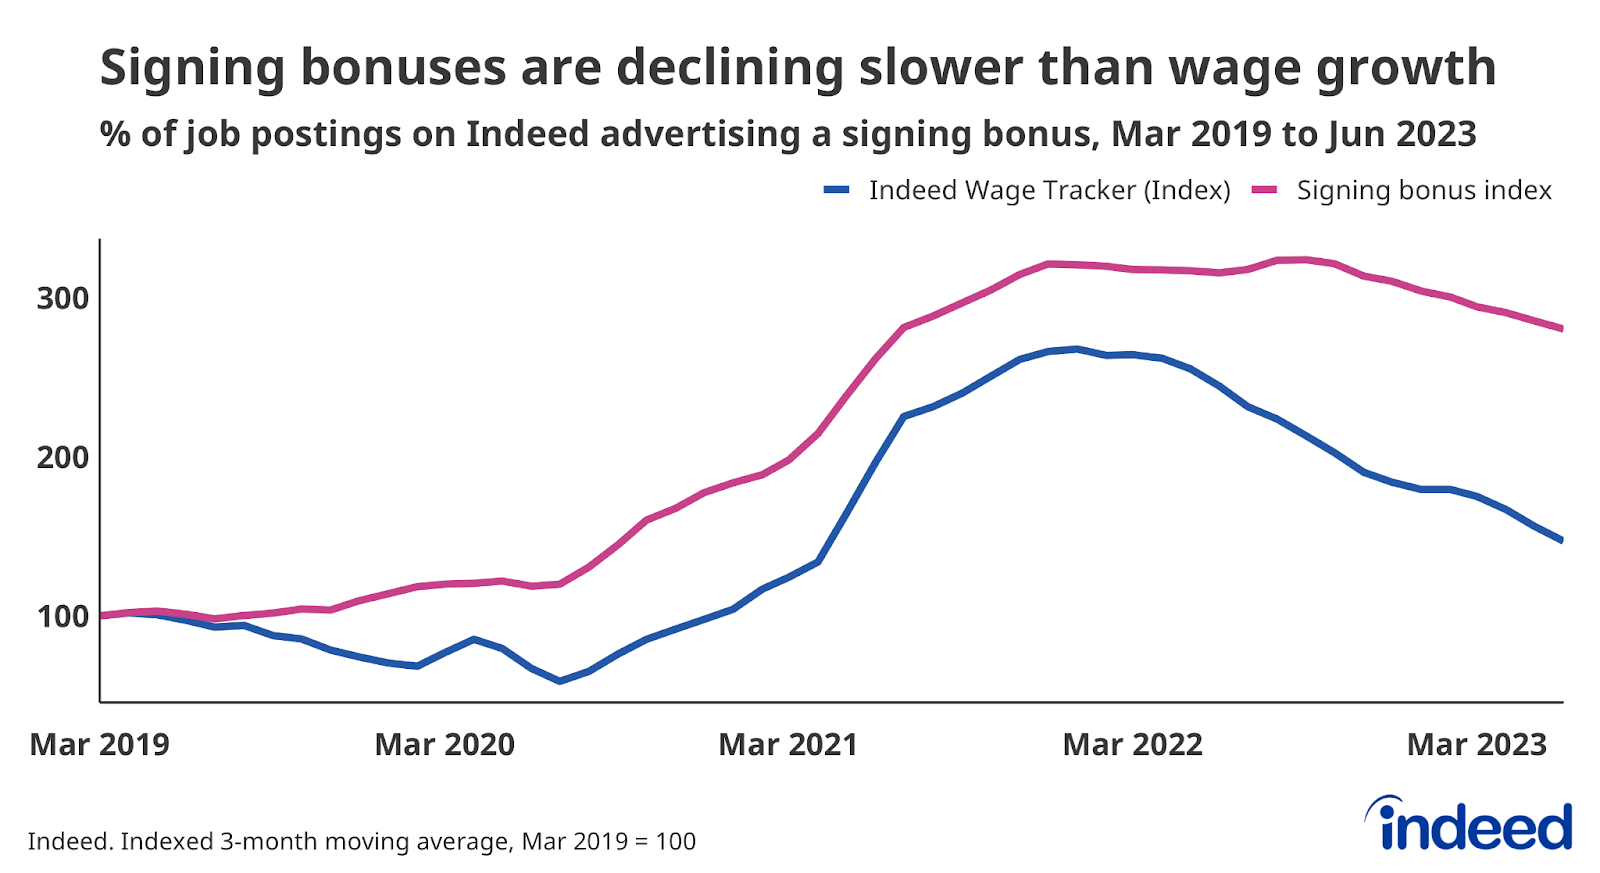
Spotlight: Signing bonus offerings are declining, but not as fast as wage growth
Approximately 4.9% of all US job postings mentioned a signing bonus in June, down from recent highs of 5.6% set in September 2022, but well above the pre-pandemic average of 1.8%. The recent decline suggests that while recruiting intensity may not be quite as high as it was at the peak of the market last year, it is still higher than might otherwise be expected given the overall cooling in the market.
Signing bonus advertisements on Indeed began rising in the second half of 2020 and accelerated further in mid-2021 — a different pattern from overall wage growth, as measured by the Indeed Wage Tracker, which fell in 2020 before beginning to rise the following year. This suggests that employers may prefer the one-time cost of a signing bonus, which typically doesn’t require difficult-to-reverse actions like increasing wages or other benefits. And while the labor market has loosened a bit in the last year, it seems like employers are still finding it useful to offer pay upon hire, with bonus mentions abating far more slowly than wage growth over the last year.
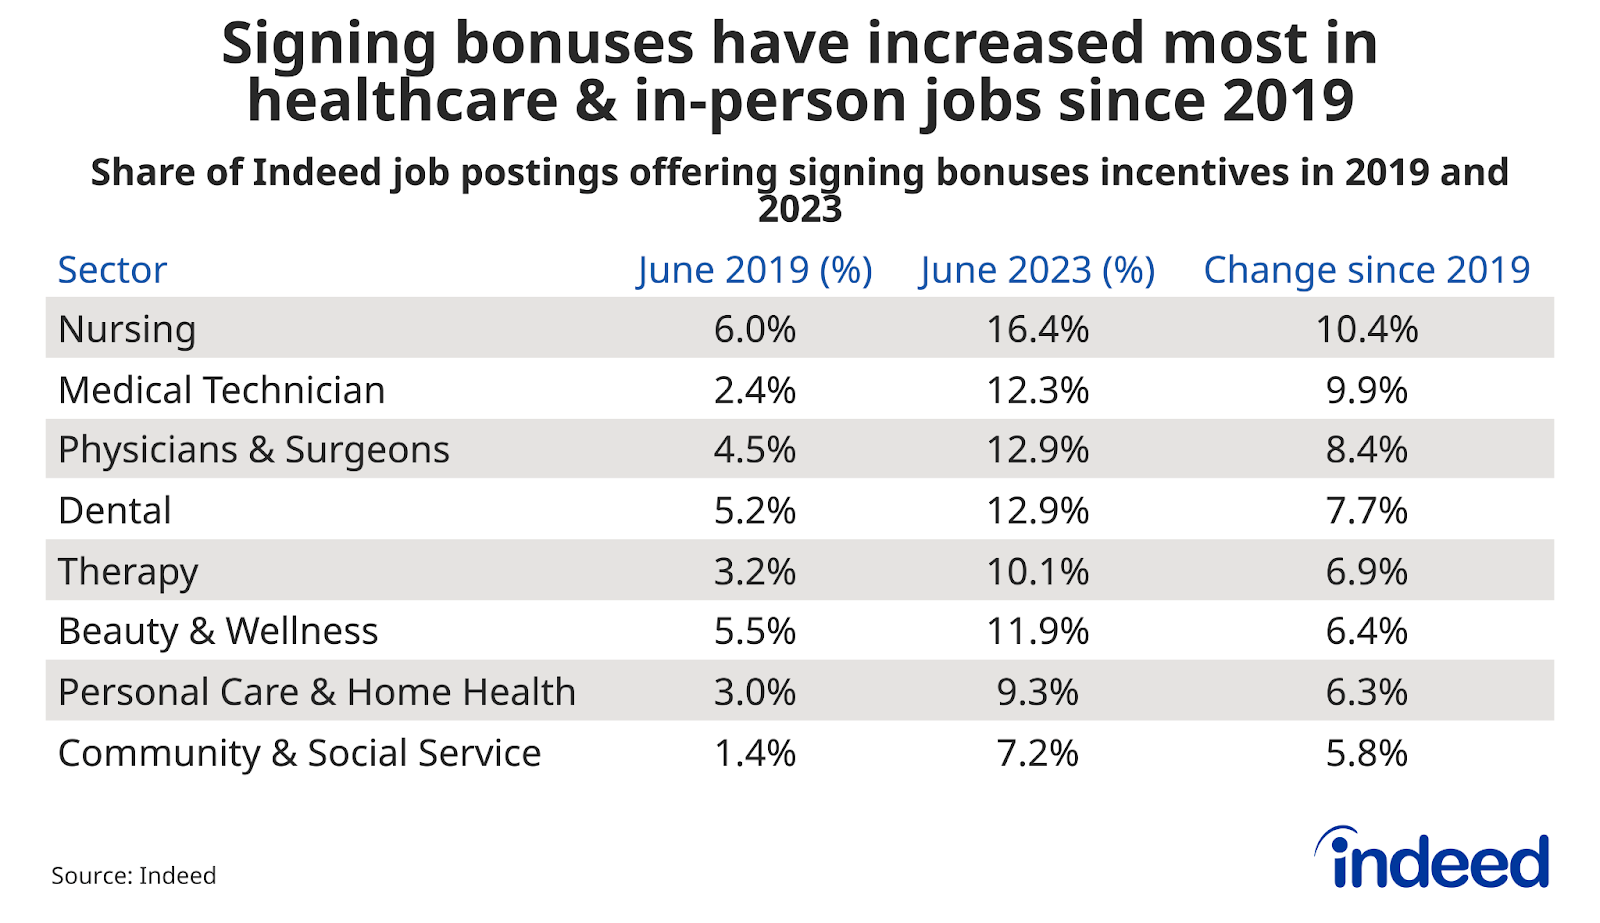
One reason why overall signing bonus advertisements remain so high may be attributable to elevated bonus rates among healthcare and other in-person sectors during and after the pandemic, relative to 2019. Signing bonus offerings have grown five times above their pre-pandemic baseline for medical technicians (from 2.4% to 12.3%) and nearly tripled for physicians & surgeons (4.5% to 12.9%) and nursing workers (6% to 16.4%). Demand for workers in many of these sectors is still well above pre-pandemic levels, and competition among employers is likely a prime motivator for higher-than-average levels of signing bonus activity. As of July 21, job postings for physicians & surgeons were 92% above February 2020 levels, according to the Indeed Job Posting Index, while medical technicians and nursing roles were up 59% and 52%, respectively.
Labor Market Overview
Overall, employment continues to grow briskly and joblessness is low, but the labor market is definitively cooling off from the red-hot levels reached a year ago. Job postings on Indeed have declined for most of this year and were down 16% as of July 21, compared to the same day a year ago. Wage growth has also cooled recently, and some sectors, notably tech and media, are laying off workers at elevated rates. But compared to historical standards, wage growth and job postings are still high, and layoffs remain low. In short, while it may yet stumble in the face of ongoing tight monetary policy, stress in the US banking system, and/or slowing economic growth, the labor market is so far proving remarkably resilient.
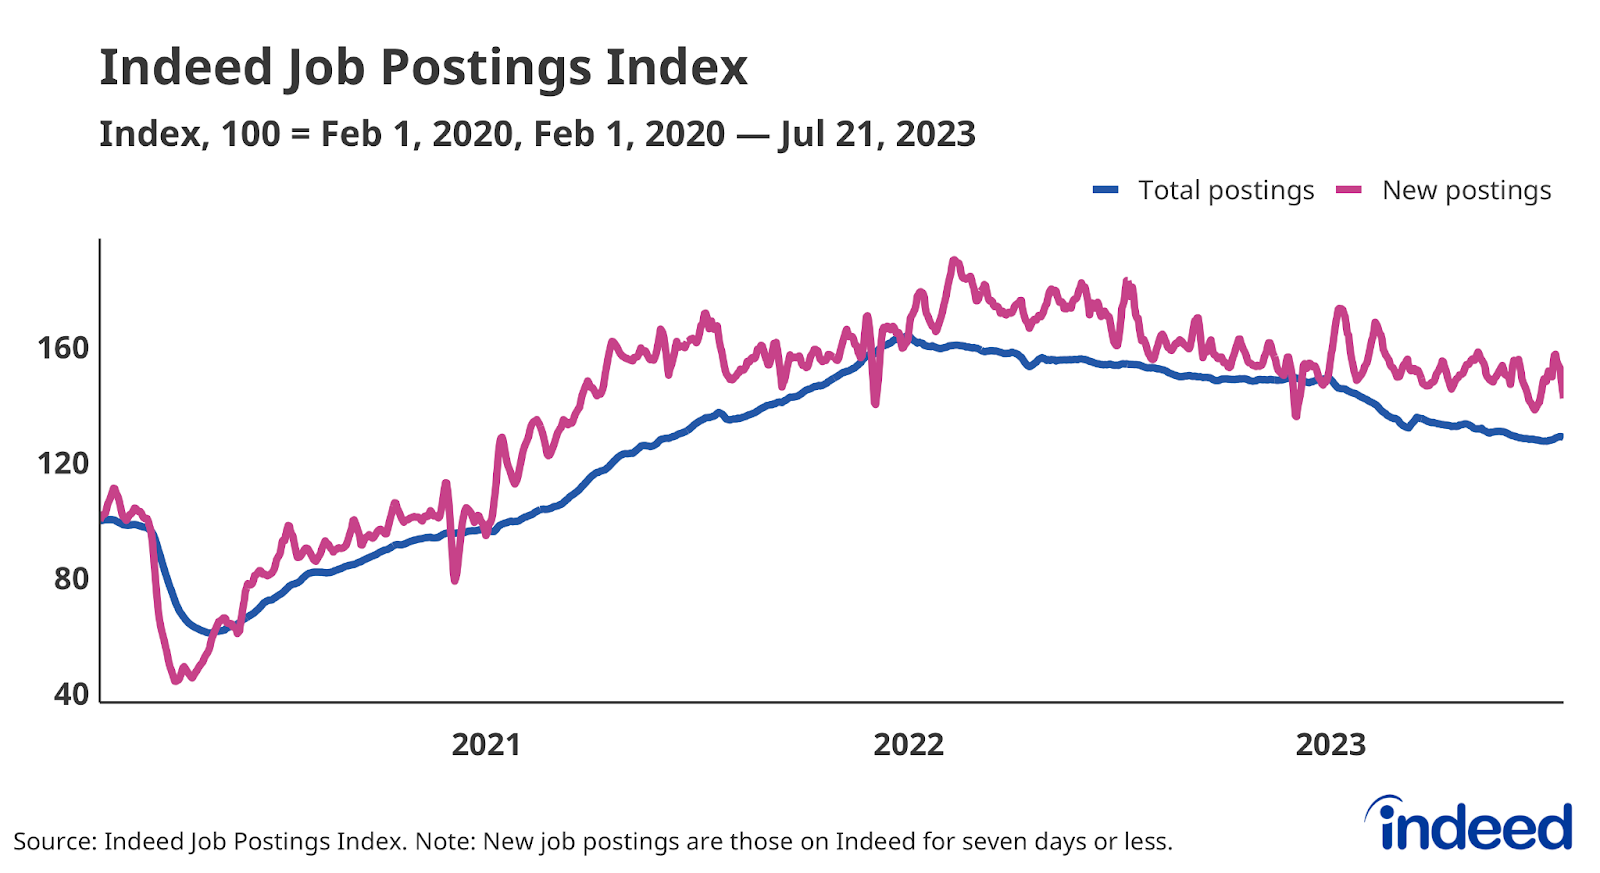
Line graph titled “Indeed Job Postings Index” with a vertical axis spanning from 40 to 160. The index is set so the daily number of job postings on February 1, 2020 is equal to 100. The index declined for much of 2022 and continues in 2023.
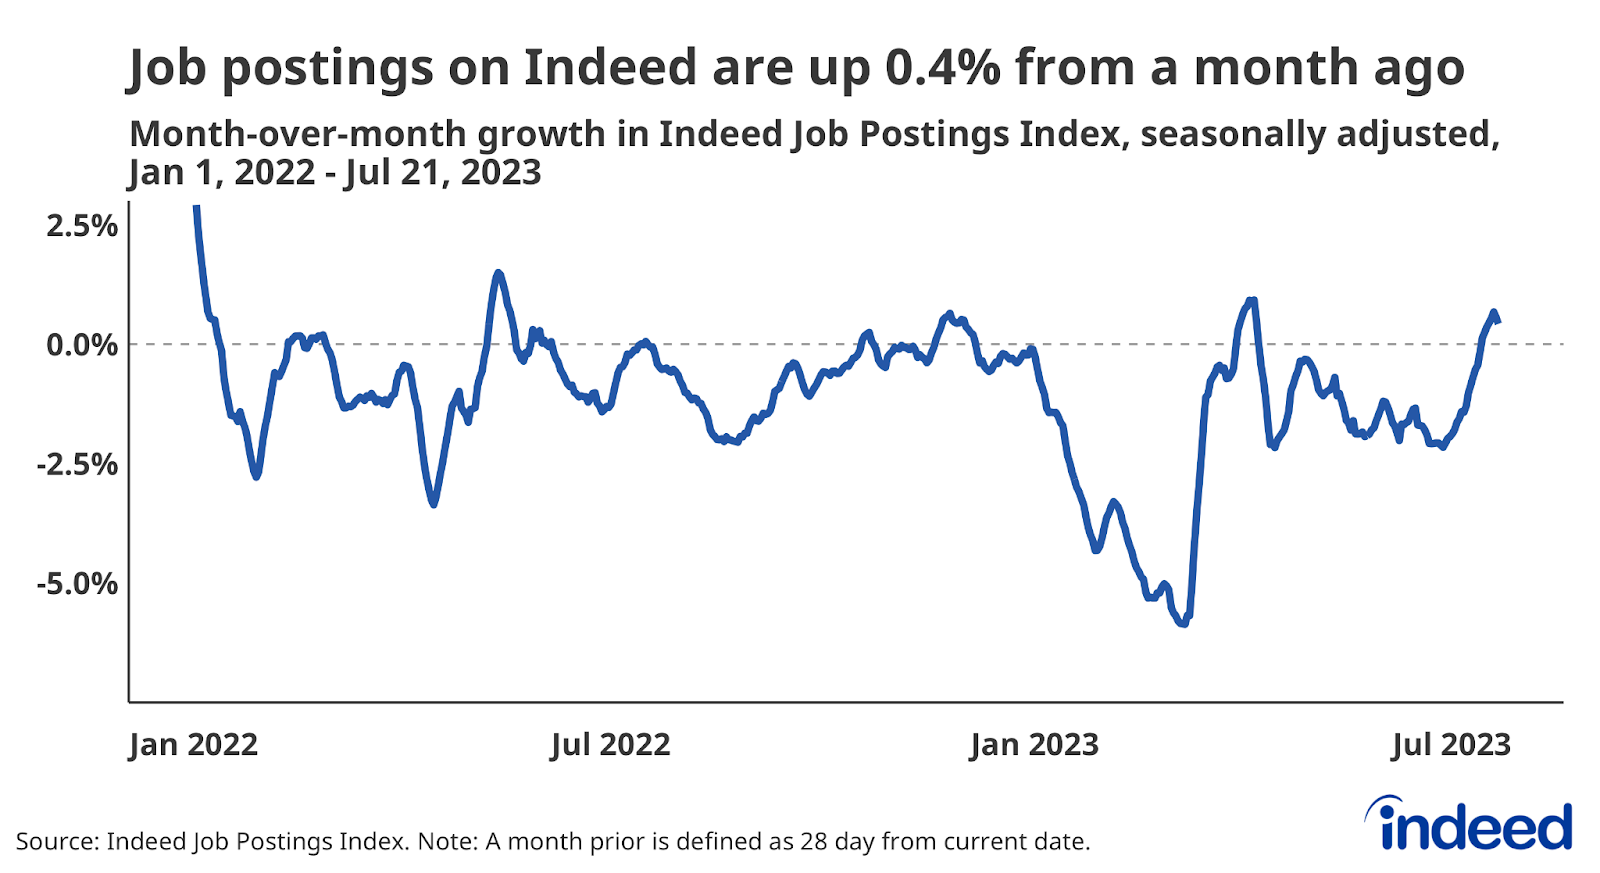
Even while fading somewhat from the sky-high levels reached in early 2022, employer demand for workers remains strong by historical standards. There were about 1.6 open jobs for every unemployed worker nationwide at the end of May, according to federal data, down from the March 2022 peak of about two jobs openings for each jobless worker, but still high. Indeed’s Job Postings Index, a more timely measure, also indicates that employers’ hiring appetites have faded but remain high. Total postings spiked in early July but started moving down again recently, and were up 0.4% from a month prior as of July 21. New postings, defined as those on Indeed for seven days or less, also picked up in early July, but recently have begun trending down again as well.
People have returned to work
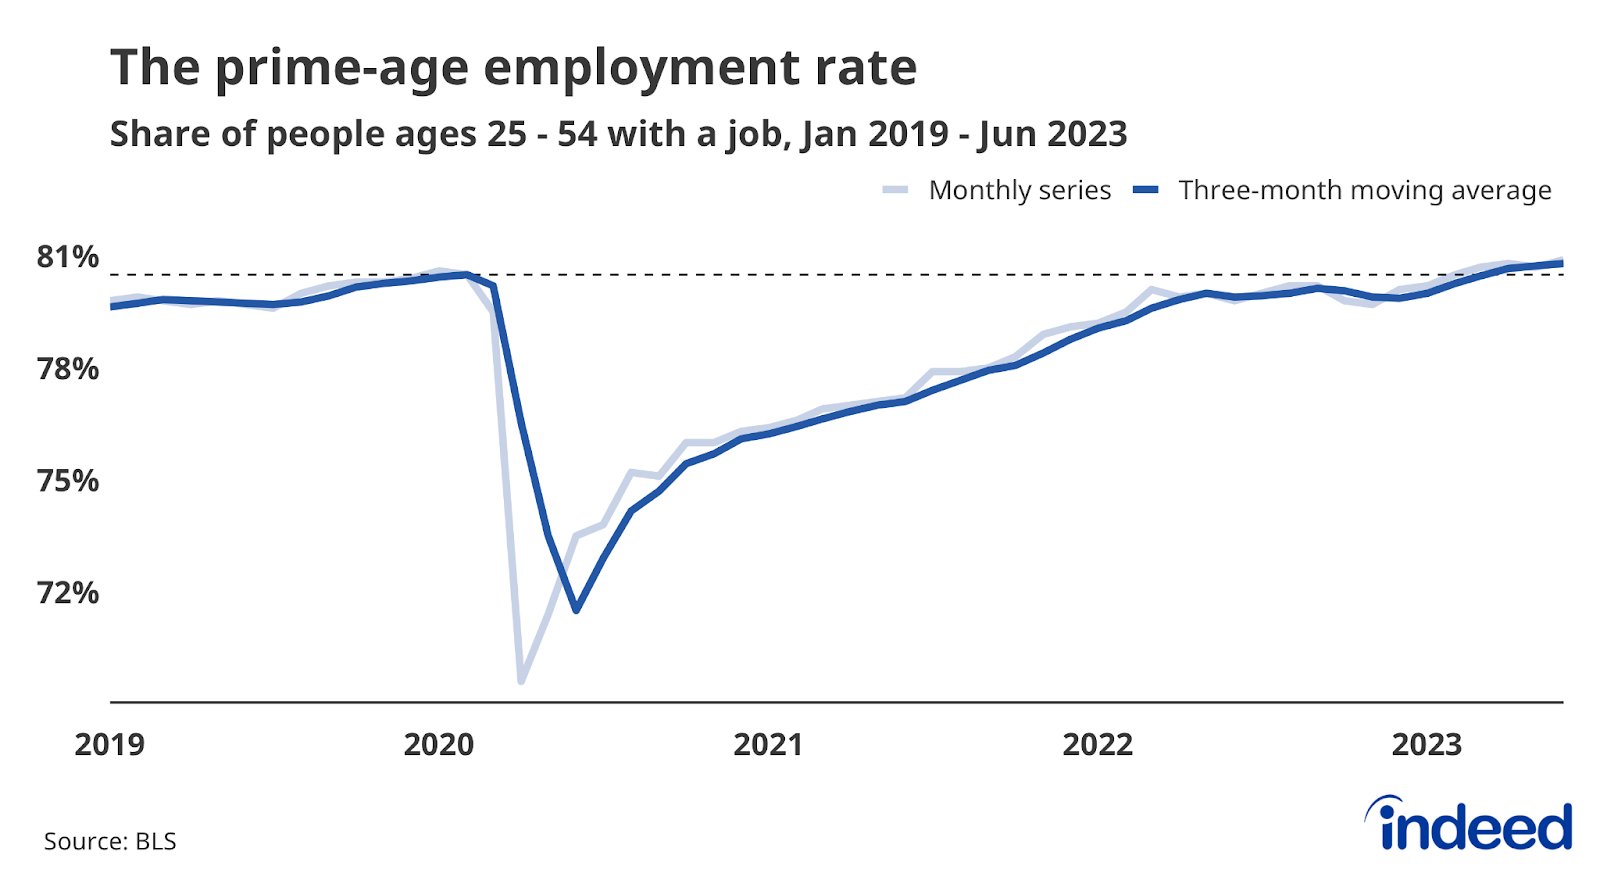
Strong demand has led to robust hiring and more workers finding jobs. The employment-to-population ratio for workers ages 25-54, a good measure of the health of the labor market, stood at 80.9% in June. In other words, almost 81% of people in this age group had a job in June — above pre-pandemic levels though still below the average of 81.5% recorded in 2000.
But largely because of an aging population, the employment rate for all working-age adults was just 60.3% in June, less than the pre-pandemic rate of 61.1%. Many people continue to “unretire,” but a decline in that trend — coupled with a rise in workers entering retirement and the continued aging of the population — all suggest we shouldn’t expect older Americans to be a significant source of employment moving forward.
Quitting is above 2019 levels, and layoffs might be trending up (from a very low level)
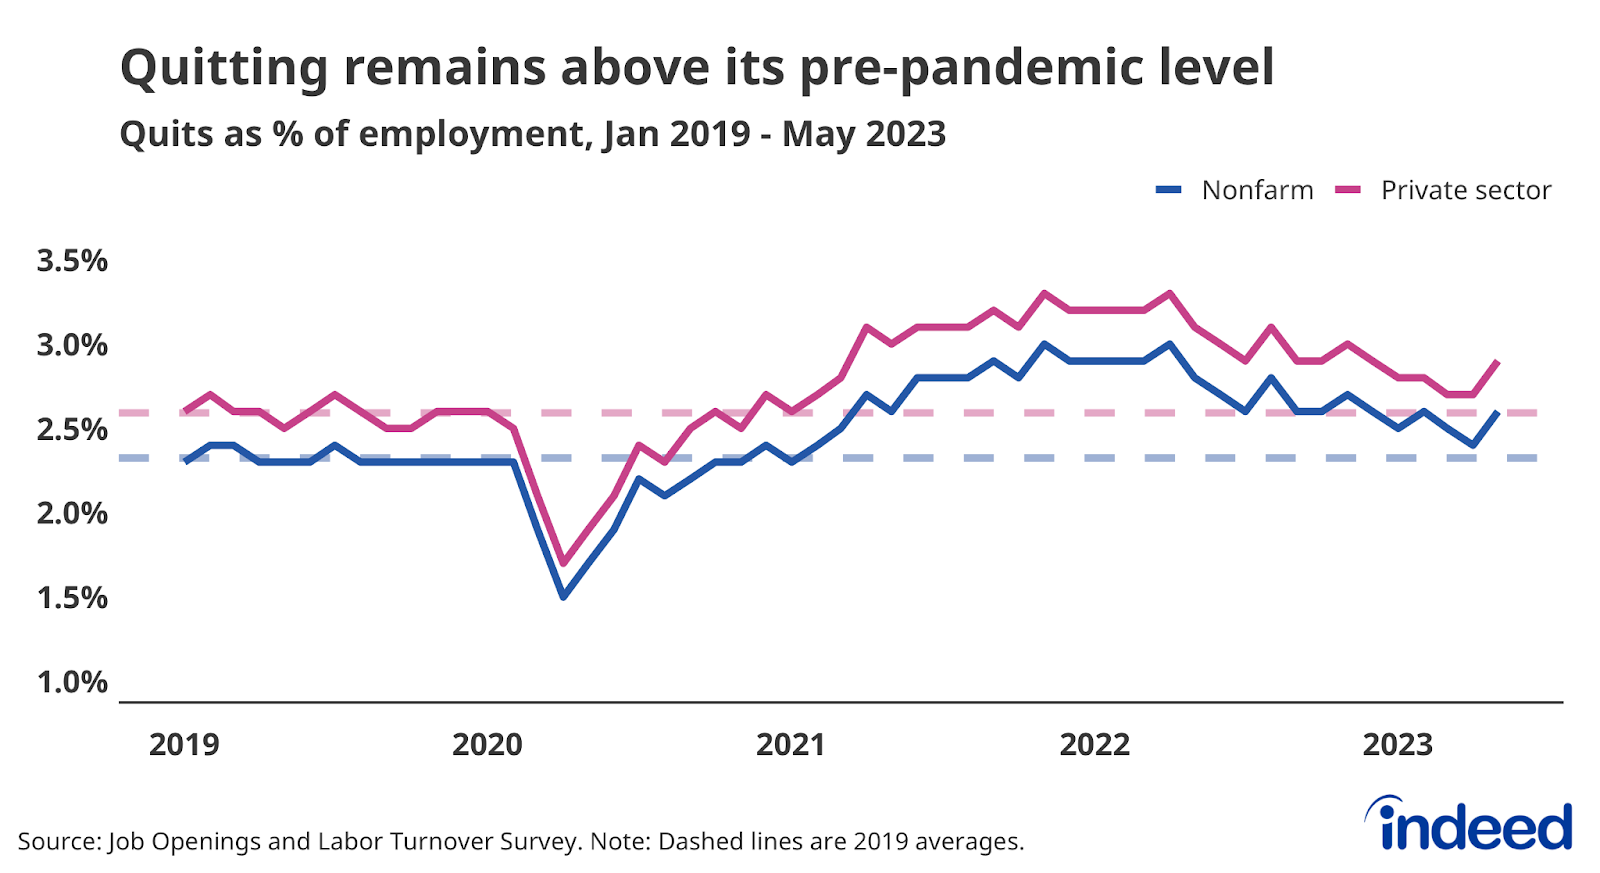
The job-quitting rate ticked up to 2.6% in May, above the pre-pandemic, 2019 average of 2.3%, but has been trending downward since peaking at 3% in April 2022. Workers quitting their old jobs and finding new roles is typically a major driver of overall wage gains, so the declining quits rate suggests wage growth will also likely continue to trend down.
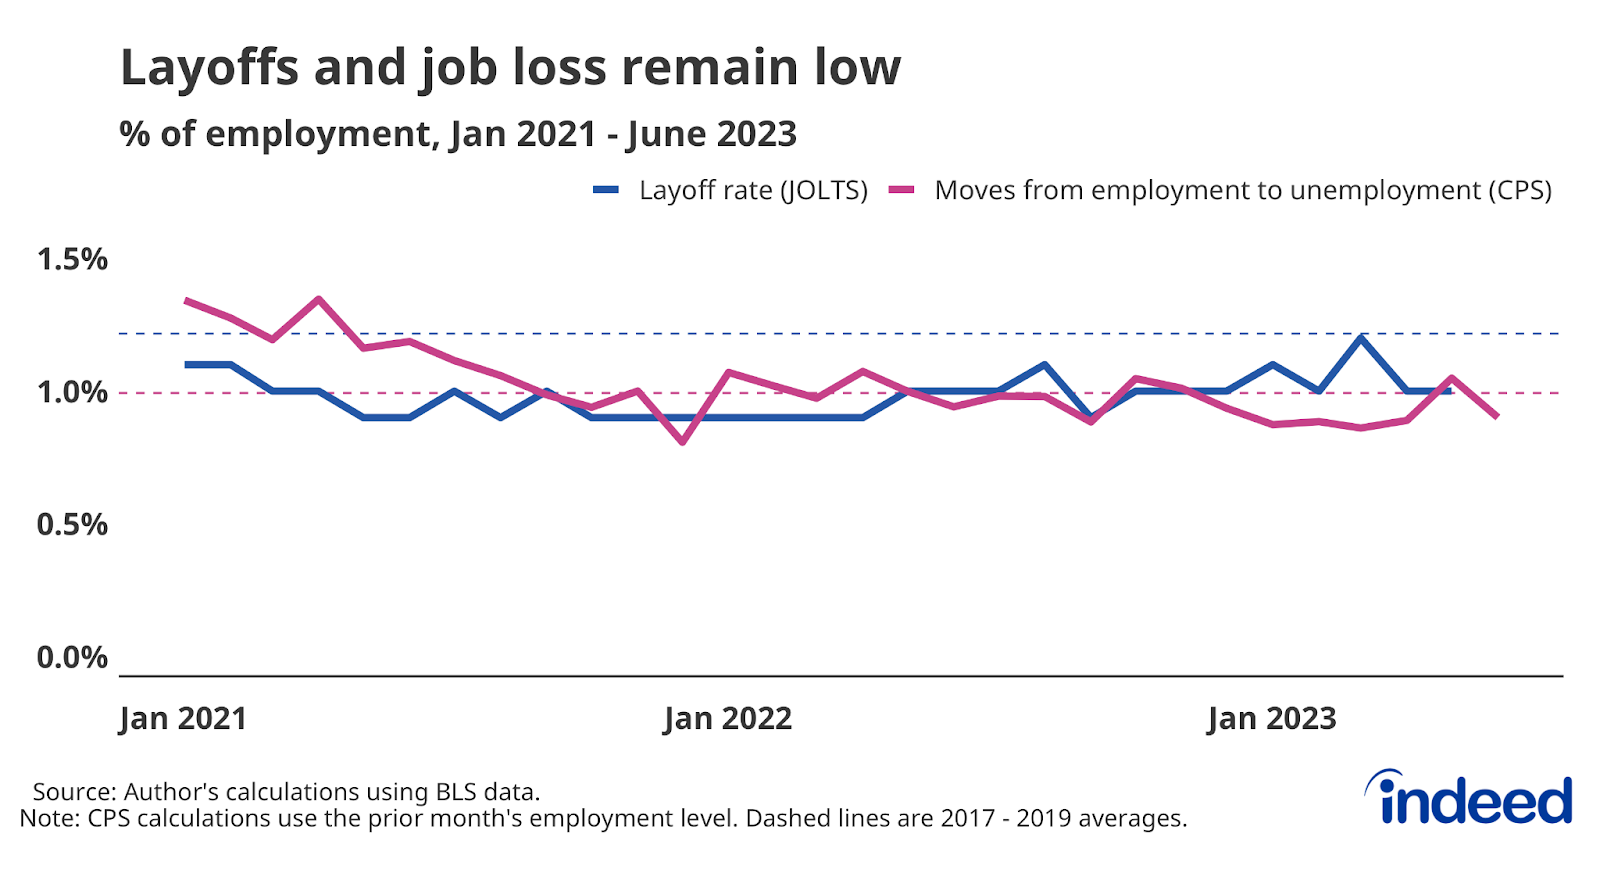
And while workers are more readily leaving jobs, employers seem relatively reluctant to lay them off. The national layoffs and discharge rate remained flat at 1% in May, below the pre-pandemic average of 1.2%. While there has been some volatility in the layoff rate and other measures of job loss, there has been no broad-based rise in employers shedding workers.
Wage growth is elevated, but cooling
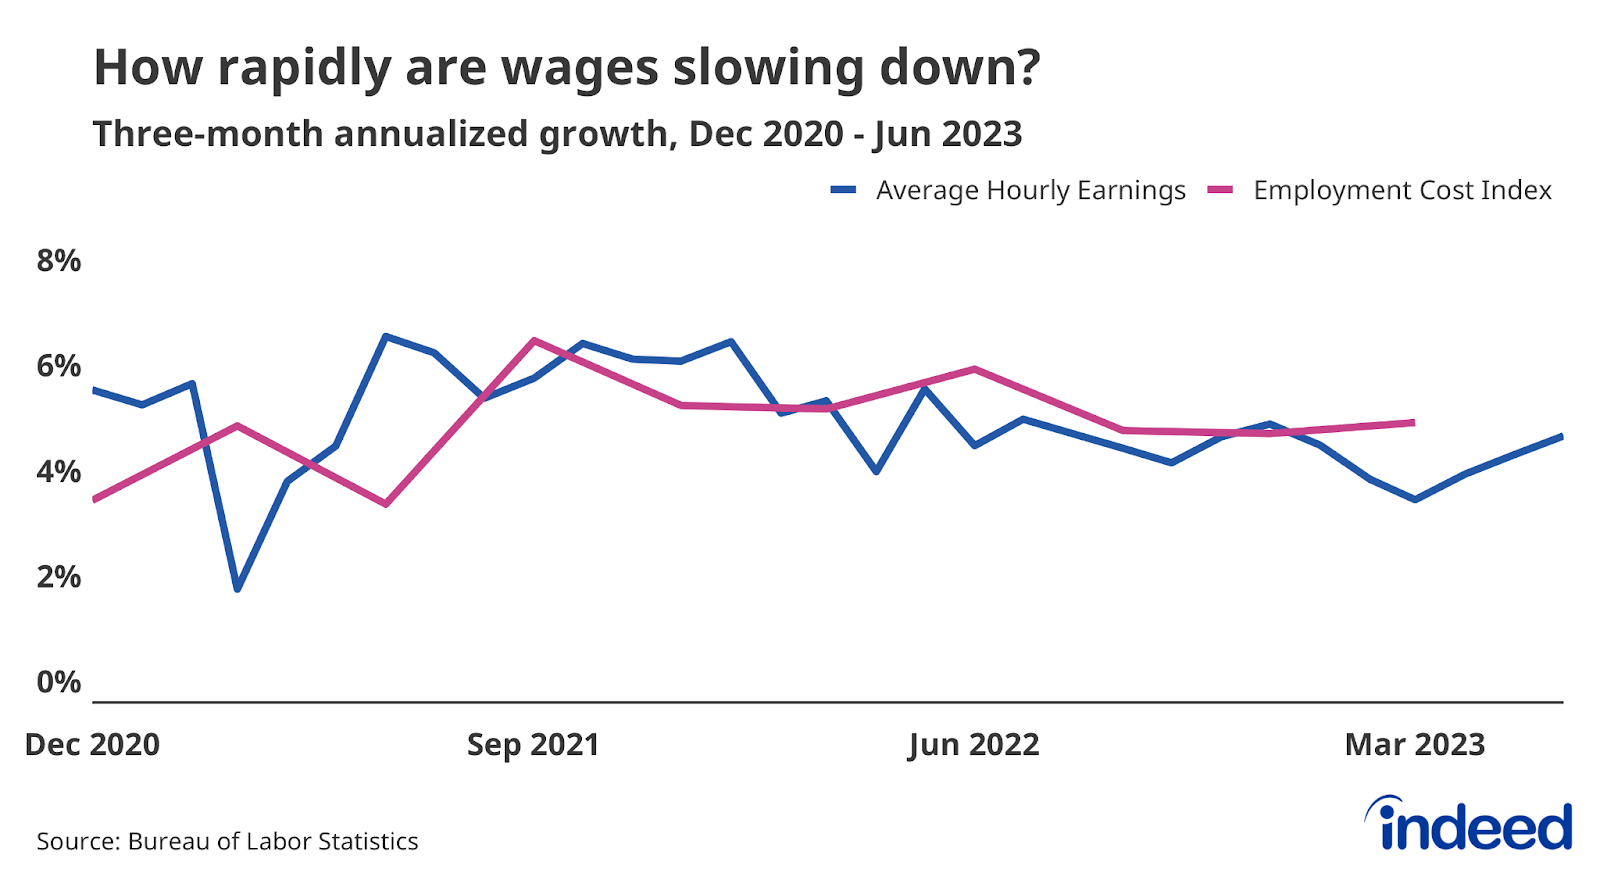
Intense employer competition for new hires across multiple sectors pushed annual wage growth up between 5% and 6% for much of the past few years, a faster growth rate than at any point over the past 20 years. But these data are measuring so-called nominal wage growth — pay gains measured before taking inflation into account.
Several measures of wage growth show that pay increases have started to slow down, though very gradually. The widely-cited Average Hourly Earnings data from the US Bureau of Labor Statistics recently showed wage growth falling back to immediate pre-pandemic levels. But more recent data shows wage growth still has considerable momentum. Older but generally more reliable data from the Q1 Employment Cost Index corroborates this trend and will be something to watch when Q2 data are released on July 28. The latest data from the Indeed Wage Tracker suggests that wage growth is likely to continue to slow, though that process may take some time.
Methodology
Data on seasonally adjusted Indeed job postings are an index of the number of seasonally adjusted job postings on a given day, using a seven-day trailing average. February 1, 2020, is our pre-pandemic baseline, so the index is set to 100 on that day. We seasonally adjust each series based on historical patterns in 2017, 2018, and 2019. We adopted this methodology in January 2021. Data for several dates in 2021 and 2022 are missing and were interpolated. Non-seasonally adjusted data are calculated in a similar manner except that the data are not adjusted to historical patterns.
The number of job postings on Indeed.com, whether related to paid or unpaid job solicitations, is not indicative of potential revenue or earnings of Indeed, which comprises a significant percentage of the HR Technology segment of its parent company, Recruit Holdings Co., Ltd. Job posting numbers are provided for information purposes only and should not be viewed as an indicator of the performance of Indeed or Recruit. Please refer to the Recruit Holdings investor relations website and regulatory filings in Japan for more detailed information on revenue generation by Recruit’s HR Technology segment.
We track signing bonus offerings by tallying US job postings on Indeed that mention paying upon hire with terms like “signing bonus,” “sign on bonus,” “signing incentive,” or “bonus for signing on” in the job description. Data is not adjusted for seasonality or changes in job mix, but a 3-month moving average is used, and the analysis found that recent declines in signing bonus offers were broad-based.