
Key Points:
- The construction labor market, a potential epicenter of a labor market downturn caused by higher interest rates, instead remains relatively strong with postings still elevated and wage growth still robust.
- Overall, the labor market remains robust as elevated demand for workers keeps joblessness low and employment growing briskly.
- Despite painful cuts in sectors, including tech and media, layoffs remain low by historical standards.
- The level of job postings is falling but still high, with postings down 17% year-over-year but still 28% above their pre-pandemic level as of June 23, 2023.
- Nominal wage growth remains strong and is cooling at a gradual pace as the labor market continues to find a more sustainable balance between supply and demand.
The US labor market remains resilient and continues to defy expectations, despite recent signs of cooling including a decline in job postings and slowing wage growth. This resilience is on full display in the construction industry, which is showing surprising strength despite a rapid rise in key federal interest rates and a more-than doubling in mortgage interest rates over the past 18 months that would otherwise be expected to slow it down.
Spotlight: Despite tight monetary policy, the construction labor market is still standing
Economists, policymakers, and everyday Americans have been bracing for a broad-based economic downturn for more than a year, but the recessionary shoe has yet to drop so far. Instead, a variety of data shows a resilient economy that has slowed in many ways but is still powering ahead and a labor market, specifically, that is moderating but has significant enduring strength.
Consider the housing market, a sector of the economy generally expected to significantly weaken after the Federal Reserve raised key federal interest rates from near zero to more than 5% in a little more than a year as part of its inflation-fighting efforts. This led to a concurrent rise in mortgage interest rates, from near-historic lows in early 2022 to near multi-decade highs by mid-2023 — a rise that significantly dented housing affordability and was expected to dampen home buying demand and homebuilding in turn. And while economic activity has moderated and home sales volumes overall have fallen from recent highs, there hasn’t been a significant correction in housing prices, and housing construction activity has picked up as of late.
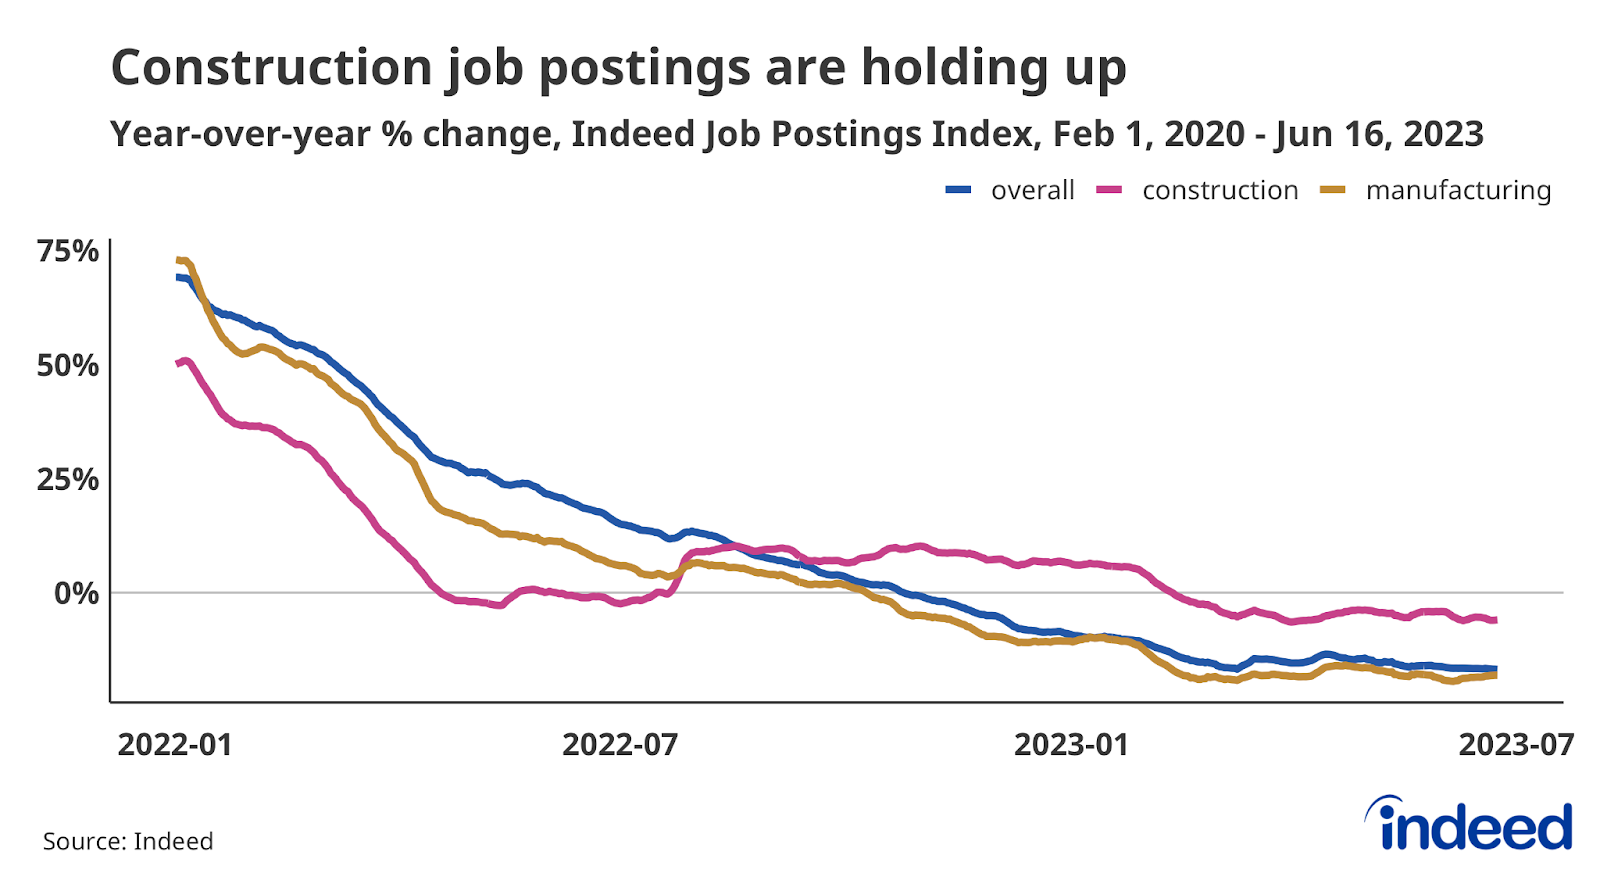
We see this continued strength in housing echoed in the labor market through construction job postings. Construction job postings were down 6% year-over-year as of June 23, but they are holding up better than overall postings which are down 17%. They are also stronger than manufacturing job postings, another interest-rate sensitive sector that is down 18% year-over-year.
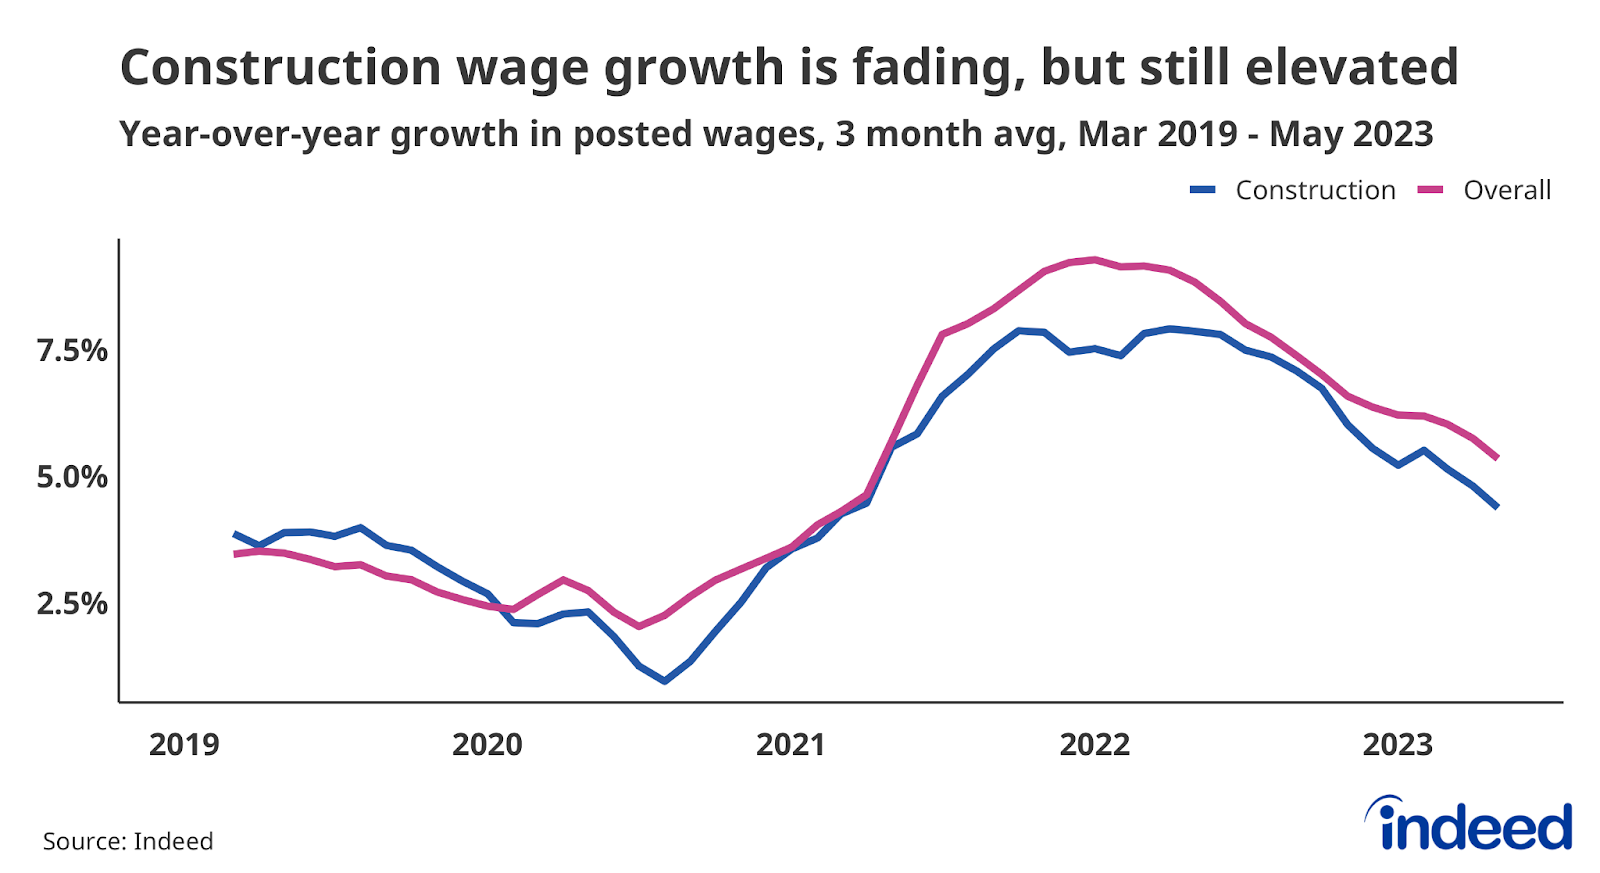
And even as demand for construction workers has declined somewhat over the past year, competition to hire workers into these roles — measured in terms of posted wage growth — remains strong. According to the Indeed Wage Tracker, posted annual wage growth for Construction jobs was 4.4% in May 2023, up from an annual average of 3.6% across 2019. While wage growth in this sector has slowed from its recent peak, it never grew as quickly as wages in some other sectors. But the simple fact that wage growth in this sector didn’t crash in the face of higher interest rates, and instead remains historically strong, is remarkable.
Why has construction held up so well? Partly because the housing market hasn’t crashed as some might have expected. There’s also the possibility that demand for construction from other parts of the economy, such as manufacturing companies building new factories, has also kept demand for workers elevated, along with an influx of new road and infrastructure projects after passage of the bipartisan infrastructure bill. Either way, more than 15 months after the Federal Reserve started hiking interest rates, the construction labor market and the overall labor market have proven more resilient than most expected.
Labor Market Overview
Overall, employment continues to grow briskly and joblessness is low, but the labor market is definitively cooling off from the red-hot levels reached a year ago. Job postings on Indeed have declined for most of this year and were down 17% as of June 23 compared to the same day a year ago. Wage growth has cooled recently, and some sectors, notably tech and media, are laying off workers at elevated rates. But compared to historical standards, wage growth is still high and layoffs remain low. In short, the labor market is resilient but may yet stumble in the face of ongoing tight monetary policy, stress in the US banking system, and slowing economic growth.
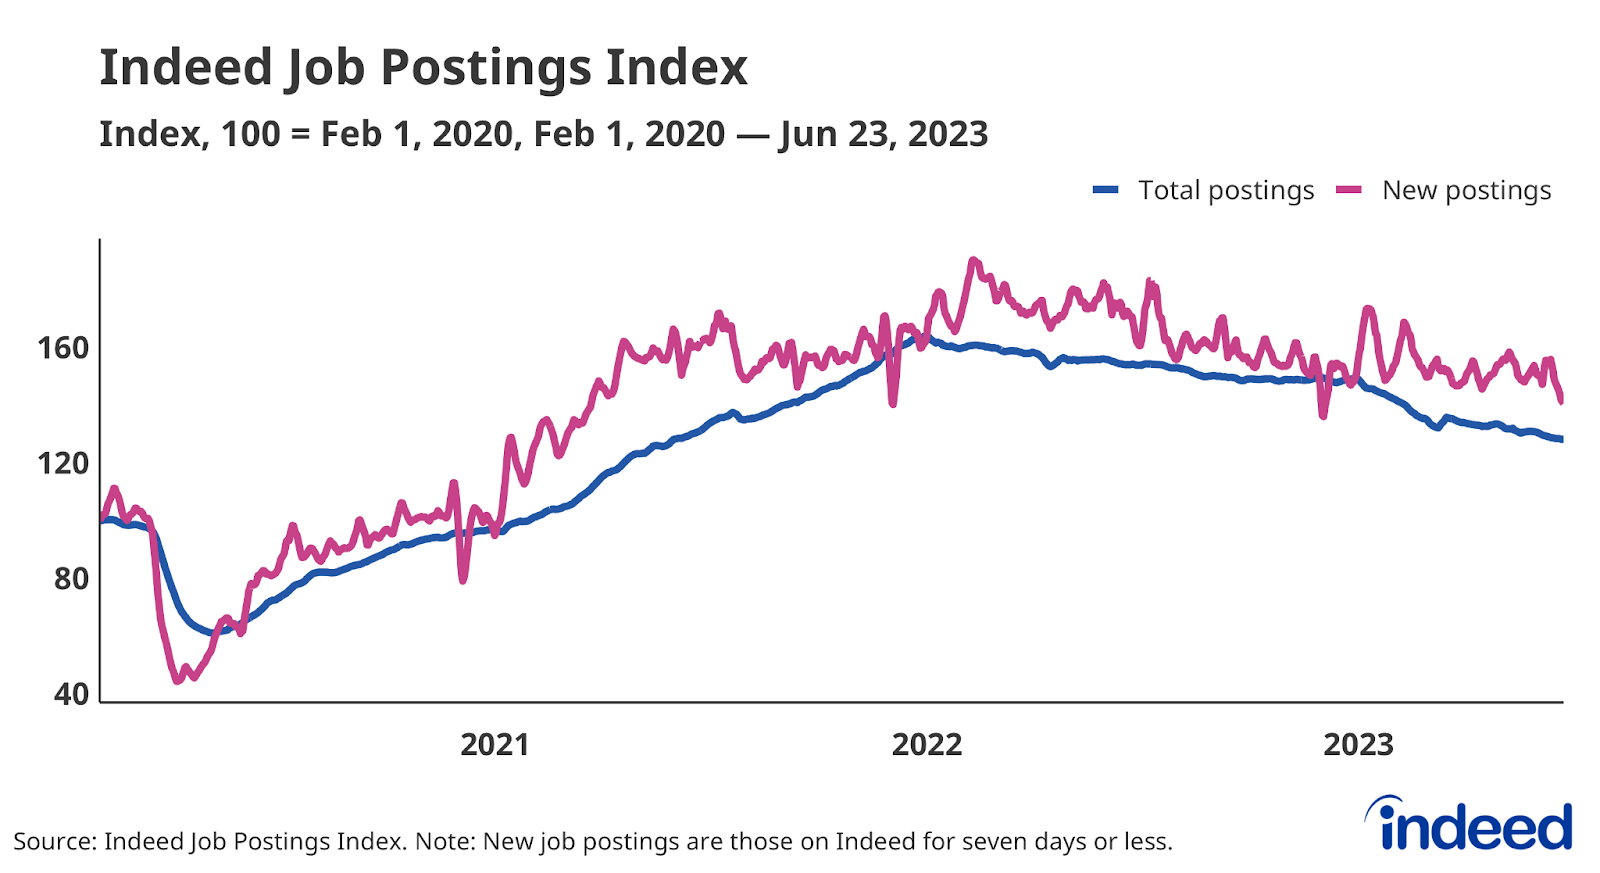
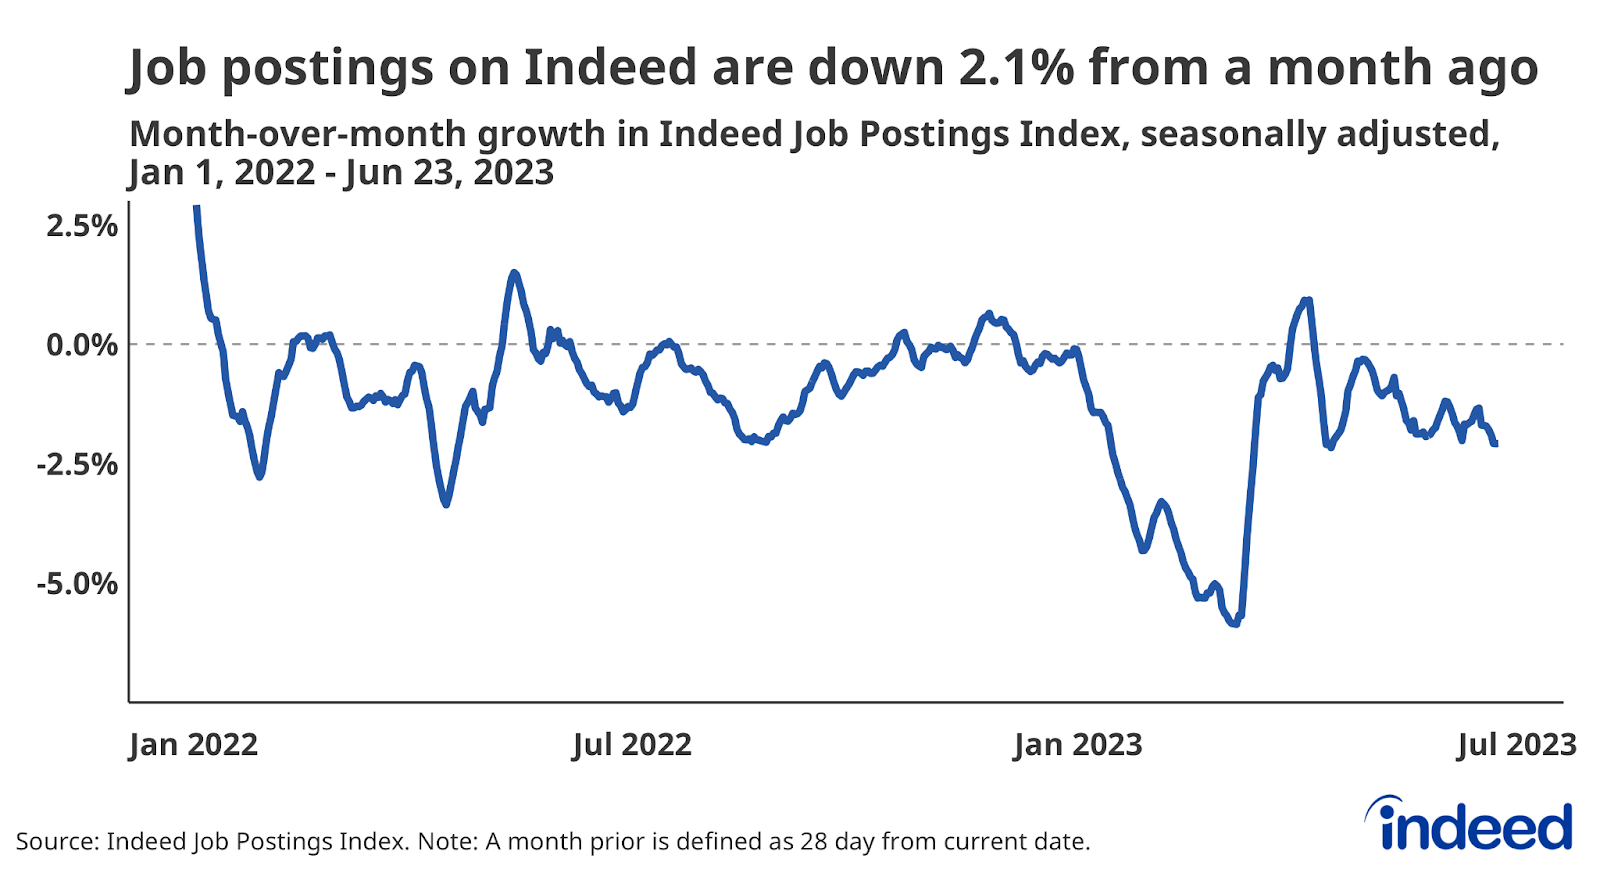
But even while fading somewhat from sky-high levels reached in early 2022, employer demand for workers remains strong by historic standards. There were about 1.7 open jobs for every unemployed worker nationwide at the end of April, according to federal data, down from the March 2022 peak of about two jobs openings for each jobless worker, but still elevated. Indeed’s Job Postings Index, a more timely measure, also indicates that employers’ hiring appetites have faded but remain high. Total postings have been falling continuously after a sharp spike in mid-March, and as of June, were down 2.1% from a month prior. New postings, defined as those on Indeed for seven days or less, were also down month-over-month, but only modestly.
People have returned to work
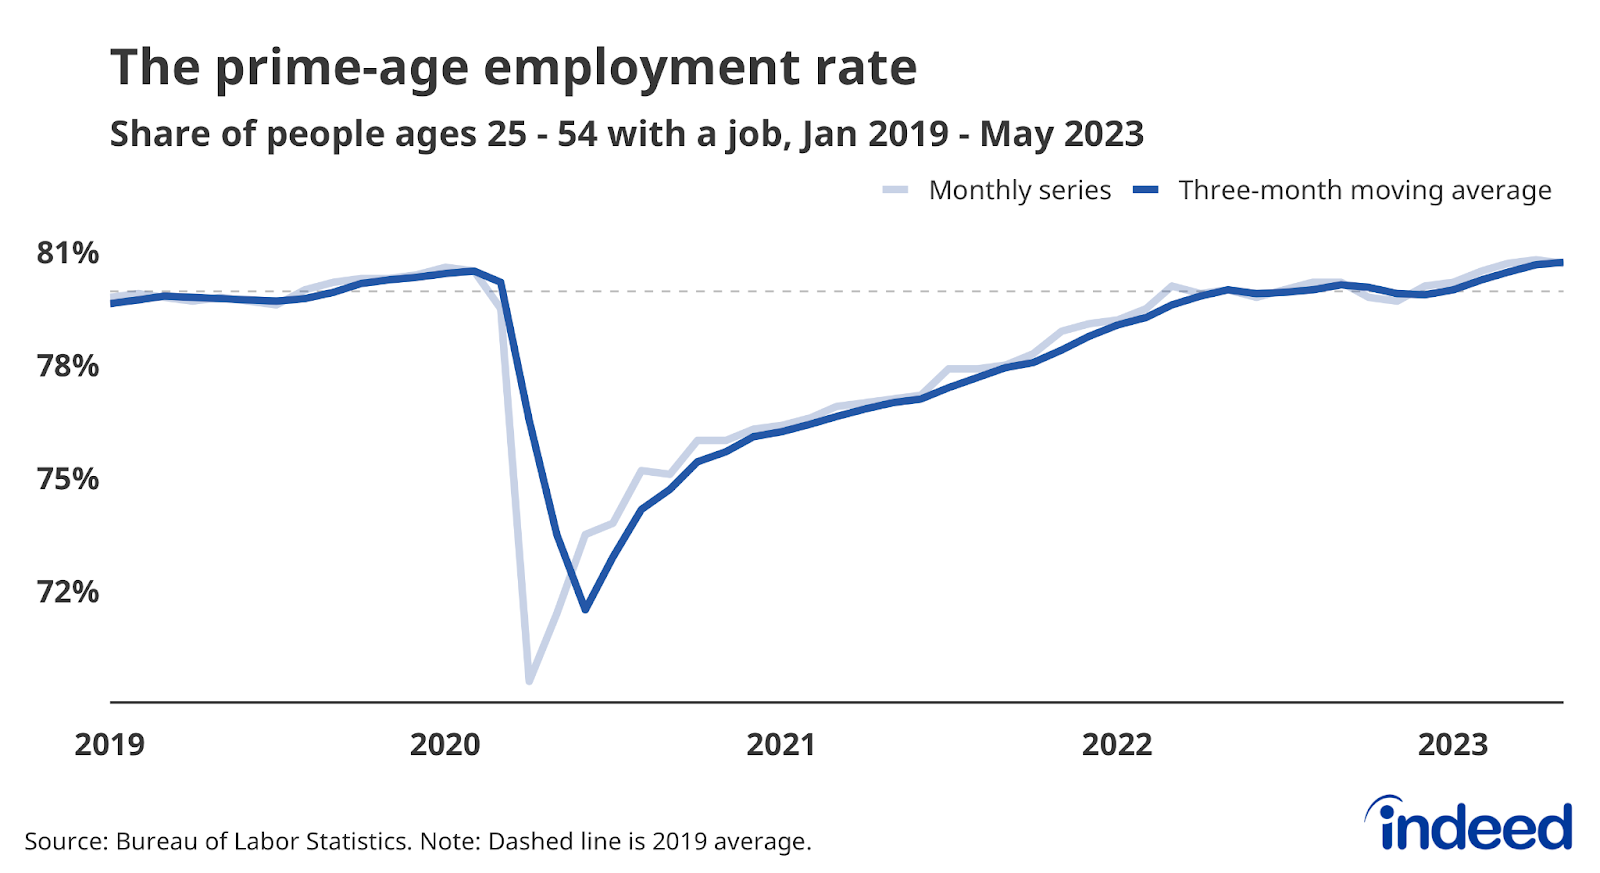
Strong demand has led to robust hiring and more workers finding jobs. The employment-to-population ratio for workers ages 25-to-54, a good measure of the health of the labor market, stood at 80.7% in May. In other words, almost 81% of people in this age group had a job in May — above pre-pandemic levels, though still below the average of 81.5% recorded in 2000.
But largely because of an aging population, the employment rate for all working-age adults was just 60.3% in May, less than the pre-pandemic rate of 61.1%. Many people continue to “unretire,” but a decline in that trend coupled with a rise in workers entering retirement and the continued aging of the population all suggest we shouldn’t expect older Americans to be a significant source of employment moving forward.
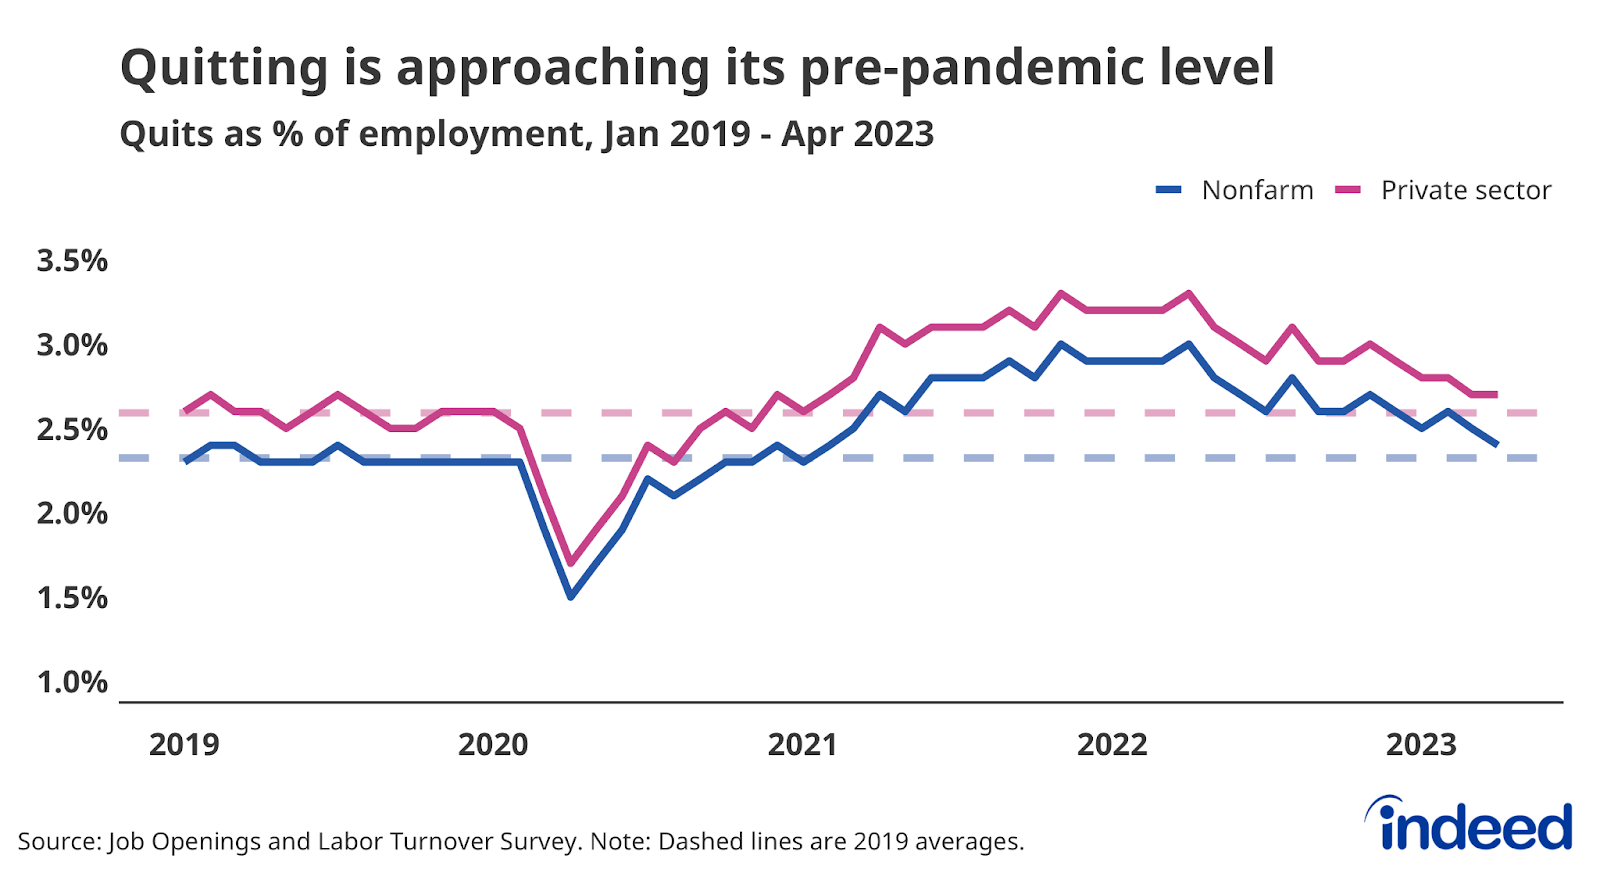
Quitting is approaching 2019 levels, and layoffs might be trending up (from a very low level)
The job-quitting rate fell to 2.4% in April, barely above its 2019 average of 2.3%. Workers quitting their old jobs and finding new roles is typically a major driver of overall wage gains, so the declining quits rate suggests wage growth will likely continue to trend down even if it remains robust for now.
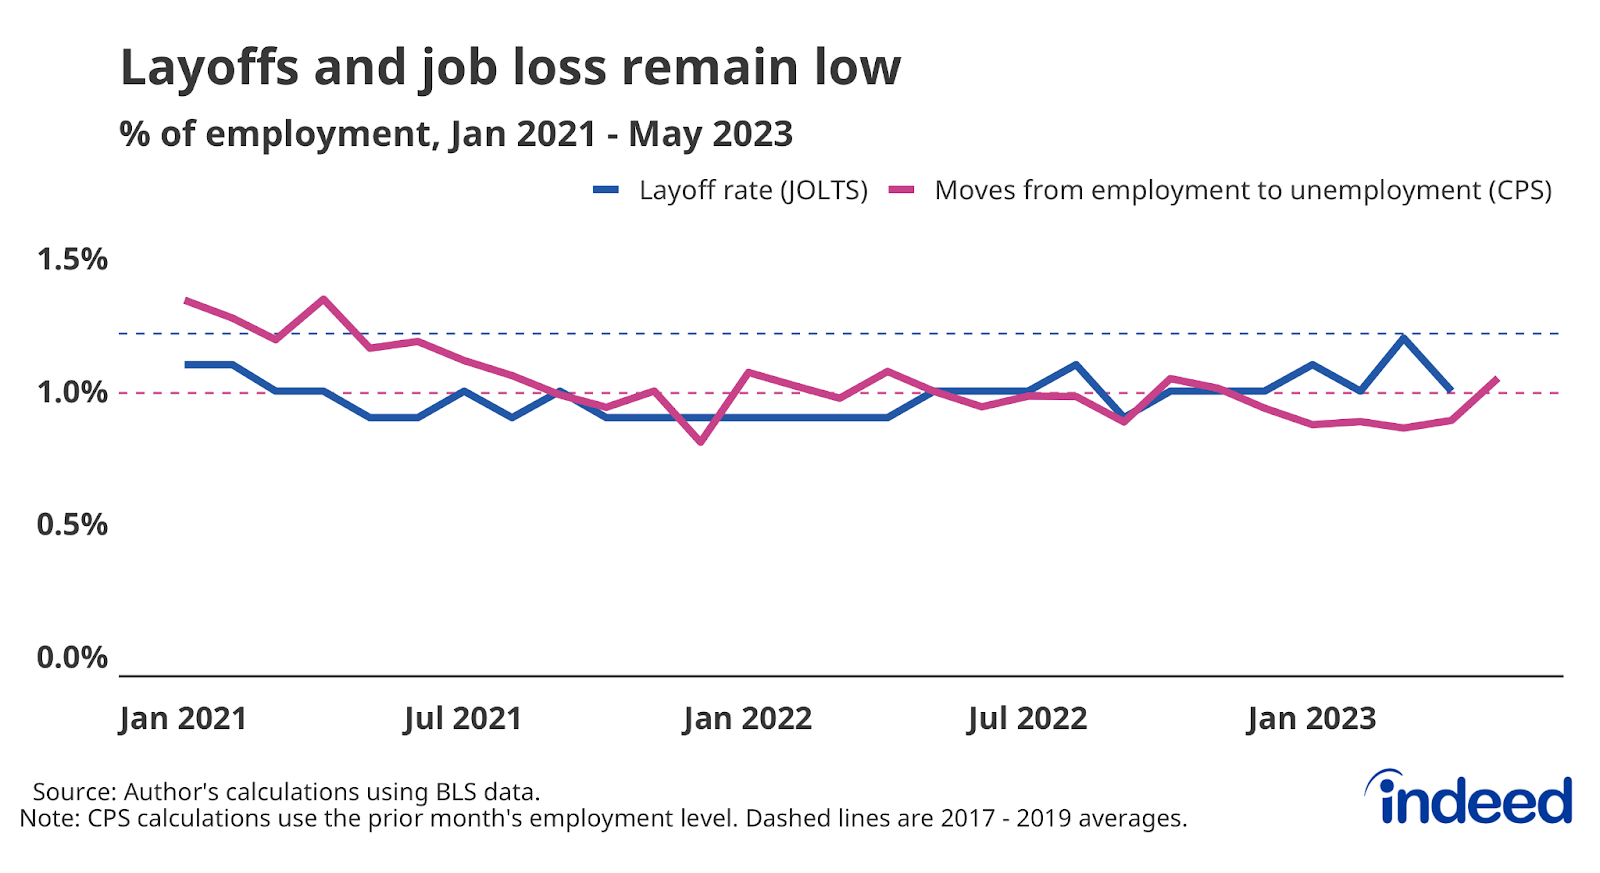
And while workers are more readily leaving jobs, employers seem relatively reluctant to lay them off. The national layoffs and discharge rate declined to 1% in April, below the pre-pandemic average of 1.2%. While there has been some volatility in the layoff rate and other measures of job loss, there has been no broad-based rise in employers shedding workers.
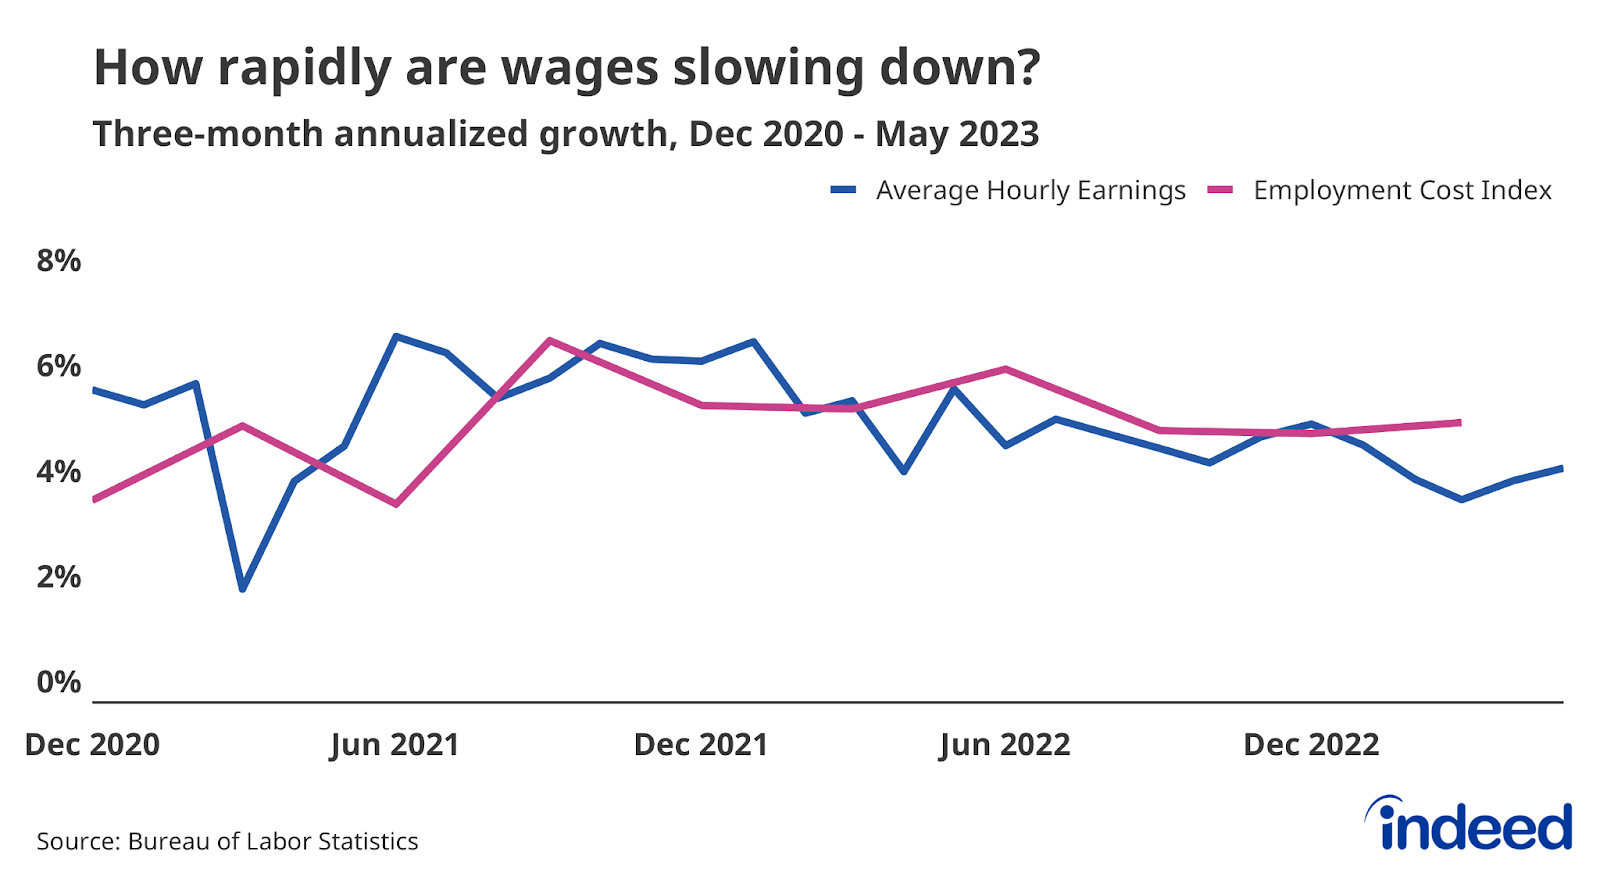
Wage growth is elevated, but cooling
Intense employer competition for new hires across multiple sectors pushed annual wage growth up between 5% and 6% for much of the past few years, a faster growth rate than at any point over the past 20 years. But these data are measuring so-called nominal wage growth — pay gains measured before taking inflation into account.
Several measures of wage growth show that pay increases have started to slow down, though very gradually. The widely-cited Average Hourly Earnings data from the US Bureau of Labor Statistics recently showed wage growth falling back to immediate pre-pandemic levels. But more recent data shows wage growth still has considerable momentum. Older but generally more reliable data from the Q1 Employment Cost Index corroborates this trend. The latest data from the Indeed Wage Tracker suggests that more wage deceleration is in store as posted wage growth continues to decline, though that process may take some time.
Methodology
Data on seasonally adjusted Indeed job postings are an index of the number of seasonally adjusted job postings on a given day, using a seven-day trailing average. February 1, 2020, is our pre-pandemic baseline, so the index is set to 100 on that day. We seasonally adjust each series based on historical patterns in 2017, 2018, and 2019. We adopted this methodology in January 2021. Data for several dates in 2021 and 2022 are missing and were interpolated. Non-seasonally adjusted data are calculated in a similar manner except that the data are not adjusted to historical patterns.
The number of job postings on Indeed.com, whether related to paid or unpaid job solicitations, is not indicative of potential revenue or earnings of Indeed, which comprises a significant percentage of the HR Technology segment of its parent company, Recruit Holdings Co., Ltd. Job posting numbers are provided for information purposes only and should not be viewed as an indicator of performance of Indeed or Recruit. Please refer to the Recruit Holdings investor relations website and regulatory filings in Japan for more detailed information on revenue generation by Recruit’s HR Technology segment.
We track summer hiring appetite by tallying Canadian job postings on Indeed that include the term “summer” in the job title, excluding postings with job titles that also include “intern” or “internship”. We track internship postings separately tallying the presence of the latter two terms in job titles. This method doesn’t capture the full extent of seasonal demand but provides a gauge of recent trends and how season postings compare to the prior year.