
Editor’s Note: May 2023 data marks a new release of the Indeed Wage Tracker, a measure of wage growth in job postings in eight countries. Indeed Hiring Lab is committed to delivering reliable, trustworthy, and comprehensive data and analysis of the global labor market. An upgrade to our internal salary data platform and enhancements to the ways Indeed classifies job titles in certain countries over the past several months delayed our usual publication of the wage tracker. These efforts, aimed at improving the quality of the data, led to small changes in the historical wage growth series compared with previously published data, but did not impact the fundamental trends.
Wage growth series are available for download here. For details about the data and methodology, please see Pawel Adrjan and Reamonn Lydon’s working paper, “What do wages in online job postings tell us about wage growth?”
Key points:
- The latest data from the Indeed Wage Tracker shows that US posted wages grew 5.3% year-over-year in May 2023, a marked decline from its peak of 9.3% in January 2022.
- At its current rate of deceleration, posted wage growth would return to its 2019 average of 3.1% late this year or early in 2024.
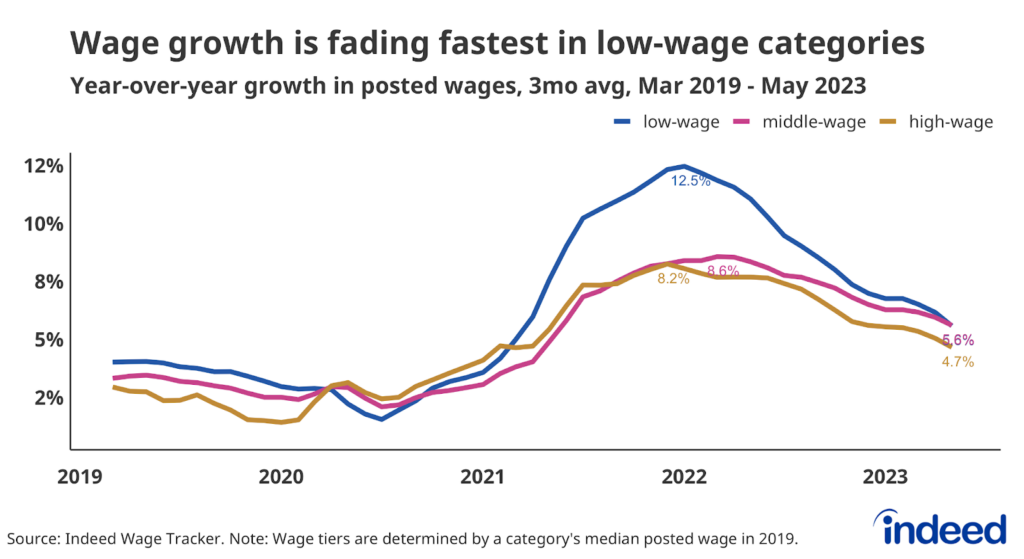
- While the slowdown in wage growth is broad-based, it has been more pronounced in low-wage occupational sectors, with posted wage growth for this group dropping from 12.5% to 5.6% since January 2022.
While still very strong compared to historic norms, annual growth in advertised wages in the US has dropped by almost half from its early 2022 peak, and could fall to pre-pandemic levels as soon as the end of this year, or early 2024. Whether that deceleration is fast or complete enough for Federal Reserve policymakers—who are closely watching wage growth as a key indicator of the success of their inflation-fighting efforts—remains to be seen.
A clear and continuing deceleration in posted wages
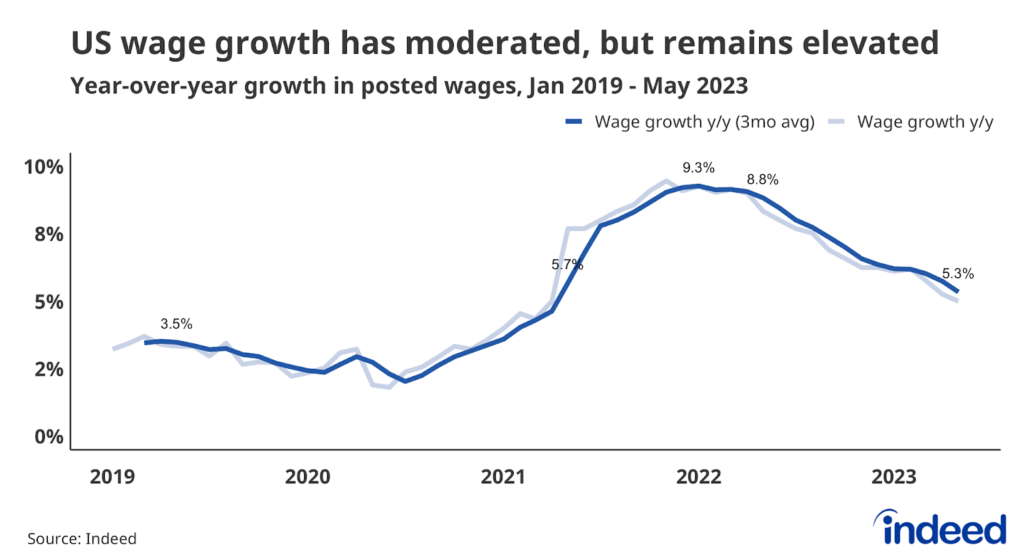
Wages and salaries advertised in Indeed job postings grew 5.3% year-over-year in May, according to the Indeed Wage Tracker. This is down considerably from the high of 9.3% set in January 2022, but still well above the 2019, pre-pandemic average pace of 3.1%.
However, while annual wage growth is currently elevated compared to historic norms, it won’t stay that way forever if it continues to decelerate in line with the current pace. Indeed analyzes both unsmoothed monthly data and data smoothed using a trailing 3-month average. If posted wages slow at the same rate as the smoothed data since February, then annual wage growth will slow to pre-pandemic levels by January 2024. If the slowdown happens at the more rapid pace of the unsmoothed data, posted wage growth will reach the 3.1% historic rate as soon as November
What does this mean for overall wage growth? Posted wages are a barometer of the market for new hires; the segment of the market most sensitive to the current health of the economy. The continued slowdown in the Indeed Wage Tracker suggests the slowdown in wage growth (as shown in statistics that capture wages for all workers) is likely to continue.
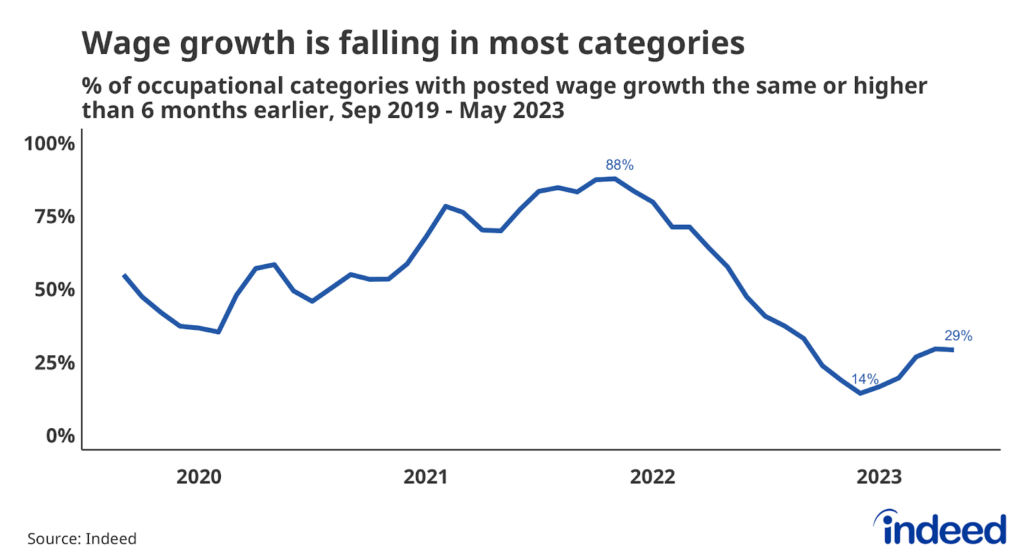
The breadth of the pullback in wage growth offers further evidence that the broad deceleration in posted wages is enduring. When growth was at its peak, just under 90% of occupational sectors were experiencing growth equal to or above its pace from six months prior. That share dropped to 29% in May. So while there are pockets of resistance, the bigger trend is a broad-based slowdown in wage growth across sectors.
Posted wages are slowing the most in low-wage sectors
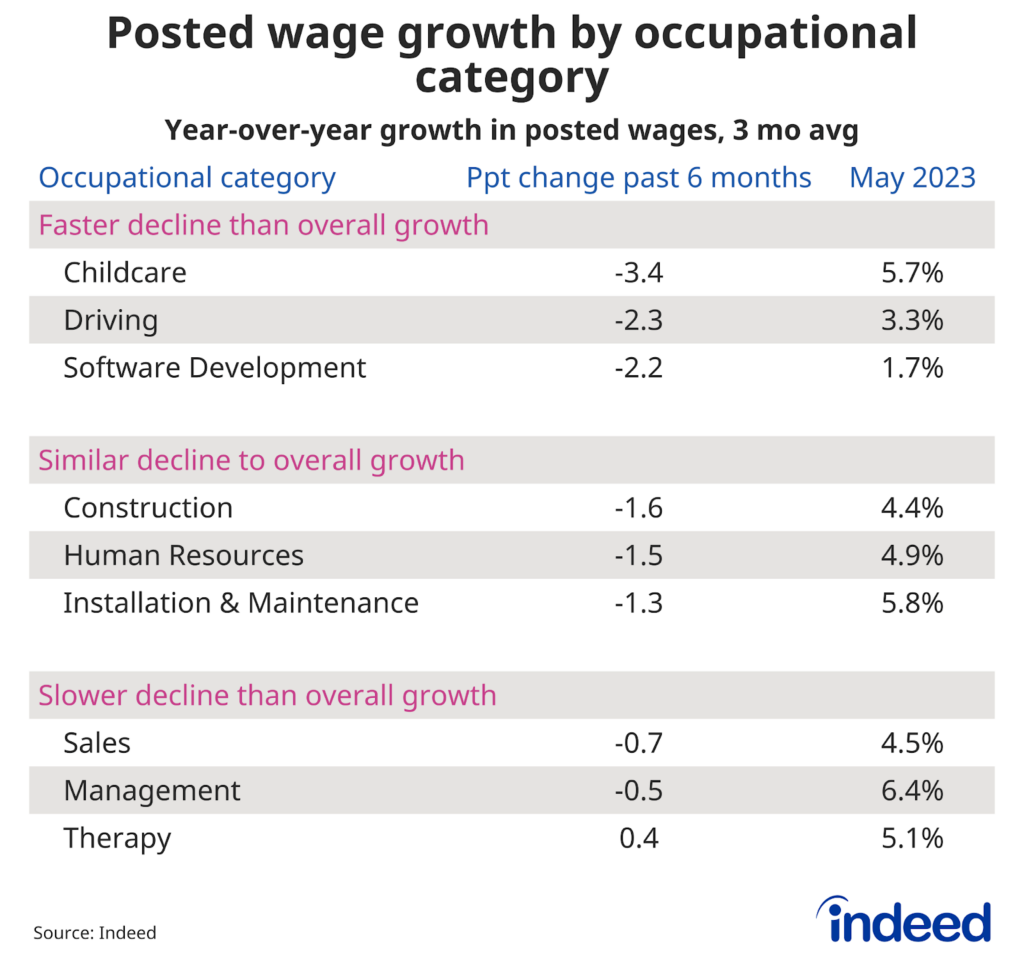
Still, there are sectors that are seeing a sharper or more mild pullback than headline growth. Software development—a sector highly exposed to recent high-profile layoffs and hiring freezes in the tech sector—is a good example of weakness. Not only have job postings for that sector dropped by almost 60% over the past year, but posted wage growth is also currently less than half of what it was in November.
But other sectors stand out for their resilience. Posted wage growth in construction has pulled back at roughly the same rate as the overall Indeed Wage Tracker but remains almost a percentage point above its 2019 average. That’s notable given the rapid rise in mortgage interest rates over the past year, which can lead to less residential and commercial development, leaving many to expect a dampening in construction hiring.
Broadly speaking, it is clear that the largest slowdowns in wage growth are happening in typically lower-paying sectors. After growing much more quickly than wages in other segments over the past several years, wage growth for low-wage and middle-wage sectors was identical in May. Posted wage growth in occupations including Food Preparation & Service and Retail, for example, has fallen notably since early 2022. The much-celebrated compression of wage inequality of the past two years seems to be ending.
Conclusion: Is this deceleration fast enough?
After more than two years of exuberance, wage growth is calming down. The continued deceleration of posted wages suggests that the gradual slowdown seen in other wage growth metrics will continue.
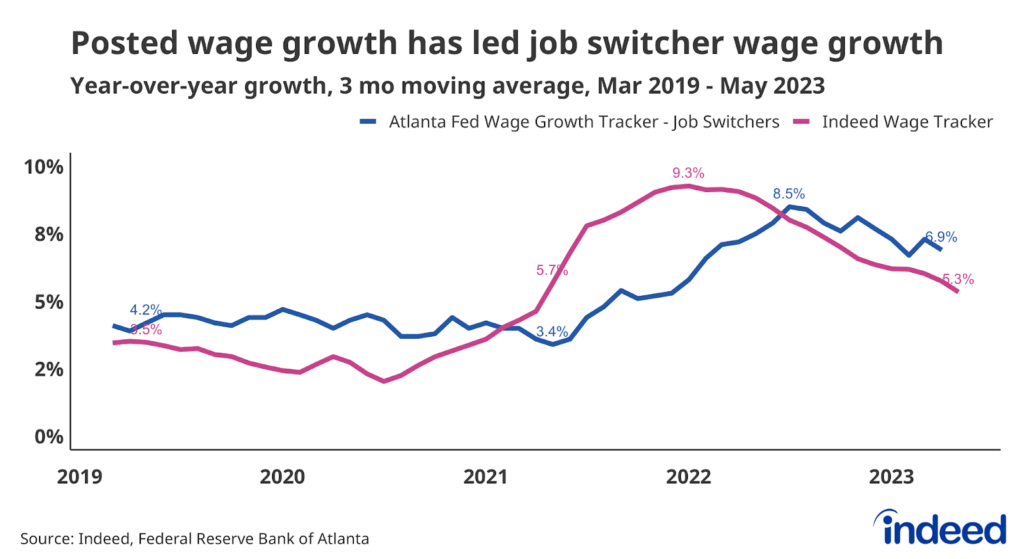
Given that a direct measure of wage growth—the Atlanta Fed’s Wage Growth Tracker series for Job Switchers—seems to lag the Indeed Wage Tracker by about six to seven months, means this wage growth measure is likely to fall closer to historic norms by late spring, or summer 2024. However, it’s not clear if the Federal Reserve, so deeply concerned about wage growth’s potential to keep inflation elevated, will be content with that timeline.
Methodology
To calculate the average rate of wage growth, we follow an approach similar to the Atlanta Fed US Wage Growth Tracker, but we track jobs, not individuals. We begin by calculating the median posted wage for a given country, month, job title, region and salary type (hourly, monthly or annual). Within each country, we then calculate year-on-year wage growth for each job title-region-salary type combination, generating a monthly distribution. Our monthly measure of wage growth for the country is the median of that distribution. Alternative methodologies, such as the regression-based approaches in Marinescu & Wolthoff (2020) and Haefke et al. (2013),produce similar trends.
More information about the data and methodology is available in a research paper by Pawel Adrjan and Reamonn Lydon, Wage growth in Europe: evidence from job ads, published in the Central Bank of Ireland’s Economic Letter series.
The wage tiers of occupational categories are determined by ranking categories by the median wage advertised in the sector in 2019. The categories are then split into three tiers so each tier contains categories that covered one-third of job postings on Indeed on an average day in 2019. The average posted wage growth for each tier is a weighted mean of each category in the tier in which the weight is the number of salary or wage observations in the category that month.