
Key Points:
- Internship and summer job postings are cooling from a year ago but remain above pre-pandemic levels.
- Overall, the labor market remains robust as elevated demand for workers keeps joblessness low and employment growing briskly.
- Despite painful cuts in sectors, including tech and media, layoffs remain low by historical standards.
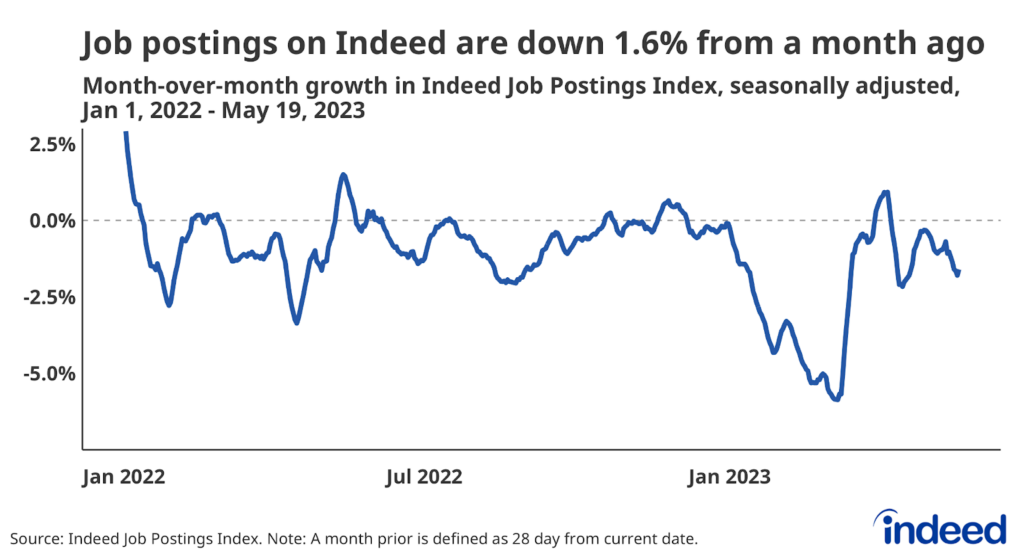
- The level of job postings is high but falling, with both total postings and new postings down from a month prior as of May 19, 2023.
- Nominal wage growth remains strong and is cooling at a gradual pace as the labor market continues to find a more sustainable balance between supply and demand.
While the US labor market remains resilient, characterized by strong labor demand and low joblessness, a cooldown in internship and summer job postings relative to recent years is the most recent example of an ongoing and gradual slowdown overall. And while still elevated compared to recent norms, the rate of job switching continues to slow, signaling that still-strong wage growth is likely to weaken moving forward.
Spotlight: Summer job opportunities are still elevated, but falling
As summer approaches and temperatures across the country rise, the job market for seasonal summer jobs is coming in cooler than last year. While job postings for summer jobs and internships are both still above their pre-pandemic levels, as of May 19, they were down 10.2% and 14.7%, respectively, from the same time a year ago. While the year-over-year decline is muted compared to the 16.1% decline in total job postings over the same period, the level of internship and summer job postings hit its peak earlier this year than in past years – a bad sign for those that got a late start to their seasonal job search. Those currently looking for internships, in particular, may face especially slim pickings this year compared to last May.
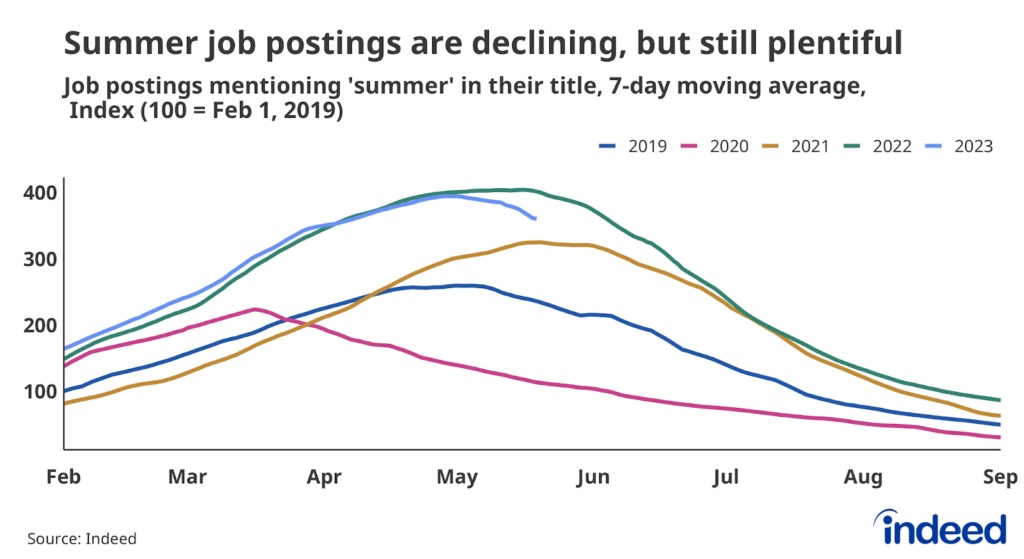
Jobs including camp counselor and cook are highly seasonal, typically ramping up in the spring and peaking sometime in May — last year’s peak was on May 16, and 2021’s on May 20. But this year’s peak came several weeks earlier, on April 30, more in line with the 2019, pre-pandemic peak of May 1. This shift in timing, combined with fewer postings, suggests employers’ seasonal hiring strategies are trending back toward those used before the pandemic.
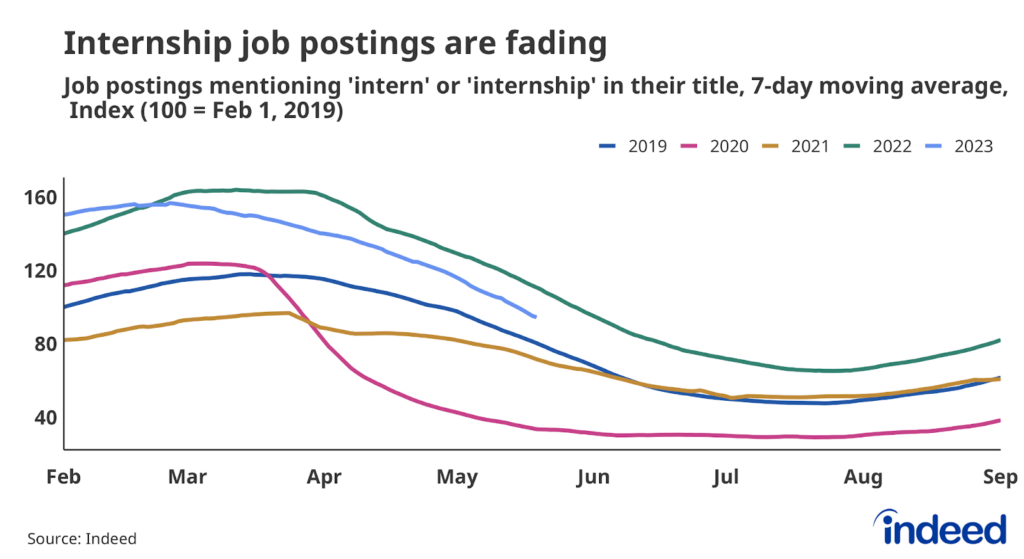
Internship job postings are declining more noticeably than seasonal summer jobs, mirroring the relative weakness of white-collar job postings across the US labor market. The annual peak in internship postings was also earlier this year, peaking on February 25, more than two weeks earlier than in 2022 (March 12) and 2019 (March 15). As of May 19, the number of internship postings still exceeded the level from the same day in 2019 by almost 18%. However, some of the advantages enjoyed by students in recent years may be fading for this year’s crop of internship candidates.
Labor Market Overview
Overall, employment continues to grow briskly and joblessness is low, but the labor market is definitively cooling off from the red-hot levels reached a year ago. Job postings on Indeed have declined for most of this year, and as of May 19, were down 16.1% compared to the same day a year ago. Wage growth has cooled recently, and some sectors, notably tech and media, are laying off workers at elevated rates. But compared to historical standards, wage growth is still high and layoffs remain low. In short, the labor market is resilient but may yet stumble in the face of ongoing tight monetary policy, stress in the US banking system, and slowing economic growth.
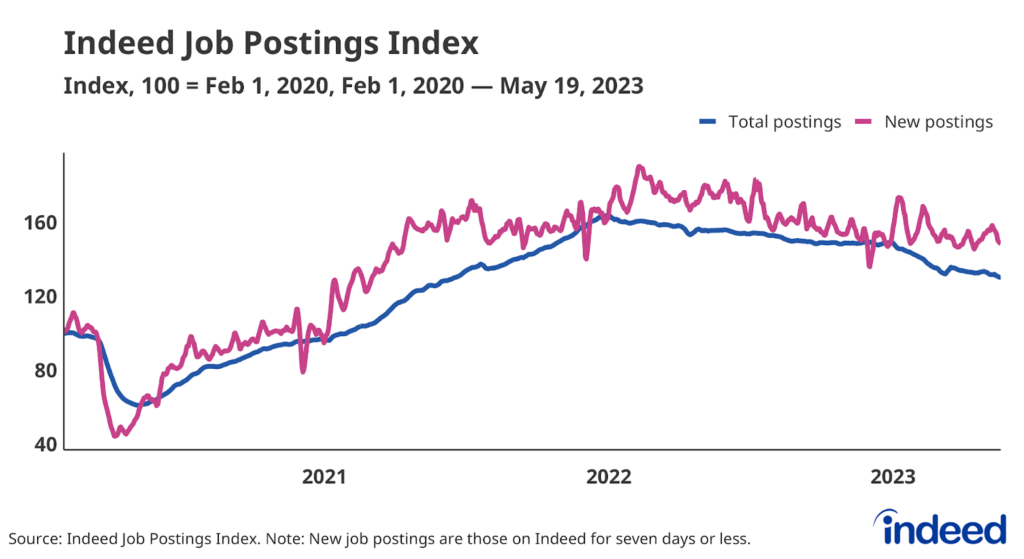
But even while somewhat fading, employer demand for workers remains strong. There were 1.6 open jobs for every unemployed worker nationwide at the end of March, down from the peak in March 2022 but still elevated. Indeed’s Job Postings Index, a more timely measure, also indicates that employers’ hiring appetites have faded. Total postings have been falling continuously after a sharp spike in mid-March, and as of May 19, were down 1.6% from a month prior. New postings, defined as those on Indeed for seven days or less, were also down month-over-month, but only modestly.
People have returned to work
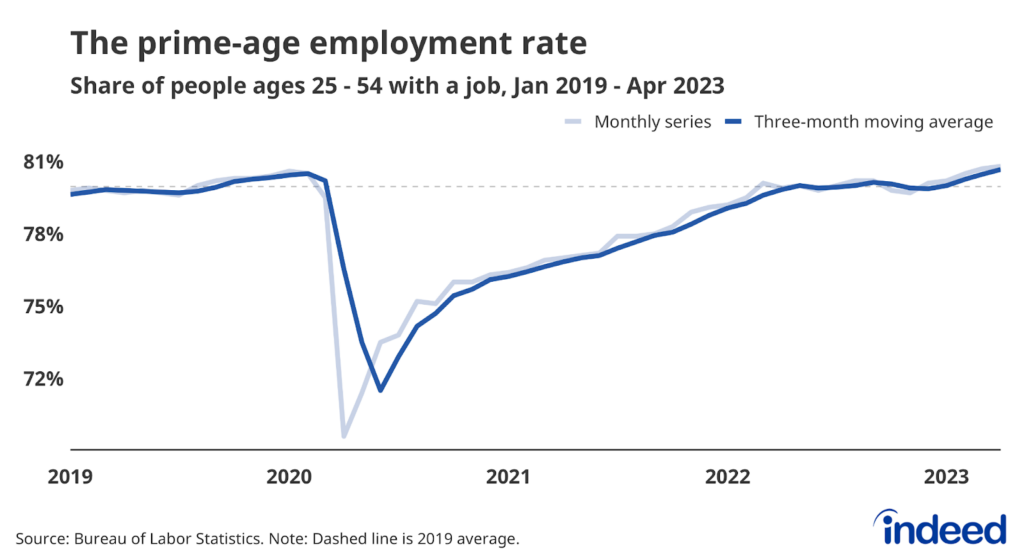
Strong demand has led to robust hiring and more workers finding jobs. The employment-to-population ratio for workers ages 25 to 54, a good measure of the health of the labor market, stood at 80.8% in April. In other words, almost 81% of people in this age group had a job in April — above pre-pandemic levels, though still below the ratio average’s of 81.5% recorded in 2000.
However, due largely to an aging population, the employment rate for all working-age adults was just 60.4% in April, less than the pre-pandemic rate of 61.1%. Many people continue to “unretire,” but a decline in that trend coupled with a rise in workers entering retirement, and the continued aging of the population, all suggest we shouldn’t expect older Americans to be a significant source of employment moving forward.
Quitting is still elevated, and layoffs might be trending up (from a very low level)
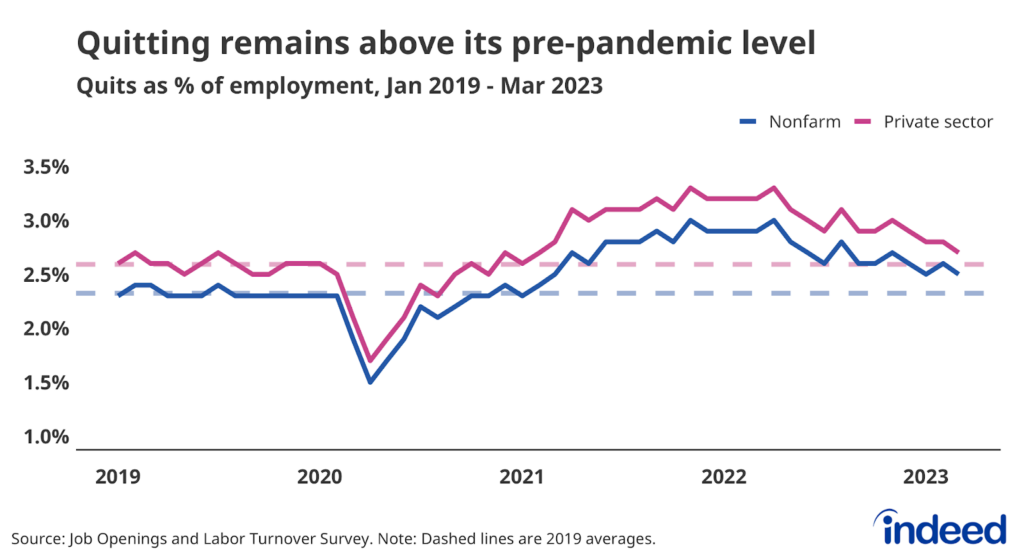
The job-quitting rate fell to 2.5% in March. This is still above the 2019 average of 2.3%, but down 14% year-over-year, and continues to decline slowly, according to federal data. Workers quitting their old jobs and finding new roles is typically a major driver of overall wage gains, so the declining but still-elevated quits rate suggests wage growth will remain robust for some time even as it also trends down.
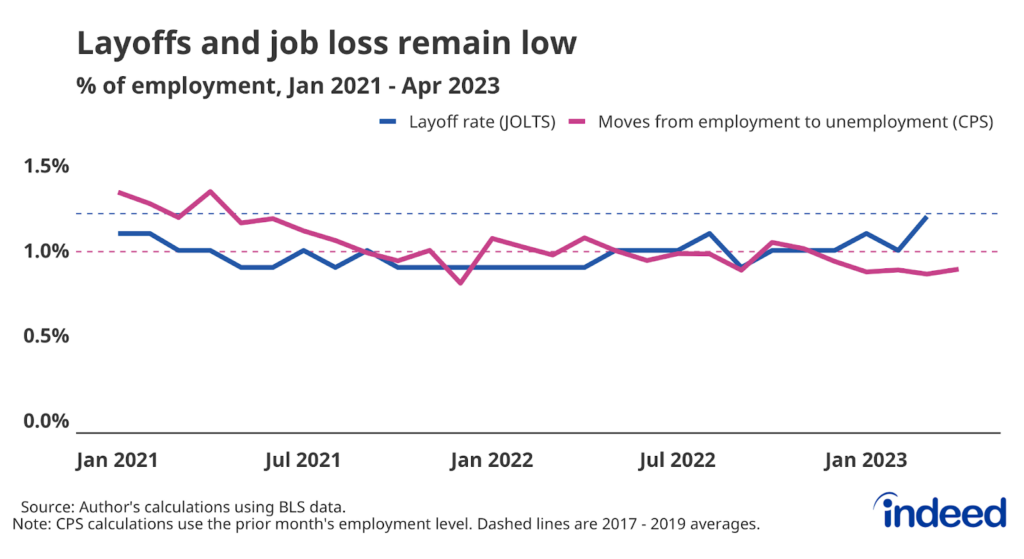
And while workers are voluntarily leaving their jobs at higher rates than during pre-pandemic days, employers are also relatively reluctant to lay them off. The national layoffs and discharge rate rose to 1.2% in March, in line with longer-term, pre-pandemic averages. But almost half of the recorded rise in layoffs between February and March came from the construction industry, a sector particularly sensitive to rising interest rates. Additional data will be needed to confirm if this recent rise is just noise or a signal of broader trends.
Wage growth remains intense
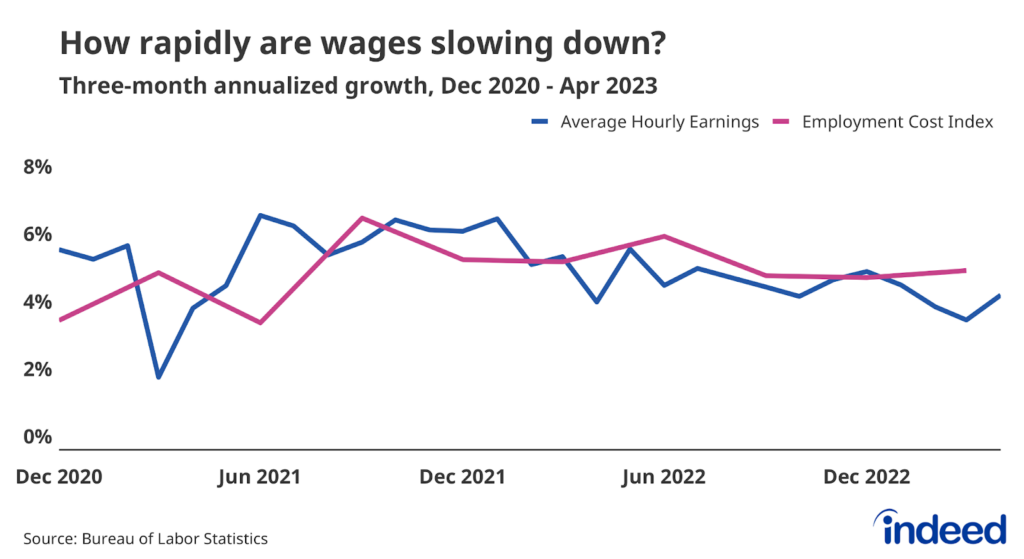
Intense employer competition for new hires across multiple sectors pushed annual wage growth up between 5% and 6% for much of the past few years, a faster growth rate than at any point over the past 20 years. But these data are measuring so-called nominal wage growth — pay gains measured before taking inflation into account.
Several measures of wage growth show that pay increases have started to slow down, though very gradually. The widely-cited Average Hourly Earnings data from the US Bureau of Labor Statistics showed wage growth falling back to immediate pre-pandemic levels. However, more recent data shows wages still have considerable momentum. Older but generally more reliable data from the Q1 Employment Cost Index corroborates this trend.
Methodology
Data on seasonally adjusted Indeed job postings are an index of the number of seasonally adjusted job postings on a given day, using a seven-day trailing average. February 1, 2020, is our pre-pandemic baseline, so the index is set to 100 on that day. We seasonally adjust each series based on historical patterns in 2017, 2018, and 2019. We adopted this methodology in January 2021. Data for several dates in 2021 and 2022 are missing and were interpolated. Non-seasonally adjusted data are calculated in a similar manner except that the data are not adjusted to historical patterns.
The number of job postings on Indeed.com, whether related to paid or unpaid job solicitations, is not indicative of potential revenue or earnings of Indeed, which comprises a significant percentage of the HR Technology segment of its parent company, Recruit Holdings Co., Ltd. Job posting numbers are provided for information purposes only and should not be viewed as an indicator of performance of Indeed or Recruit. Please refer to the Recruit Holdings investor relations website and regulatory filings in Japan for more detailed information on revenue generation by Recruit’s HR Technology segment.
We track summer hiring appetite by tallying Canadian job postings on Indeed that include the term “summer” in the job title, excluding postings with job titles that also include “intern” or “internship”. We track internship postings separately tallying the presence of the latter two terms in job titles. This method doesn’t capture the full extent of seasonal demand but provides a gauge of recent trends and how season postings compare to the prior year.