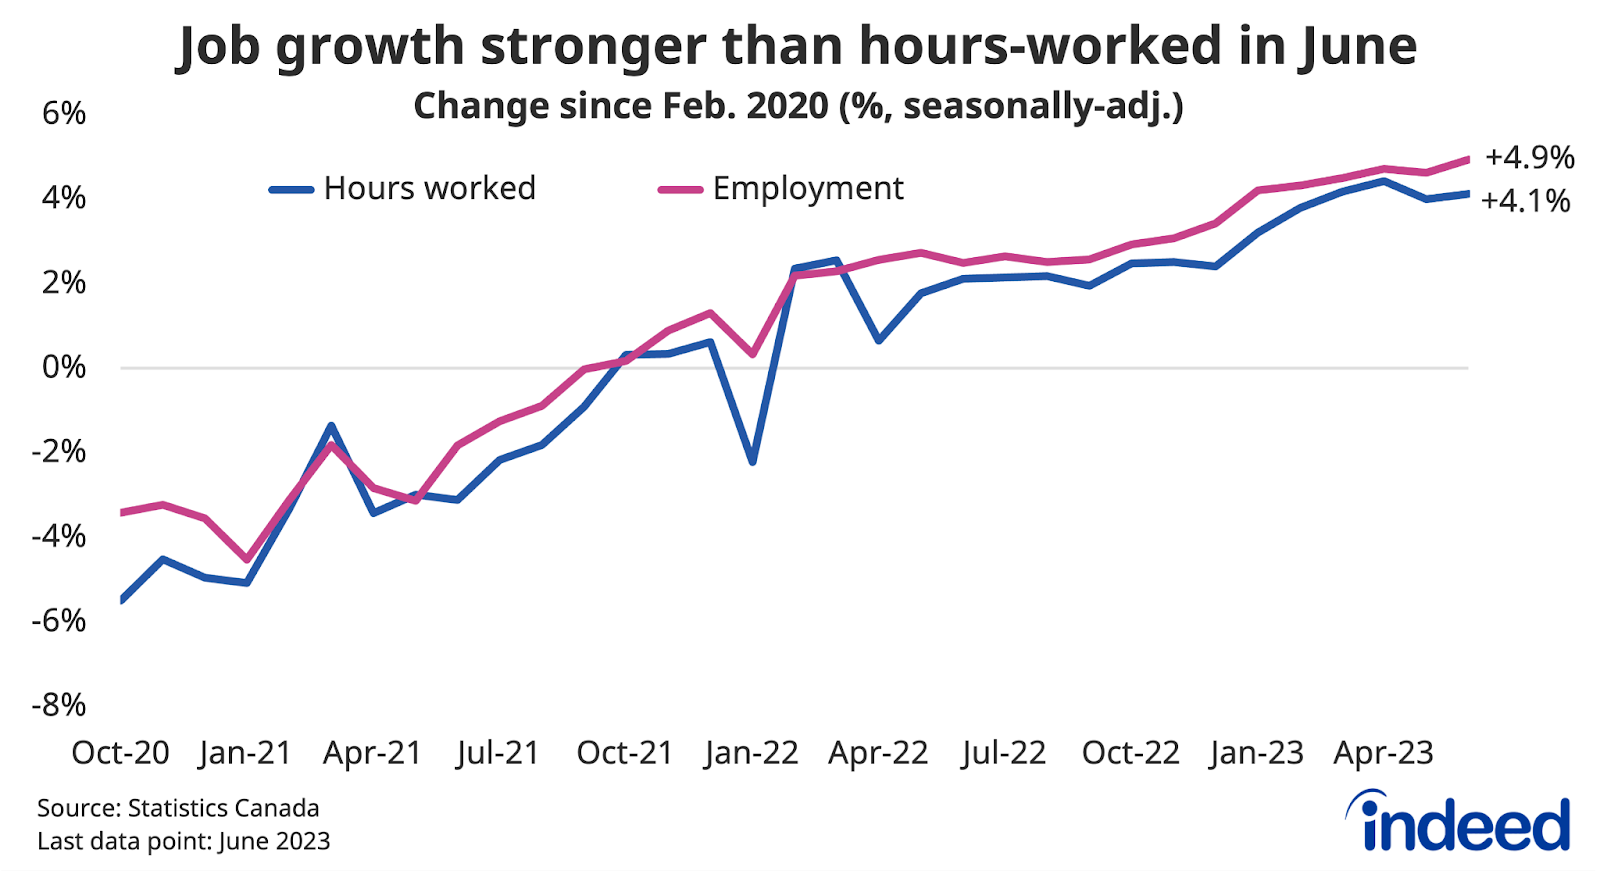
- Employment growth softened in the second quarter after a fast start to 2023, but the labour market remained in strong shape, supported by low layoff rates.
- Job postings continued to slide in the second quarter; down 27% from their mid-2022 peak as of July 14, but still 27% above their pre-pandemic level.
- Wage growth has also eased but remains elevated, up 4.1% in June from a year earlier, matching its May pace, according to the Indeed posted wage tracker.
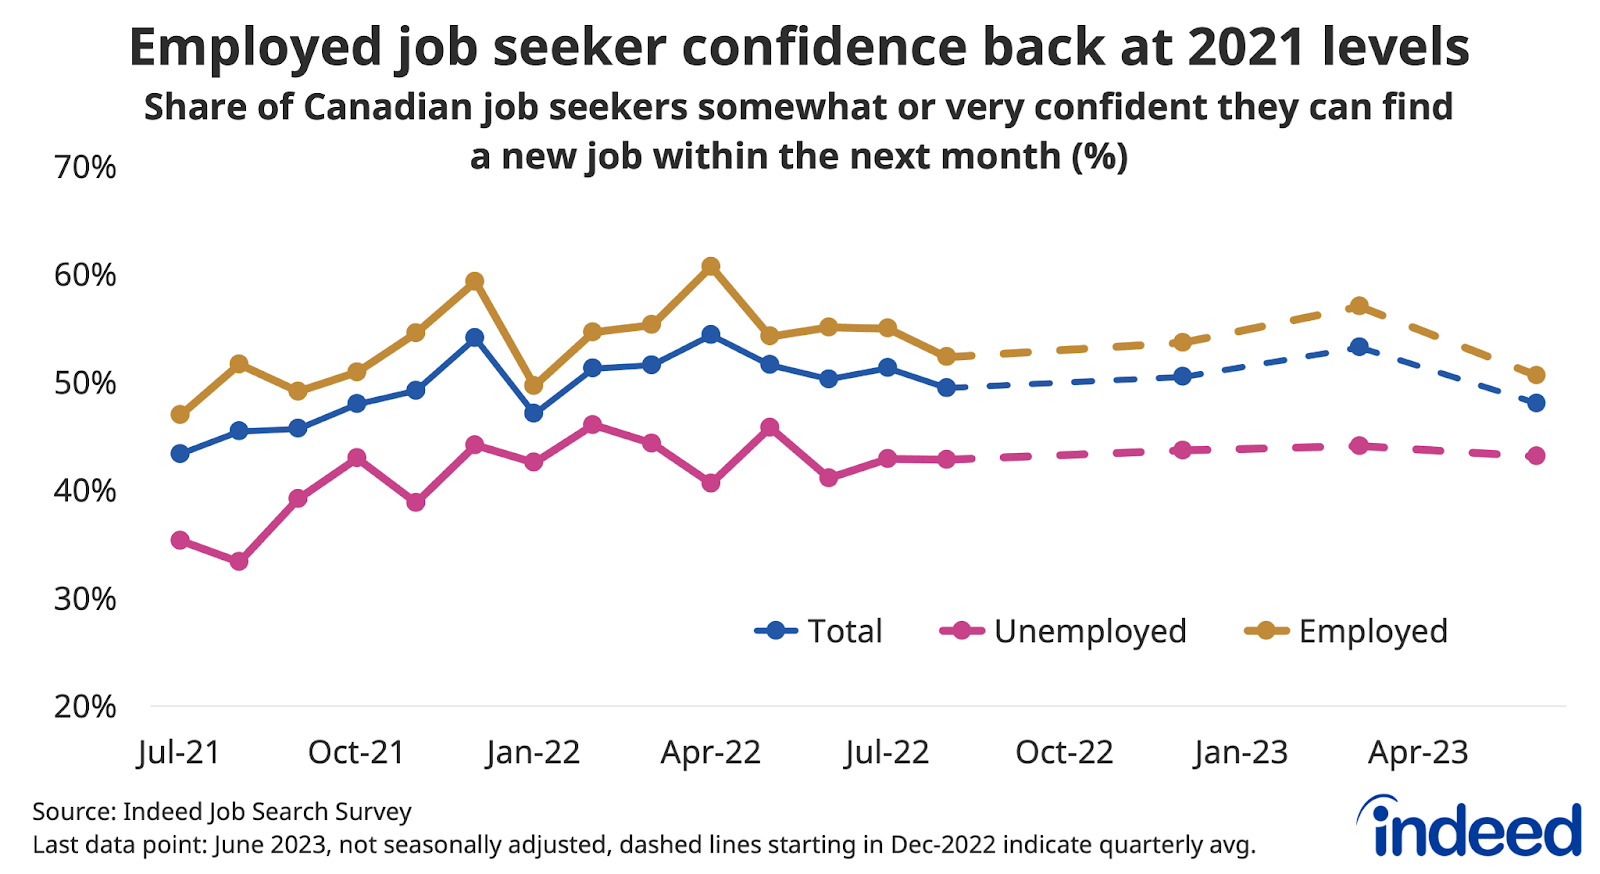
- Canadian job seekers’ confidence in their ability to quickly find work slipped in the second quarter, led by weaker sentiment among those with a university education.
The Canadian labour market shifted down a gear, but held resilient during the second quarter of 2023. Employer hiring appetite continued to ease, but remained elevated, though postings in tech and a few other white-collar fields have slipped below pre-pandemic levels. Meanwhile, the still-tense economic situation appears to have weighed on job seeker optimism, as the economy wades through uncertainty entering the second half of the year.
Momentum back in neutral, but no turning point yet
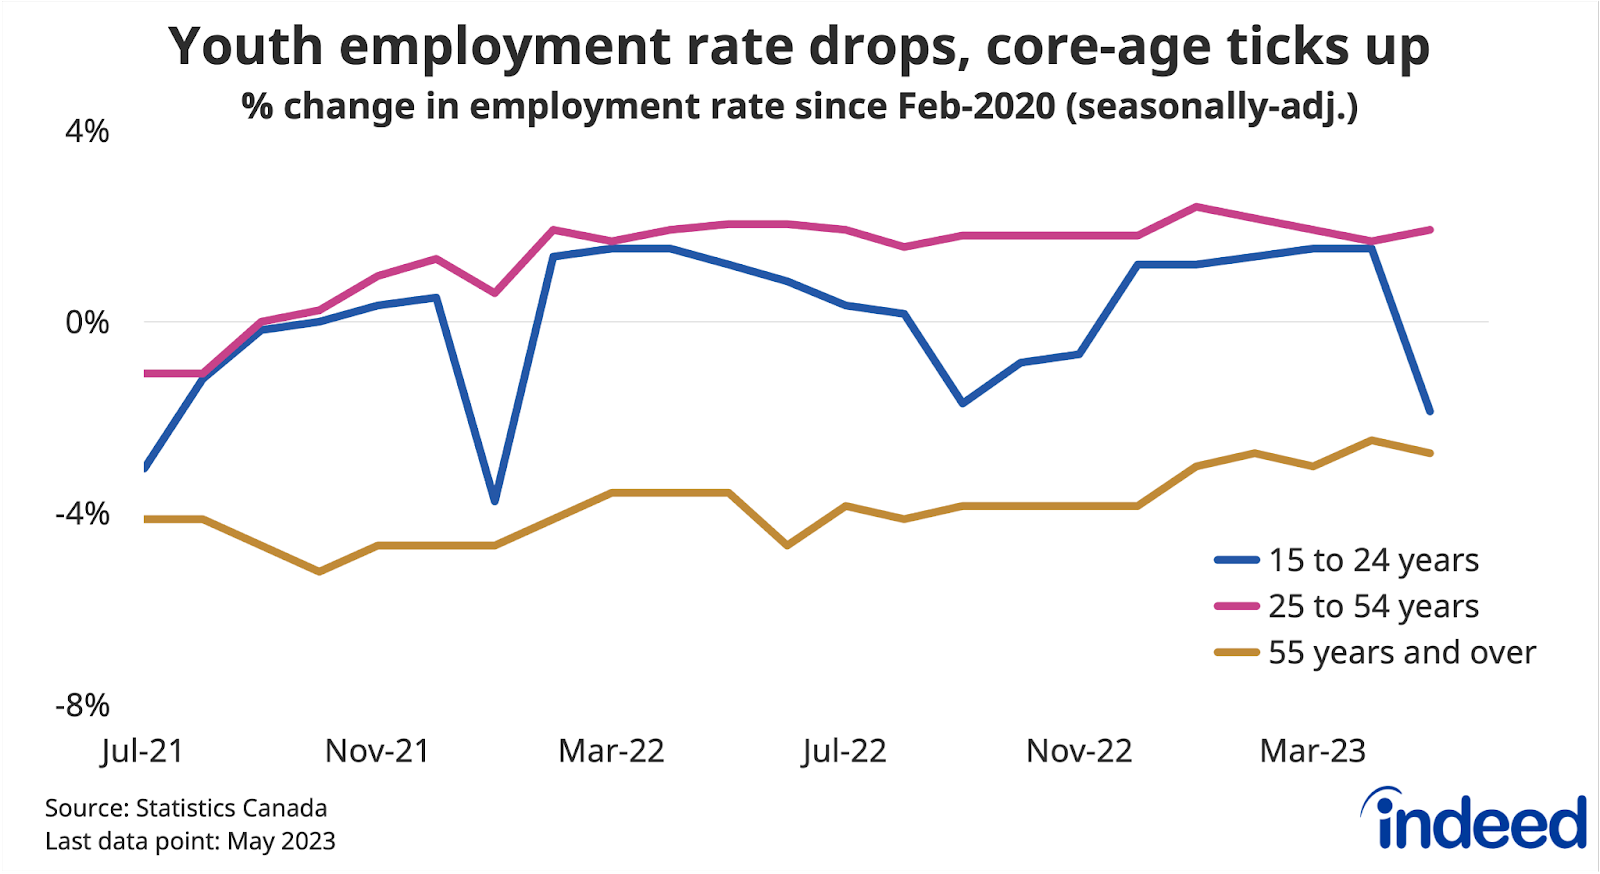
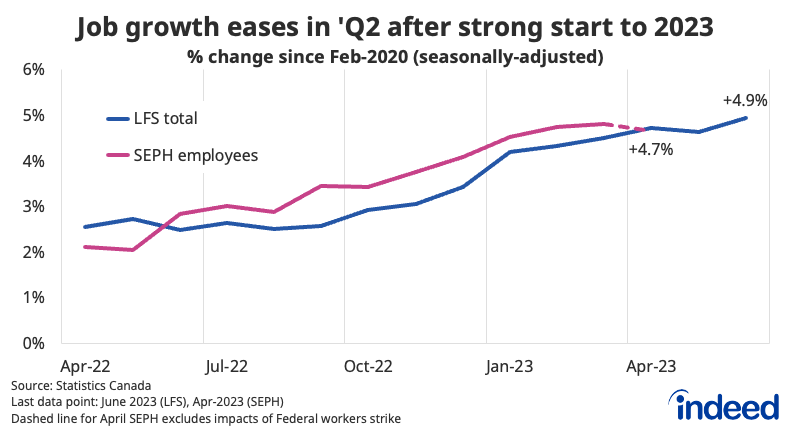
Canadian job growth started 2023 off with a bang but shifted back to neutral in the second quarter. Gains in the Labour Force Survey (LFS) were choppy, including a decline in May led by a weak start to youth summer employment, while payrolls in the Survey of Employment, Payrolls, and Hours (SEPH) slipped in April. That said, taken together with a surprisingly strong first quarter, the job market did fairly well in the first half of the year.
Canada’s surging population has raised the bar on what constitutes a “good” month, making assessing recent job growth more complicated. While June’s 60,000 employment gain would’ve been considered a blowout LFS release in prior years, it is less impressive today, as the breakeven employment number needed to keep pace with population growth stood at 52,000.
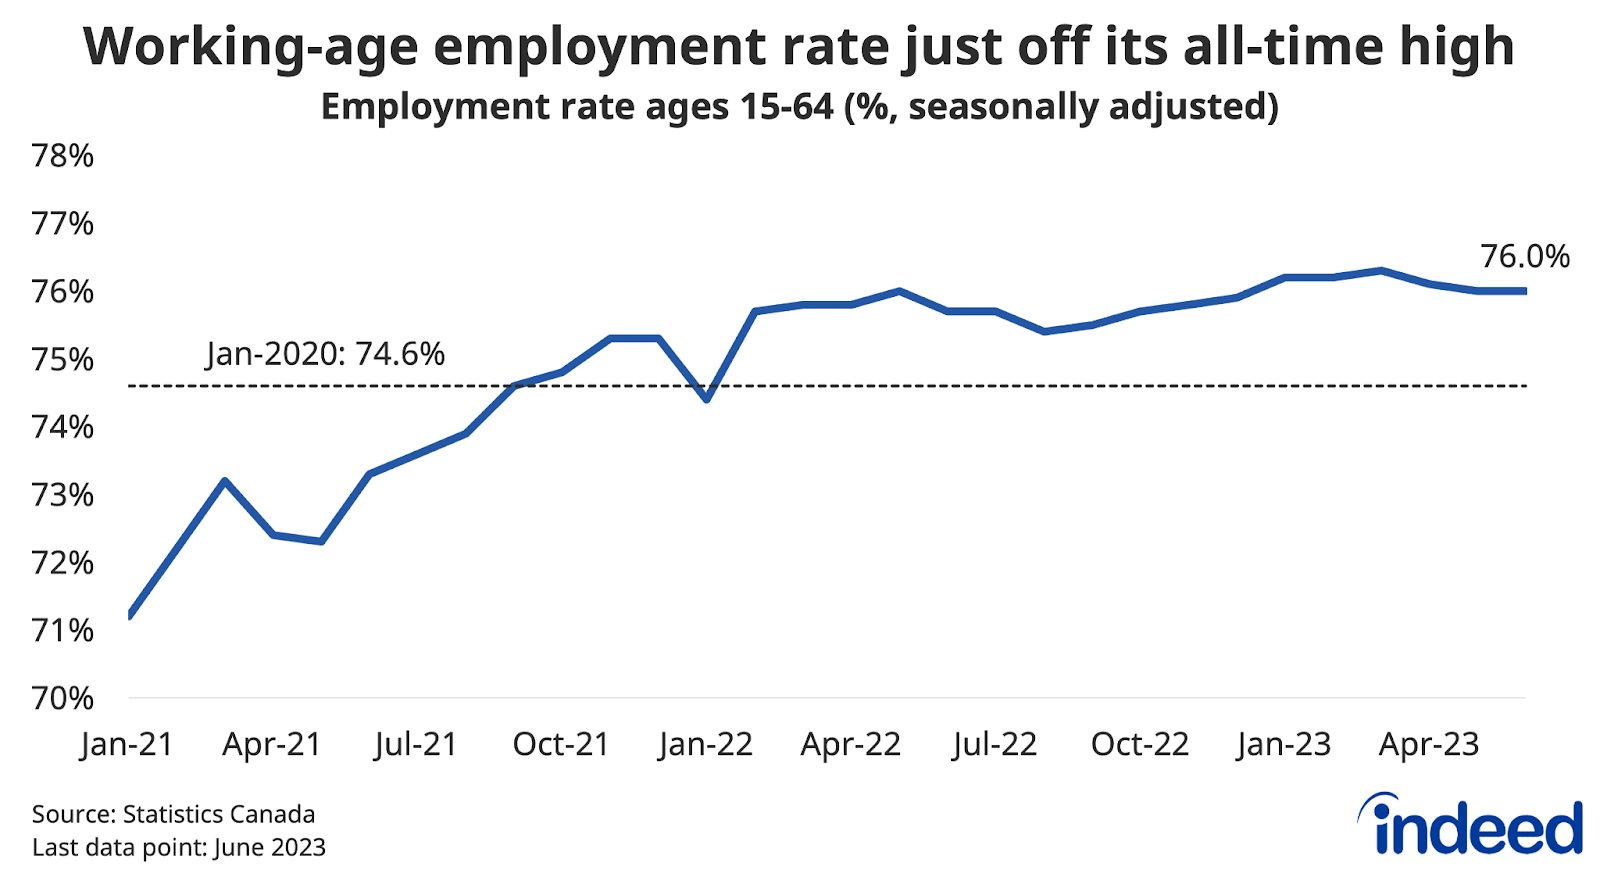
In this regard, it’s helpful to track employment and unemployment rates, which are less influenced by population growth. Both suggest momentum cooled somewhat in the second quarter, but that the overall labour market remained strong. The unemployment rate ticked up by 0.2 percentage points in both May and June to a still-low 5.4%, though the June increase reflected a rise in labour force participation. Meanwhile, the working-age (15-64) employment rate edged down 0.3 percentage points between March and June, but at 76.0% still matched its all-time high prior to this year.
Professional and technical services run out of gas
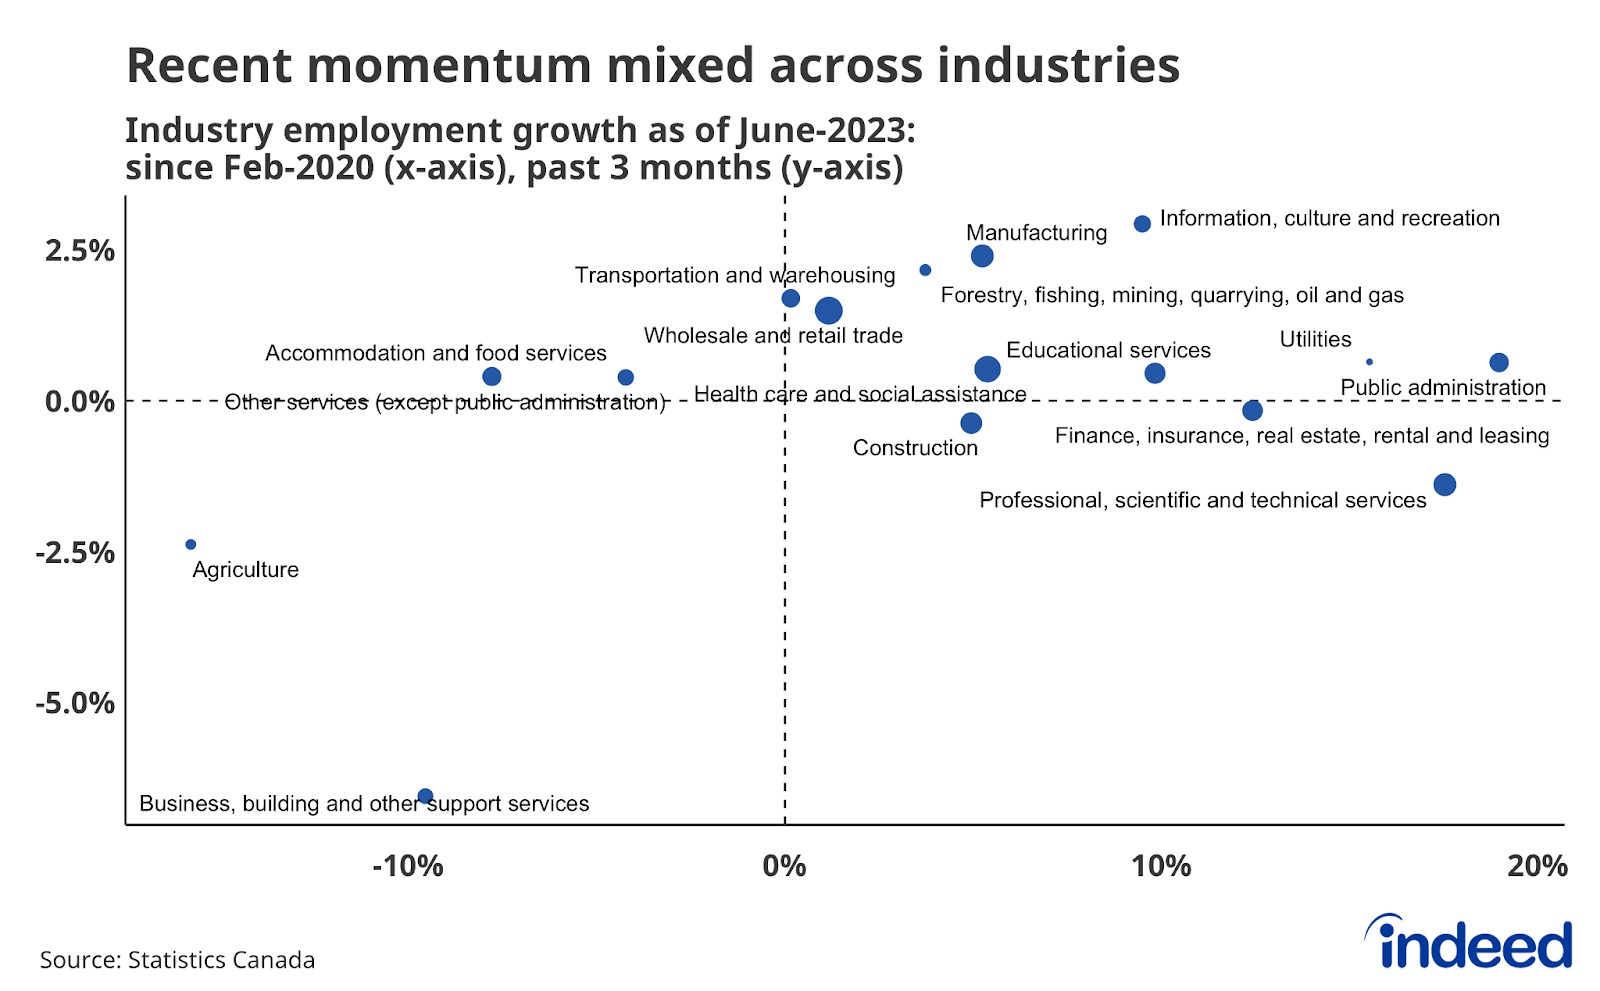
With overall employment growth running at a more neutral pace in Q2, trends were mixed across different industries. Most notable — outside a drop in the volatile business and building services category — were recent soft numbers in professional, scientific, and technical services.
Professional services, encompassing tech and other white-collar fields including legal services and accounting, was Canada’s fastest-growing industry (compared to pre-pandemic levels) through the start of 2023, outpacing a similarly large expansion in government employment. However, momentum in the sector has dropped off, with modest employment declines in each of the past three months through June, falling hiring appetite now causing a drag after an earlier boom. Stronger job growth in information and culture, manufacturing, as well as transportation and warehousing, among others, has helped offset this weakness.
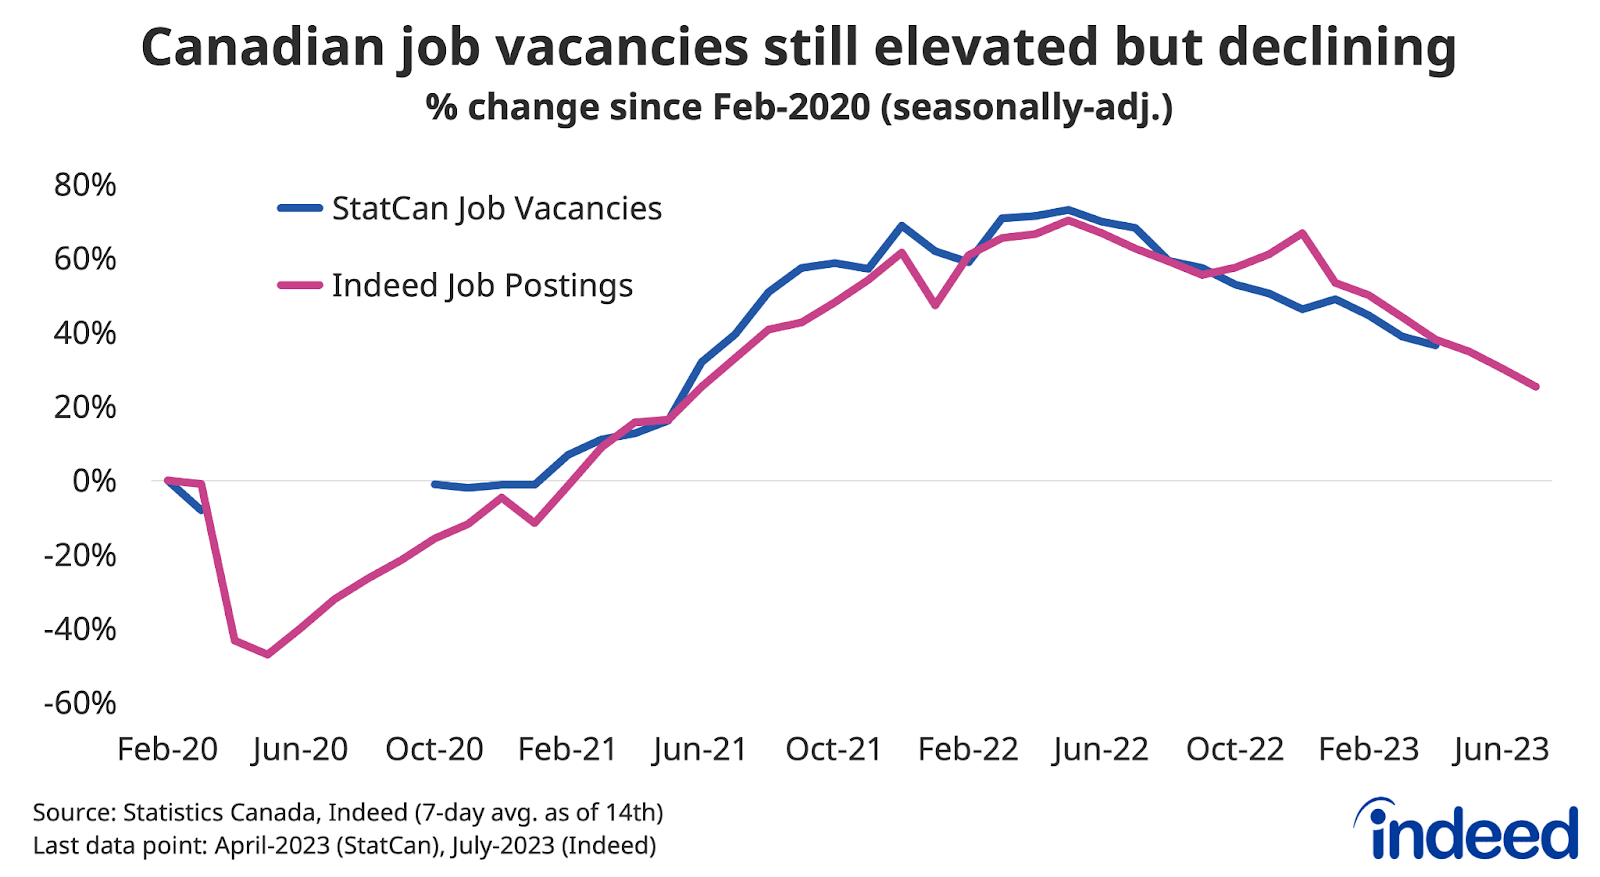
Job postings continue to cool
Job growth might have shifted gears in recent months, but one trend that’s held steady is the gradual decline in employer recruiting activity from its earlier highs. As of July 14, total Canadian job postings on Indeed were down 27% from their early May 2022 peak. Because that earlier peak was so high, postings remain elevated compared to pre-pandemic levels, up 27%. Trends look quite similar in Statistics Canada’s job vacancy data, which run through April.
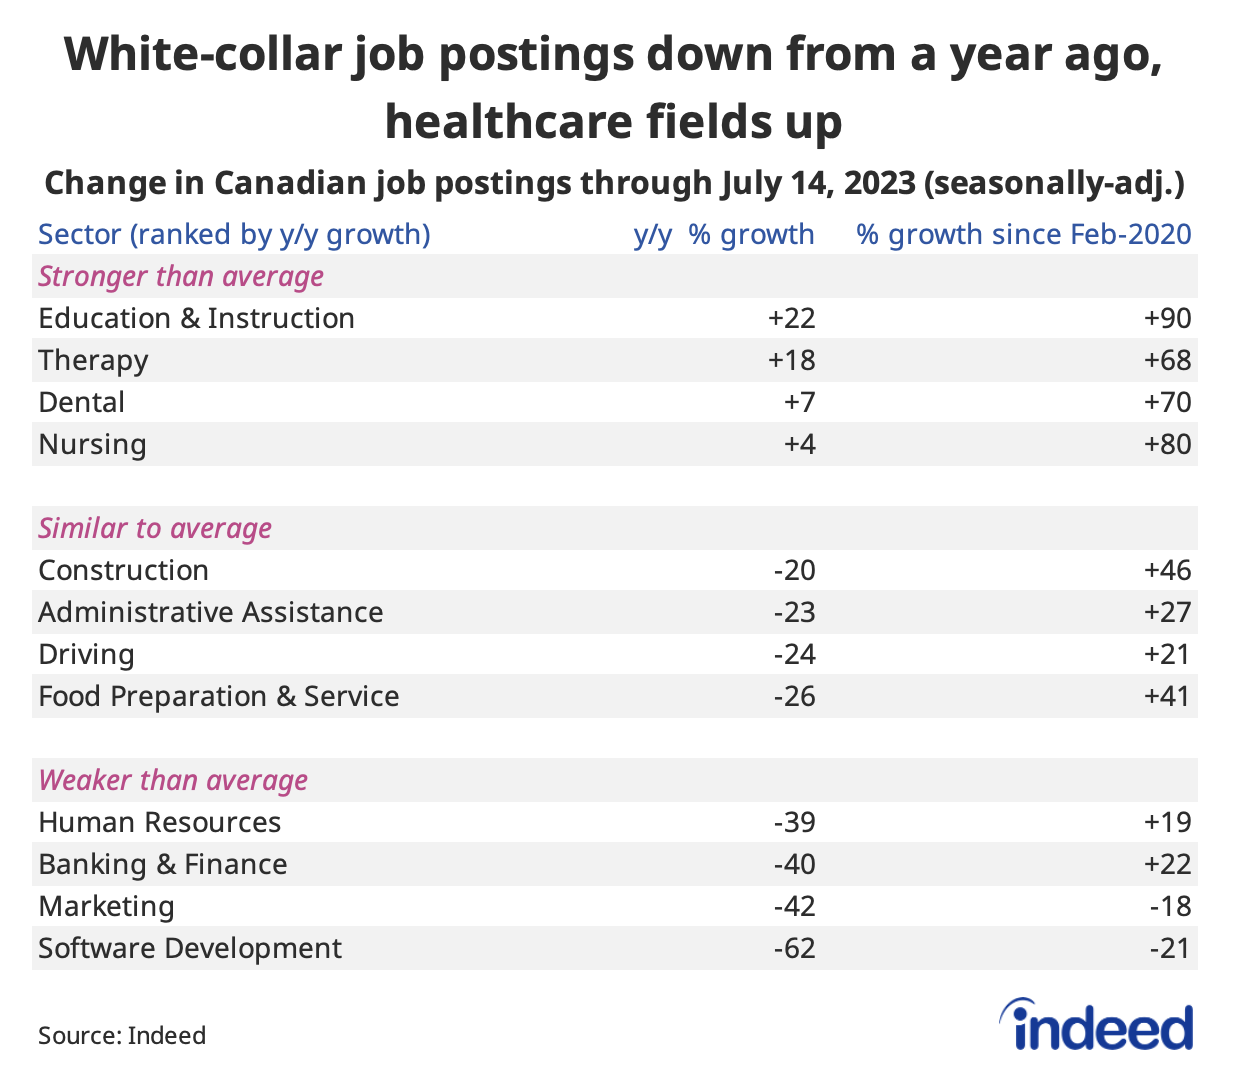
The decline in Canadian job postings over the past year has been broad-based, with several patterns worth noting. First, postings in several white-collar occupations including tech and marketing have dropped faster than others (the former from exceptionally high levels), to the point where postings in these fields are now below their pre-pandemic levels. In contrast, while demand has cooled in a majority of sectors — spanning food services, driving, administrative assistance, and construction, among others — it has not fallen as dramatically. And a handful of sectors, namely in healthcare and education, have bucked the economy-wide trend and are actually up from a year earlier.
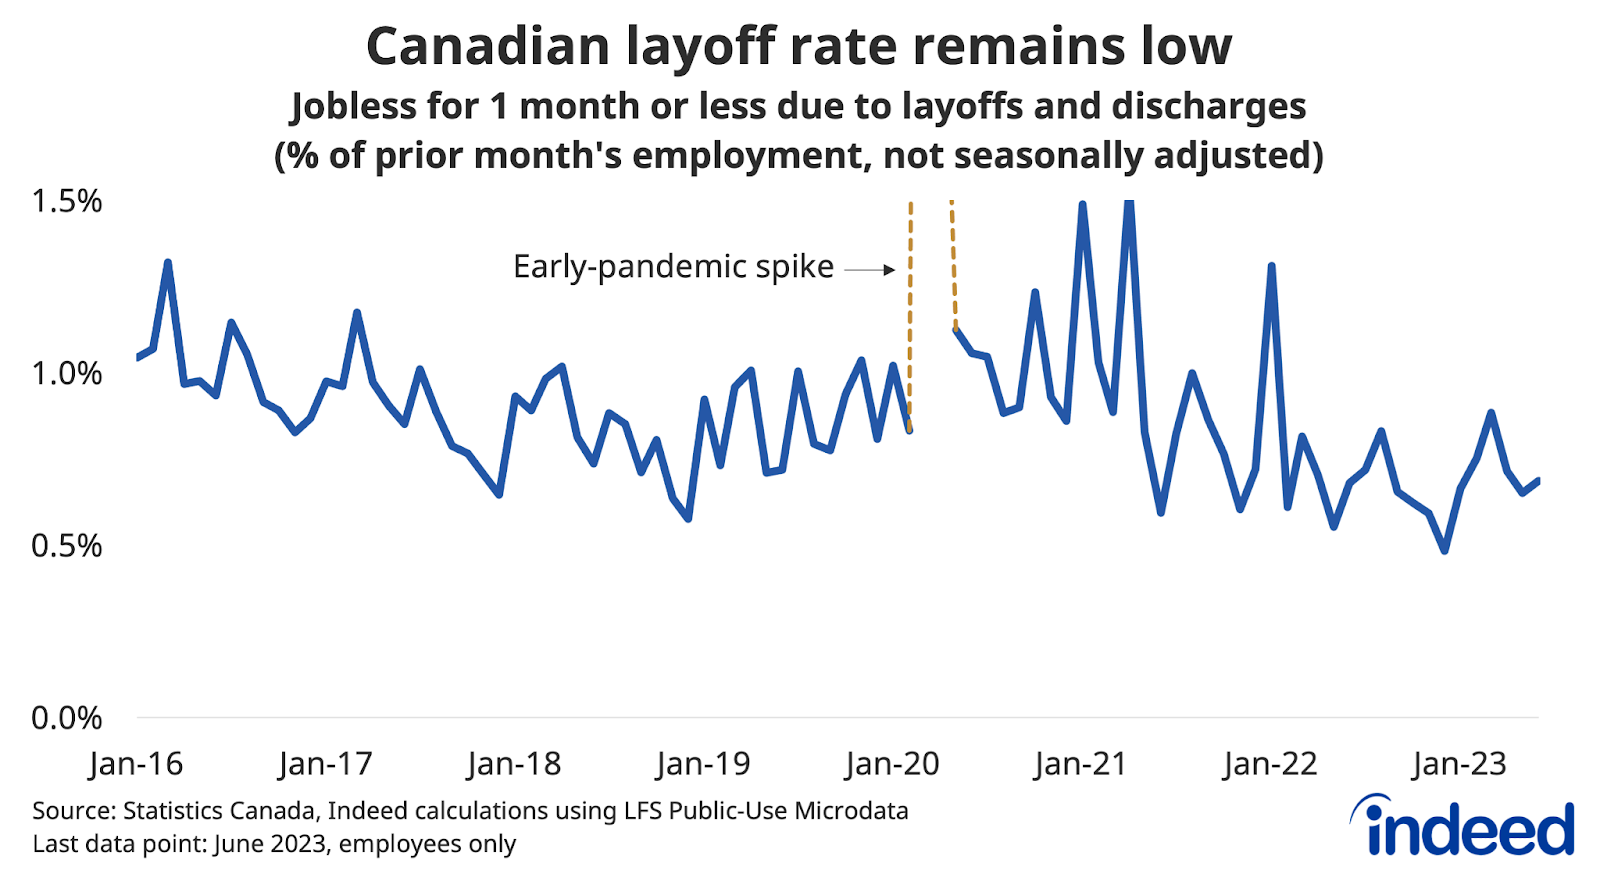
Low layoffs continue to support employment
Recruiting activity might be down, but so far employers have generally opted to ride out the uncertain environment at current staffing levels. The number of people out of work who were laid off or discharged the prior month averaged 6.8 per thousand employees in the second quarter, similar to a year earlier, and still below the 2017-2019, pre-pandemic range of 8.1 to 9.1. Layoff rates were at or below their pre-pandemic levels across most of the economy, including accommodation and food services as well as historically cyclical industries like manufacturing and construction. New jobs aren’t being created at rapid rates, but with relatively few people falling out of work, net employment has remained in positive territory.
Wage growth elevated, but starting to slow
Cooler hiring appetite is beginning to show up in slower wage growth. After adjusting for changes in job-mix, average hourly earnings in the LFS were up 3.9% year-over-year in June, down from 5.4% in March, their slowest pace over the past 12 months, though still elevated by historical standards. LFS wage growth has cooled most in industries where it was running especially hot, including professional services, accommodation and food, and transportation and warehousing. Pay growth has also eased from early 2022 according to SEPH’s fixed-weight index, averaging 3.8% year-over-year growth over the three months through April.
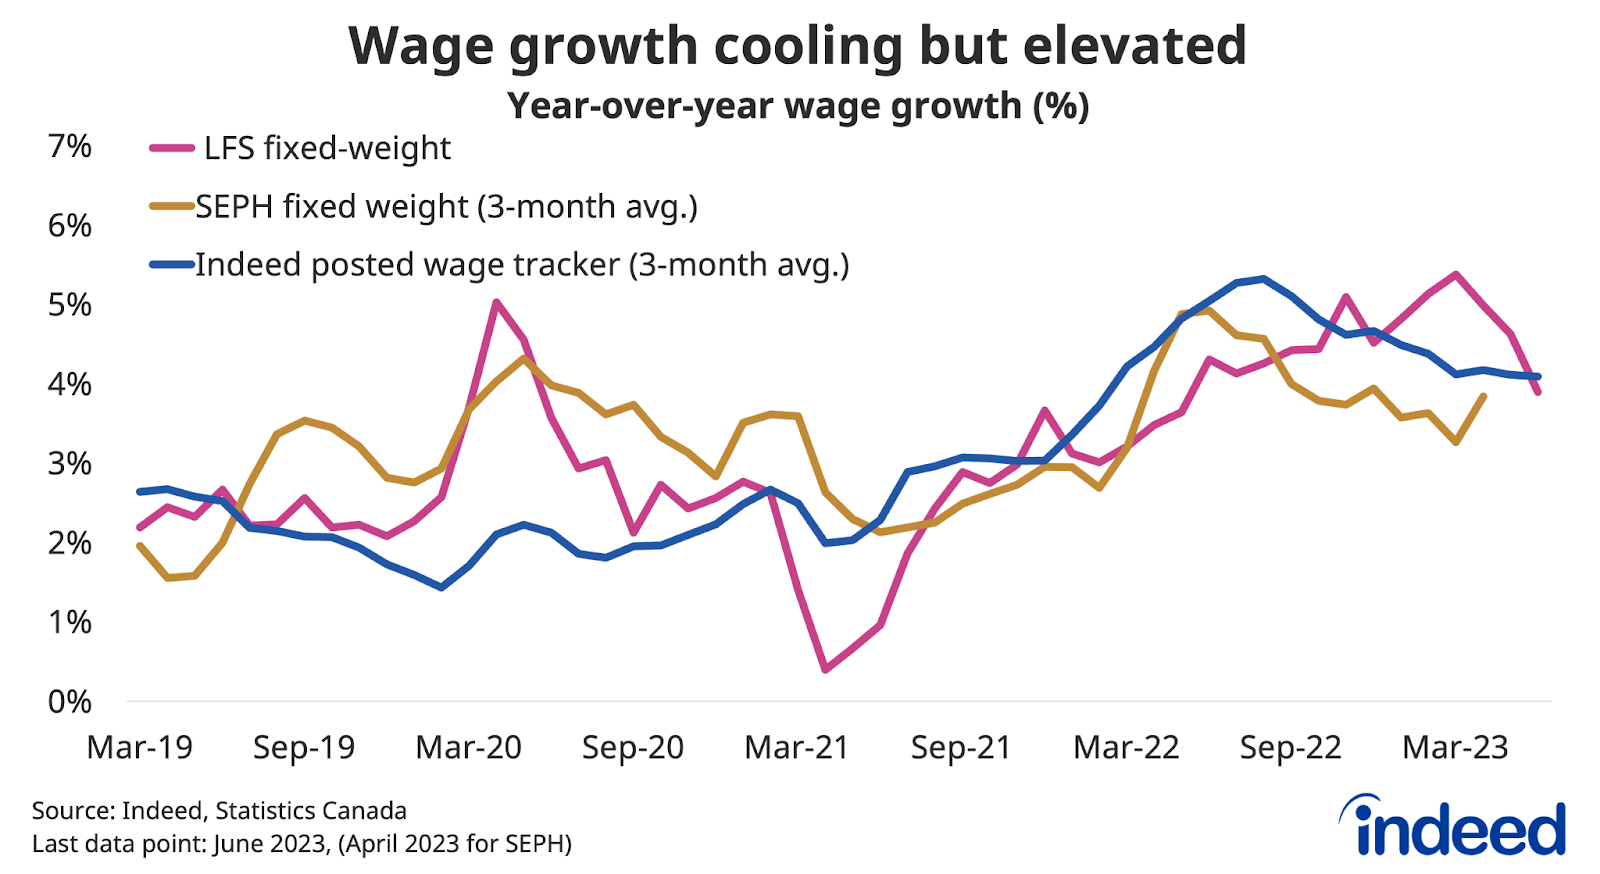
Data from the Indeed Wage Tracker, which measures growth of advertised wages and salaries on Indeed job postings, shows similar trends. Posted wage growth peaked at 5.3% in mid-2022, before easing to a 4.1% pace in the first quarter of 2023, where it has held steady through June. Posted wage growth has cooled across most categories, but has held steadier among lower-paying sectors including customer and food services, helping keep the overall trend elevated.
Overall, falling job vacancies have likely influenced the turn in wage growth in recent quarters. Another potential factor is that with both headline inflation and business inflation expectations easing over the past year, companies might be planning for less substantial cost-of-living adjustments going forward. Inflation swept past wage growth when prices were on the upswing, now the question is whether wages can catch up from earlier losses.
Job seeker confidence slips
Some job seekers are noticing that opportunities aren’t as plentiful as they were earlier in the recovery. According to the second quarter Indeed Job Seeker Survey, 48% of active Canadian job seekers were at least somewhat confident they could find work quickly, down from 53% in Q1, the lowest quarterly reading since 2021. Most of the drop-off in confidence was among employed job seekers, especially those with university education, while sentiment among those unemployed was steadier, though at a lower level.
Both the labour market and the broader global economy have navigated central banks’ tightening cycles relatively well so far, but the situation remains tense. It is still a job seeker’s market, but hiring conditions aren’t as tight as they were and in some white-collar fields they’re no longer particularly tight at all. The question for the labour market heading into the second half of the year is whether the broader economy can remain above water as it treads through what could be a softer period of growth.
Methodology
All job postings figures in this blog post are the index of seasonally-adjusted Canadian job postings on Indeed re-based to February 1, 2020, using a seven-day trailing average. February 1, 2020, is our pre-pandemic baseline. We seasonally adjust each series based on historical patterns in 2017, 2018, and 2019. Each series, including the national trend, occupational sectors, and sub-national geographies, is seasonally adjusted separately. This week, we applied our quarterly revision, which updates seasonal factors and fixes data anomalies. Historical numbers have been revised and may differ from originally reported values. New job postings are posts that are seven days old or less.
The number of job postings on Indeed, whether related to paid or unpaid job solicitations, is not indicative of potential revenue or earnings of Indeed, which comprises a significant percentage of the HR Technology segment of its parent company, Recruit Holdings Co., Ltd. Job posting numbers are provided for information purposes only and should not be viewed as an indicator of performance of Indeed or Recruit. Please refer to the Recruit Holdings investor relations website and regulatory filings in Japan for more detailed information on revenue generation by Recruit’s HR Technology segment.
To calculate fixed-weight wage growth in the LFS, we bucket LFS microdata for each of the 43 occupation groups into three levels of job tenure (6 months or less, 7 to 24 months, and 25 months and over), and recalculate headline average wages into a composition-adjusted measure by holding their respective weights constant at February 2020 levels.