This is the first installment of the Indeed Wage Tracker for Canada, a recurring monthly series tracking changes in advertised wages and salaries in Canadian job postings on Indeed, Canada’s leading hiring platform (see methodology). Posted wages on job ads complement traditional wage measures by providing an immediate snapshot of employer hiring intentions and job seeker interest. Average offered wages reported quarterly by Statistics Canada’s Job Vacancy and Wage Survey are most similar to this Indeed data. The two metrics have followed similar paths recently, but the Indeed data is more timely.
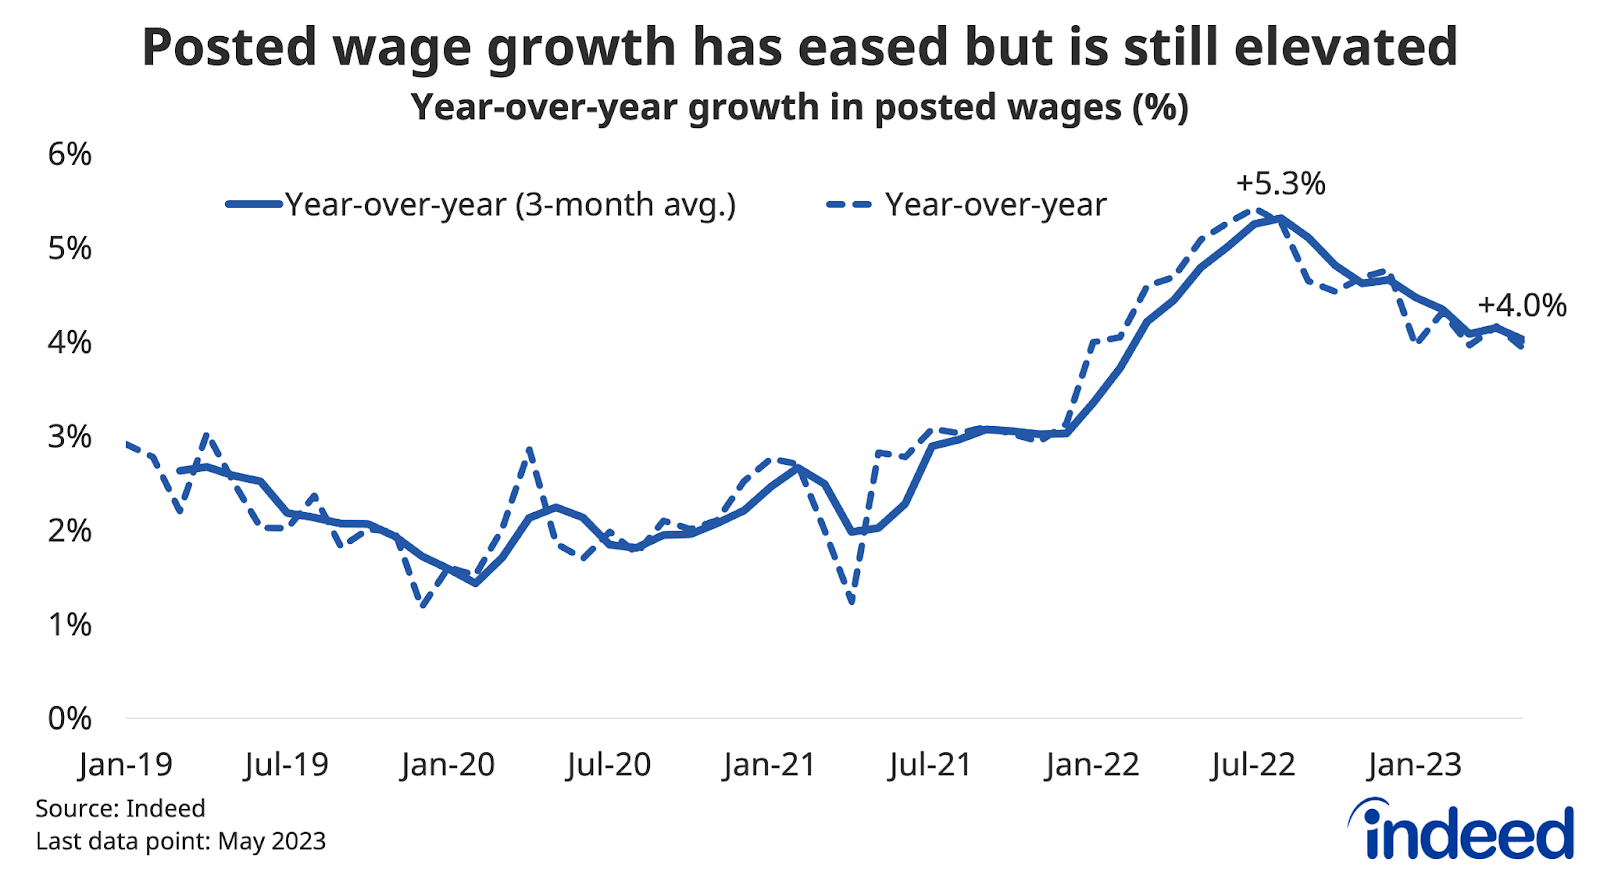
- After accelerating in the first half of 2022, posted wage growth on Canadian job postings has cooled somewhat, running at a still-solid 4.0% year-over-year pace in May 2023, though down from 5.3% growth in August 2022.
- Since the start of the pandemic, advertised pay has grown faster among low- and mid-paying job types, mainly led by occupations for which hiring conditions have grown relatively tighter, such as loading and stocking, construction, and manufacturing.
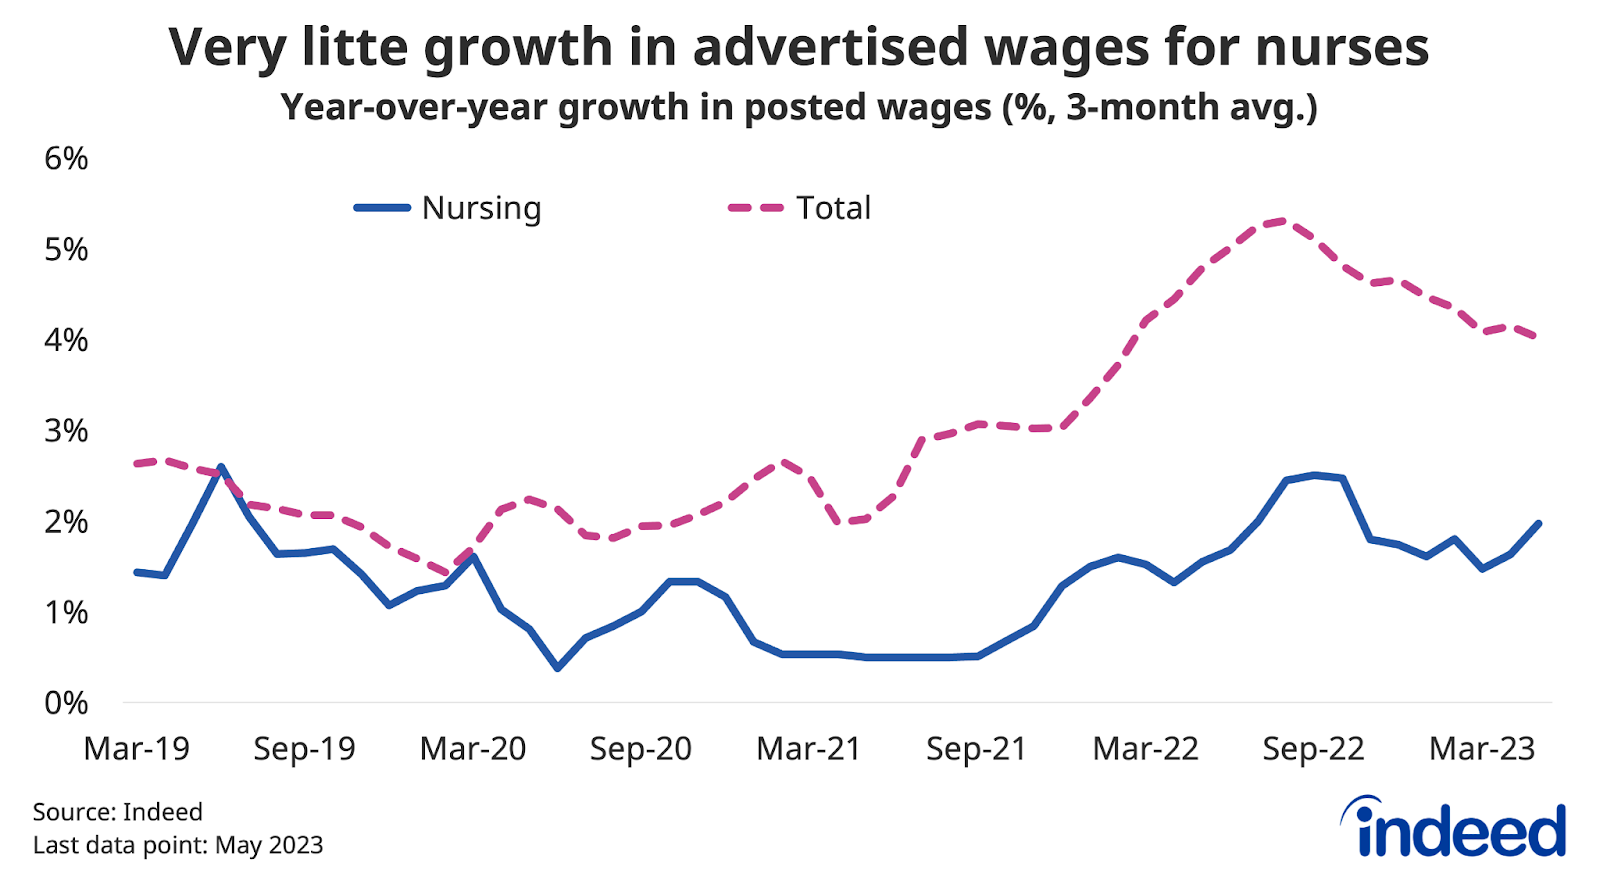
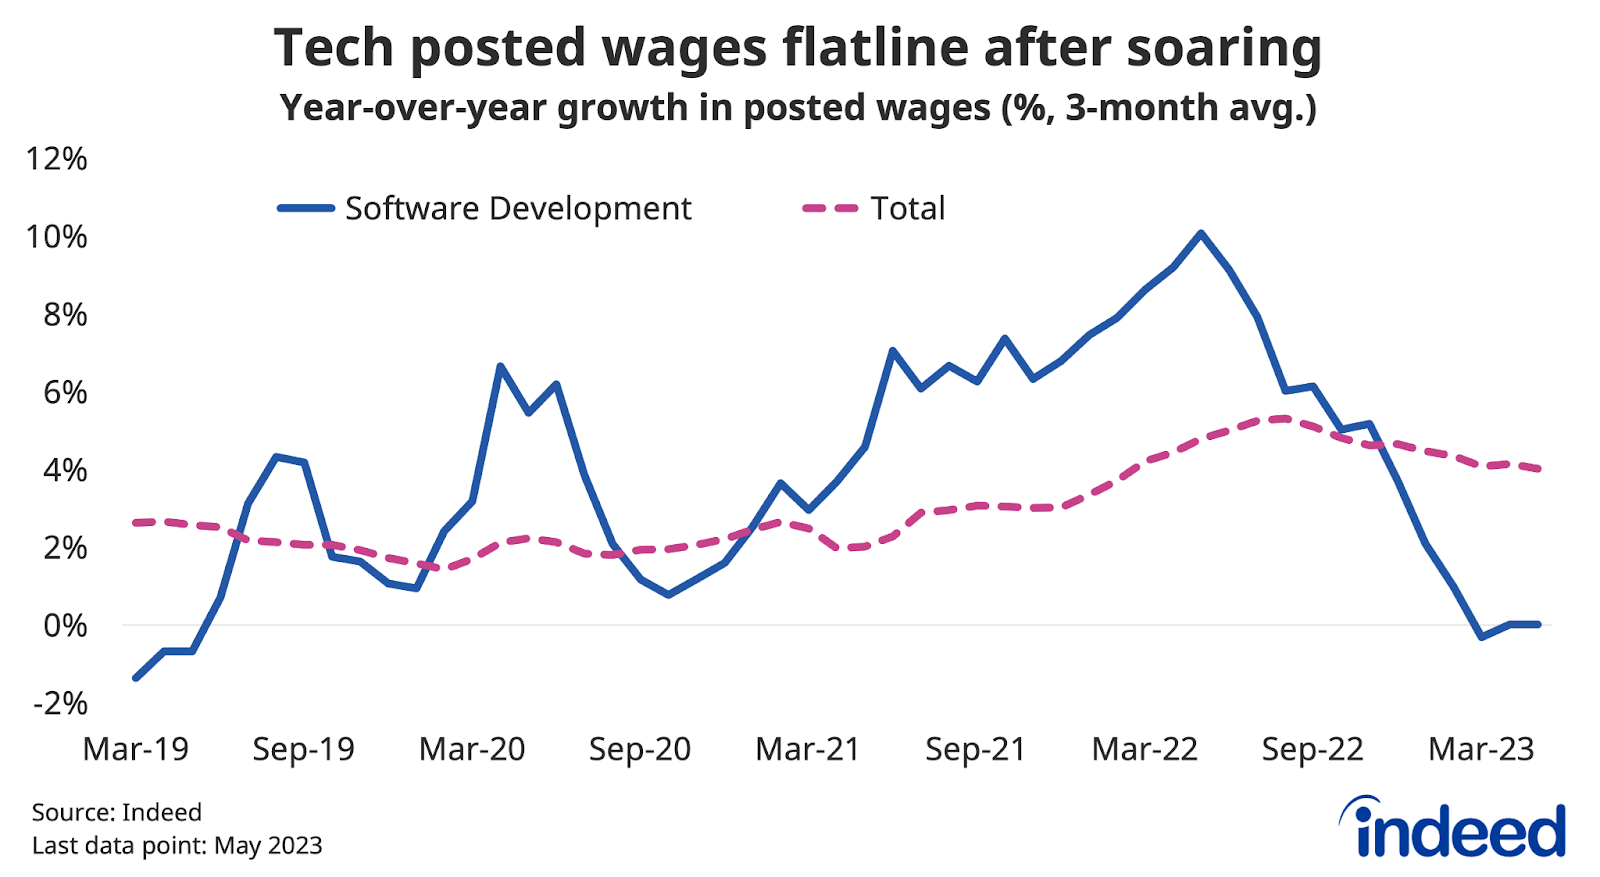
- Among high-wage jobs, posted pay in software development soared through mid-2022, but has flatlined since, while growth has been sluggish in nursing and other healthcare fields.
- The deceleration of posted wage growth suggests hiring is becoming easier for some employers, though the situation hasn’t fully normalized. If the deceleration continues, wage pressure on inflation could ease, but worker purchasing power might rebound more slowly after getting hit by high inflation.
It wasn’t until well into Canada’s pandemic labour market rebound that wage growth started to gather steam. But, by mid-2022, average hourly earnings in the Labour Force Survey (LFS) were rising at a brisk pace of around 5% year-over-year. However, total Canadian job postings on Indeed have cooled in recent months and there are signs wage growth could slow too.
Growth of wages and salaries advertised in Canadian job postings on Indeed started to accelerate in mid-2021, rising from a relatively subdued 2.3% year-over-year pace during the first half of 2021 to 3% by the end of the year. Wage growth shifted upward further in early 2022, topping out at 5.3% year-over-year in July and August. That trend has moderated somewhat since, but is still running at a solid 4.0% pace over the three months through May 2023.
Lower-paying job types have shown the strongest posted wage growth
Advertised pay has evolved differently in various segments of the job market. Posted wages of lower-paying occupations were rising faster than others in early 2021, but were soon joined by mid-paying job types, whose wage growth accelerated quickly midway through the year. Both were growing above a 5% year-over-year pace by the summer of 2022. Posted pay growth of high-wage occupations took a bit longer to ramp up, but by mid-2022 was also running at a solid rate, though slower than lower-paying positions.
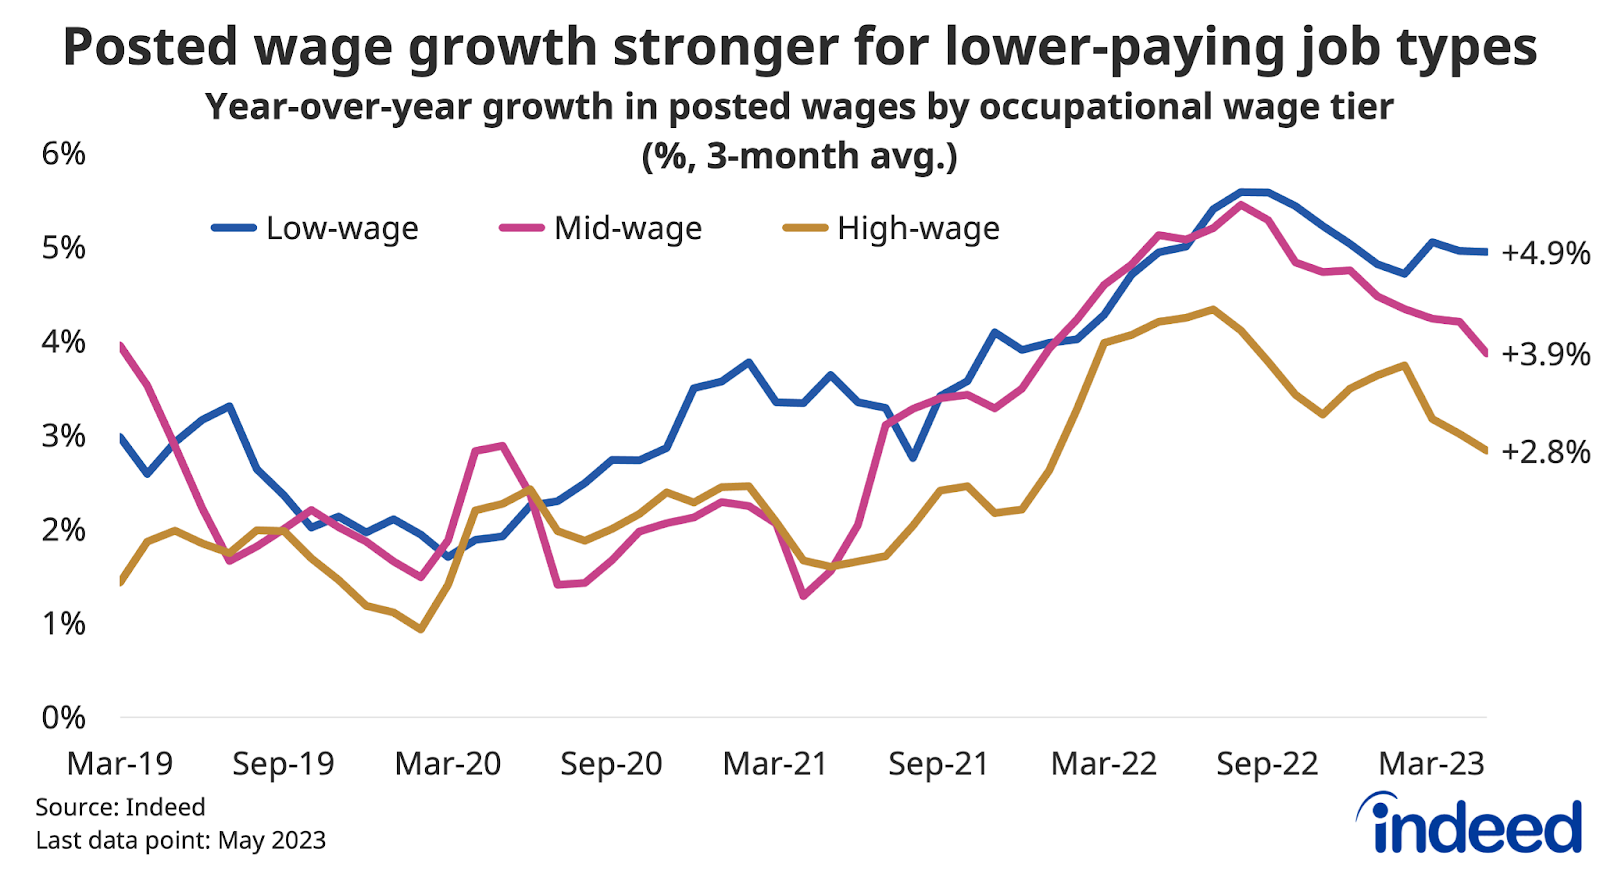
Growth of advertised salaries has since decelerated across wage tiers, but to different degrees. High-wage pay growth continued to grow slowest, standing at 2.8% year-over-year in May. Posted wage growth for mid-wage occupations has also cooled quickly to 3.9%, while growth for lower-paying occupations had held up relatively well at 4.9%.
Changing supply-demand balance is driving variation in posted wage growth
The latest pay growth across wage tiers fits with recent trends in Canadian job postings on Indeed. Demand for labour in high-wage occupations has softened somewhat more than for other tiers over the past year. More generally, posted wage growth in individual occupational sectors has tended to be stronger among jobs in which hiring conditions have become relatively tighter since the start of the pandemic. Those primarily have been low- and mid-paying positions that are generally performed in-person rather than remotely.
Four of the five occupations whose posted year-over-year wage growth averaged above 6.0% throughout 2022 had experienced declines in relative job seeker interest since early 2020. That is, these occupations had lost ground in clicks-per-posting relative to the economy-wide average. They included fields like loading and stocking, production and manufacturing, and construction.
Conversely, among the sectors in which average posted wage growth was under 4% in 2022, all but one experienced increases in relative job seeker interest from pre-pandemic levels.
Posted wage growth was especially weak in a range of healthcare and social assistance fields, most notably nursing. Despite long-standing hiring difficulties, advertised pay in the field has increased at subdued rates throughout the pandemic. In May 2023, it was up just 2.0% from a year earlier, far below wage growth in most of the economy.
Waning tech boom apparent in posted salaries
Job postings in software development had been an exception to the pattern of weaker posted wage growth in occupations with stronger relative job seeker interest. As tech job postings surged in 2021 and 2022, posted salaries soared, with growth peaking at 10.1% year-over-year in May 2022. Software development job postings have dropped sharply since, and with it, advertised wage growth, which in May stood unchanged from a year earlier. Tech industry payrolls have held relatively steady during the sector’s recent turmoil, but weaker hiring appetite is probably hitting the salaries of new hires.
Cooler posted wage growth could translate to paychecks
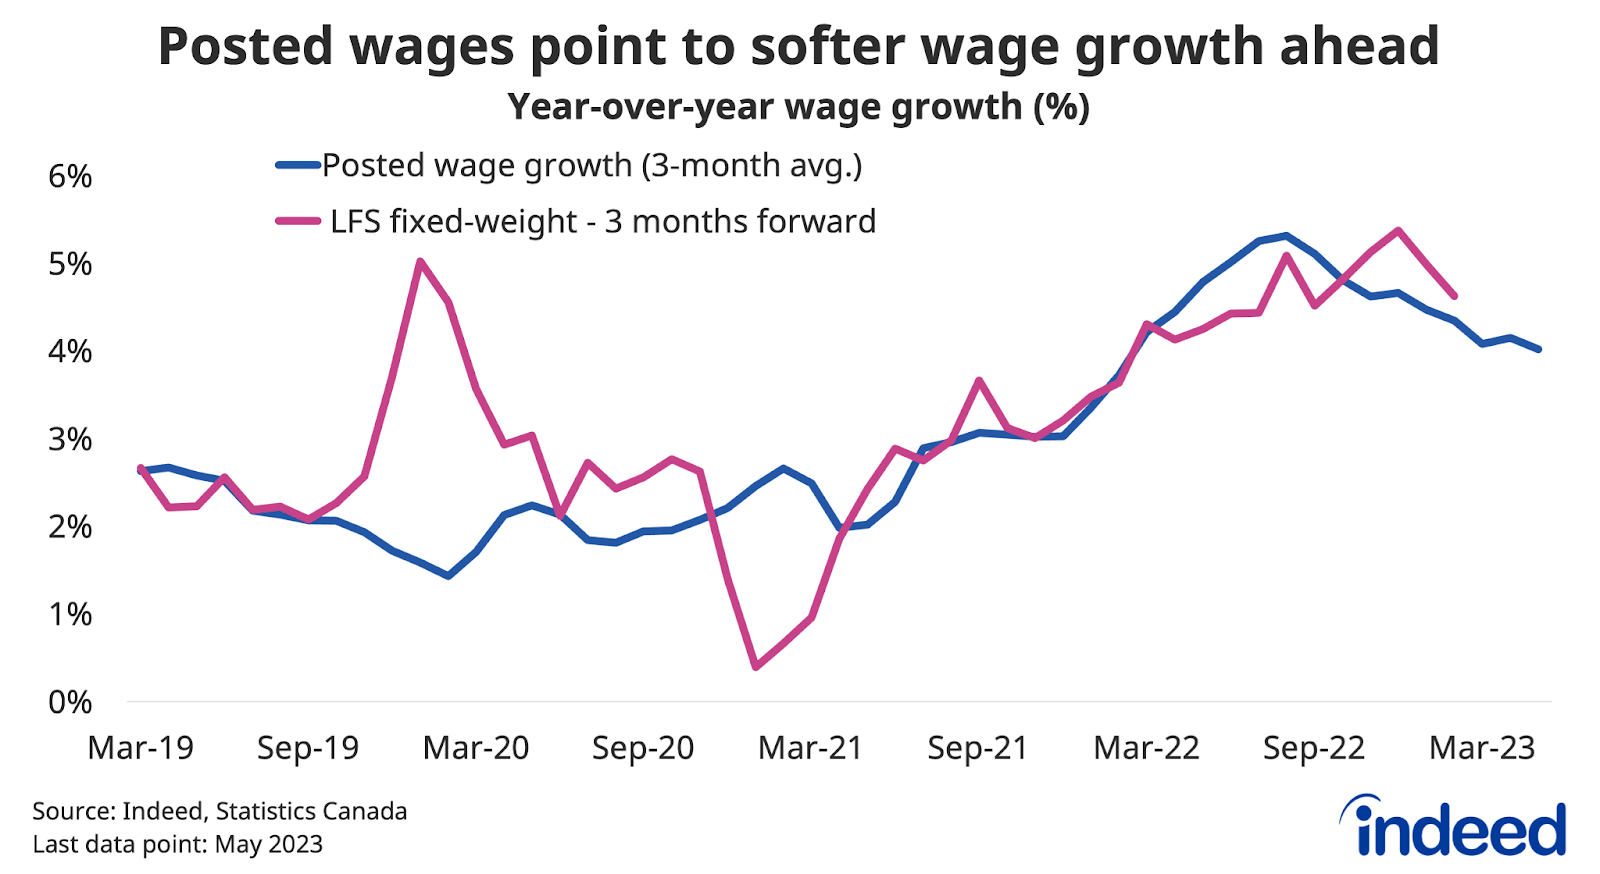
Wage growth measured by Indeed job postings was a good predictor of year-over-year LFS average hourly earnings (adjusted for a changing jobs mix) during its acceleration between 2021 and 2022, typically with a two-to-three-month lead time. However, for most of 2023, posted wage growth has fallen back more than earnings growth. Nonetheless, the May LFS wage data came in softer than prior months, which could be a sign that pay growth will start easing, as we’ve seen with posted wages.
Wage growth stands at the intersection of two key questions facing the Canadian economy in 2023. First, will Canadian paychecks start catching up with the surge in the cost of living over the past two years? Second, how closely is the outlook for inflation tied to current levels of wage growth, and is a weaker labour market necessary for inflation to return to more normal levels?
Posted wage growth has decelerated since mid-2022 as Canadian job postings on Indeed have softened, though both remain above pre-pandemic levels. Meanwhile, unemployment has stayed low (a slight uptick in May notwithstanding) though this partly reflects exceptionally low layoff rates, which might be a lagging economic indicator.
Canada’s path to “immaculate disinflation” — lower inflation, rebounding real wages, and still low unemployment — remains a highwire act: still on track so far in 2023, but will it last? If hourly pay starts to cool like posted wage growth, inflation will have to slow even faster for paychecks to recoup lost purchasing power. In the background, Canada’s lethargic labour productivity growth amplifies the tension between wage growth and inflation, and could make it tough for real wages to get on a solid upward trajectory.
Methodology
All posted wage growth data in this post refers to the three-month trailing average of the year-over-year growth rate in average posted wages.
To calculate the average rate of posted wage growth, we follow an approach similar to the Atlanta Fed US Wage Growth Tracker, but we track jobs, not individuals. We begin by calculating the median posted wage for a given country, month, job title, region, and salary type (hourly, monthly, or annual). Within each country, we then calculate year-on-year wage growth for each job title-region-salary type combination, generating a monthly distribution. Our monthly measure of wage growth for the country is the median of that distribution. Alternative methodologies, such as the regression-based approaches in Marinescu & Wolthoff (2020) and Haefke et al. (2013), produce similar trends.
More information about the data and methodology is available in a research paper by Pawel Adrjan and Reamonn Lydon, Wage growth in Europe: evidence from job ads, published in the Central Bank of Ireland’s Economic Letter series.
The wage tiers of occupational categories are determined by ranking categories by the median wage advertised in the sector in 2019. The categories are then split into three tiers so each tier contains categories that covered one-third of job postings on Indeed on an average day in 2019. The average posted wage growth for each tier is a weighted mean of each category in the tier in which the weight is the number of salary or wage observations in the category that month.
In this post, we track how interest ratios — clicks-per-posting in various sectors relative to economy-wide clicks-per-posting — have changed since the start of the pandemic. Our list of sectors tracks different areas of the economy, grouped by related job titles. Data presented in the scatterplot are the annual average percent changes in the interest ratio in 2021 and 2022 compared with February 1, 2020, respectively.
To calculate fixed-weight wage growth in the LFS, we bucket LFS microdata for each of the 43 occupation groups into three levels of job tenure (6 months or less, 7 to 24 months, and 25 months and over), and recalculate headline average wages into a composition-adjusted measure by holding their respective weights constant at February 2020 levels.