The Big Picture

The US labor market appears to have found its (perhaps temporary) footing — albeit on lower ground. After three years of cooling from pandemic-era highs, the data increasingly suggest that the labor market, especially demand, has started to bump along the bottom. Job postings, unemployment, and openings have all been oscillating in a narrow range since late last year, even as month-to-month volatility and geopolitical uncertainty make any single reading hard to interpret. The low-hire, low-fire dynamic persists, but it may now be better understood as a new steady state rather than an ongoing deterioration.

Job Postings

Where we are: Indeed’s JPI stood 2.4% above pre-pandemic levels at 102.4 as of April 30, 2026. This is among the lowest readings of the JPI since spring 2021, though a slight recovery from a trough seen last October.

Line graph titled "Job postings return close to pre-pandemic levels" showing the indexed level of US job postings on Indeed, where 100 equals the February 1, 2020 baseline, through April 30, 2026. Postings plunged at the onset of the pandemic in early 2020, surged to a peak of roughly 160 in early 2022, and have steadily declined since, bumping along just above the pre-pandemic baseline at 102.4 as of late April 2026.
Line graph titled “Job postings return close to pre-pandemic levels” showing the indexed level of US job postings on Indeed, where 100 equals the February 1, 2020 baseline, through April 30, 2026. Postings plunged at the onset of the pandemic in early 2020, surged to a peak of roughly 160 in early 2022, and have steadily declined since, bumping along just above the pre-pandemic baseline at 102.4 as of late April 2026.

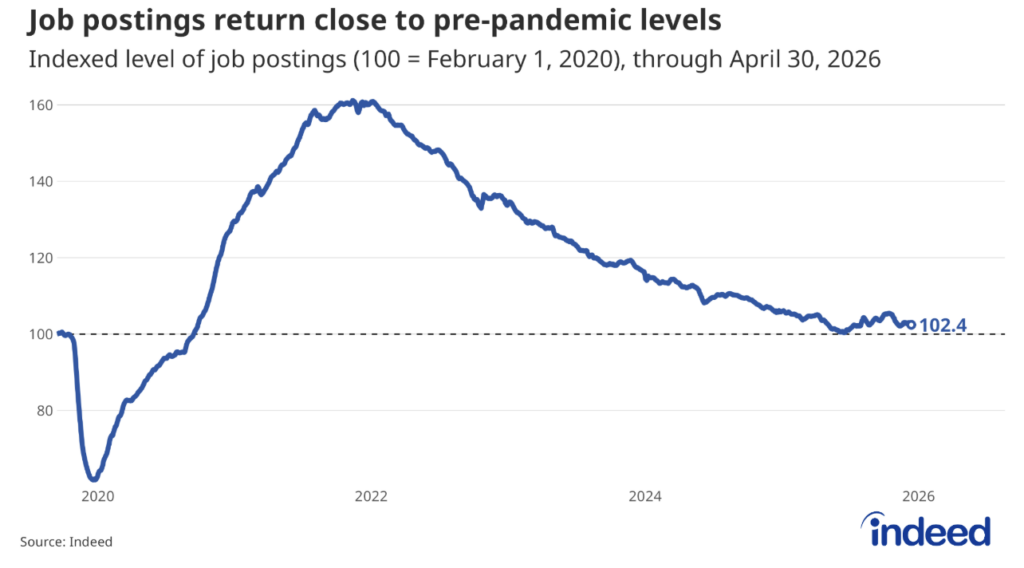
Direction of travel: While year-over-year readings over the last few months have remained negative, they are continually edging towards zero. As the JPI continues to bump along the bottom, month-over-month values have been a mix of small positive and negative readings.

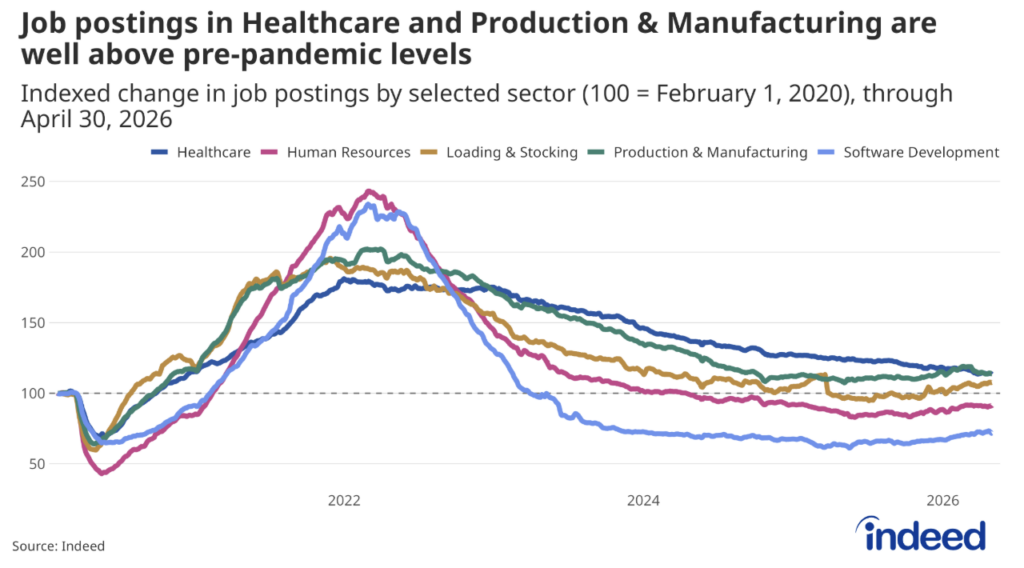
Sector split: Some healthcare postings remain well above their pre-pandemic baseline, even as the nursing sector continues to cool. While software development and IT roles sit roughly 30% below that baseline, software development jobs — especially ones linked to AI —are experiencing a strong pickup in demand, with that sector up 14% on a year-over-year basis as of April 30, 2026. Half of all sectors tracked are now near or above pre-pandemic levels, but the gap between the strongest and weakest is striking.

Line graph titled "Job postings in Healthcare and Production & Manufacturing are well above pre-pandemic levels" showing the indexed change in US job postings on Indeed across five selected sectors — Healthcare, Human Resources, Loading & Stocking, Production & Manufacturing, and Software Development — where 100 equals the February 1, 2020 baseline, through April 30, 2026. All sectors surged through 2021 and early 2022 before declining sharply, with Healthcare and Production & Manufacturing settling well above pre-pandemic levels, Loading & Stocking hovering near the baseline, and Human Resources and Software Development remaining below it as of late April 2026.
Line graph titled “Job postings in Healthcare and Production & Manufacturing are well above pre-pandemic levels” showing the indexed change in US job postings on Indeed across five selected sectors — Healthcare, Human Resources, Loading & Stocking, Production & Manufacturing, and Software Development — where 100 equals the February 1, 2020 baseline, through April 30, 2026. All sectors surged through 2021 and early 2022 before declining sharply, with Healthcare and Production & Manufacturing settling well above pre-pandemic levels, Loading & Stocking hovering near the baseline, and Human Resources and Software Development remaining below it as of late April 2026.

Wages

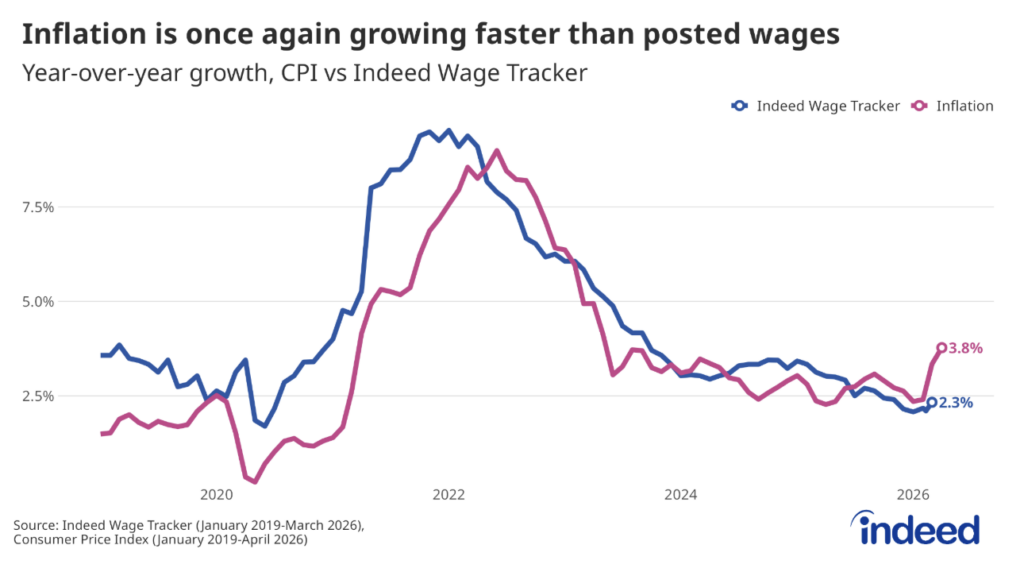
Headline: Posted wage growth has continued to decelerate, with the Indeed Wage Tracker clocking growth at 2.3% on a year-over-year basis as of March 2026. While we no longer see the wages growth decelerating quite as much as it did a few years ago, current growth levels are an outgrowth of a much cooler, less competitive labor market. 

Versus inflation: Of note remains the fact that inflation, as measured by the Consumer Price Index, has recently picked up. As inflation runs hotter than wage growth, consumers’ purchasing power will diminish and households’ paychecks won’t carry them quite as far as they used to, potentially impacting consumption.

Line graph titled "Inflation is once again growing faster than posted wages" showing year-over-year growth in the Indeed Wage Tracker compared with Consumer Price Index inflation from January 2019. Both measures spiked during the post-pandemic period, with wage growth peaking ahead of inflation in 2022 before the two converged and gradually cooled. Inflation has reaccelerated to 3.8% as of April 2026, while posted wage growth has slowed to 2.3% as of March 2026, continuing the recent trend of price growth being ahead of wage growth.
Line graph titled “Inflation is once again growing faster than posted wages” showing year-over-year growth in the Indeed Wage Tracker compared with Consumer Price Index inflation from January 2019. Both measures spiked during the post-pandemic period, with wage growth peaking ahead of inflation in 2022 before the two converged and gradually cooled. Inflation has reaccelerated to 3.8% as of April 2026, while posted wage growth has slowed to 2.3% as of March 2026, continuing the recent trend of price growth being ahead of wage growth.

The Labor Market Balance

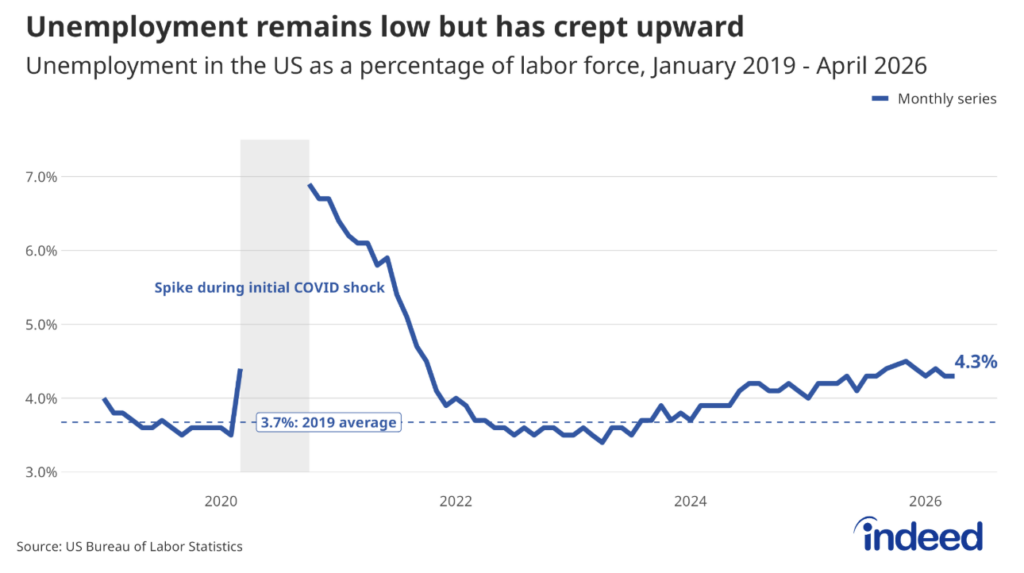
Unemployment: With last Friday’s jobs report, the unemployment rate now stands at 4.3%. While this is still a historically low level, it continues the recent trend of more elevated rates.

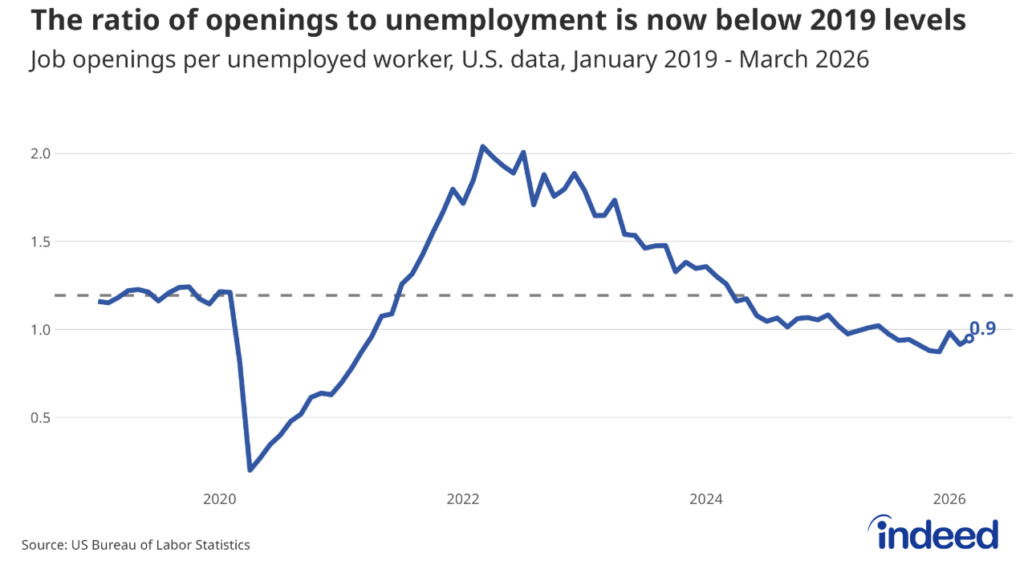
Job openings per unemployed worker: The vacancy-to-unemployment ratio has dropped to 0.9, meaning there is less than one available job vacancy per unemployed worker. Similar to slowing wage growth, this ratio is in line with the cooling, less competitive labor market we have been experiencing. 

Hires, quits, and layoffs: The quits rate remains subdued at 2.0%, suggesting workers aren’t confident they can find better opportunities elsewhere. Layoffs remain near historic lows, and hires — the recent spike notwithstanding — remain well below the post-pandemic rise, thereby reinforcing the low-hire, low-fire that has defined the labor market for over a year.

Line graph titled "Unemployment remains low but has crept upward" showing the US unemployment rate as a percentage of the labor force from January 2019 through April 2026, sourced from the US Bureau of Labor Statistics. After a sharp spike during the initial COVID shock in 2020, unemployment fell rapidly through 2021 and held below the 2019 average of 3.7% through most of 2022 and 2023. Since 2024, the rate has gradually risen, reaching 4.3% as of April 2026, sitting above the pre-pandemic baseline but still low by historical standards.
Line graph titled “Unemployment remains low but has crept upward” showing the US unemployment rate as a percentage of the labor force from January 2019 through April 2026, sourced from the US Bureau of Labor Statistics. After a sharp spike during the initial COVID shock in 2020, unemployment fell rapidly through 2021 and held below the 2019 average of 3.7% through most of 2022 and 2023. Since 2024, the rate has gradually risen, reaching 4.3% as of April 2026, sitting above the pre-pandemic baseline but still low by historical standards.
Line graph titled "The ratio of openings to unemployment is now below 2019 levels" showing the number of US job openings per unemployed worker from January 2019 through March 2026, sourced from the US Bureau of Labor Statistics. The ratio hovered near 1.2 throughout 2019, collapsed to roughly 0.2 at the onset of the pandemic in early 2020, and then surged to a peak above 2.0 in 2022 as labor demand outpaced available workers. It has steadily declined since, slipping below the 2019 baseline in 2024 and reaching 0.9 as of March 2026, indicating fewer open jobs than unemployed workers seeking them.
Line graph titled “The ratio of openings to unemployment is now below 2019 levels” showing the number of US job openings per unemployed worker from January 2019 through March 2026, sourced from the US Bureau of Labor Statistics. The ratio hovered near 1.2 throughout 2019, collapsed to roughly 0.2 at the onset of the pandemic in early 2020, and then surged to a peak above 2.0 in 2022 as labor demand outpaced available workers. It has steadily declined since, slipping below the 2019 baseline in 2024 and reaching 0.9 as of March 2026, indicating fewer open jobs than unemployed workers seeking them.

What We’re Watching

  • Embracing the new normal: The world of work is starting to look different, not just with AI influences but also how the labor market is responding to our aging population and immigration policy.
  • AI’s dual edge: Over 5% of job postings now mention AI, and software development job postings are up 14% year-over-year, with over 47% of job postings in the sector mentioning AI. But AI is also driving displacement: the information sector’s layoff rate doubled over the past year to 2.4%, the sharpest increase of any sector, in part driven by AI. We continue to watch the balance between destruction and creation.
  • Geopolitical headwinds and inflation: The Iran conflict has pushed CPI to 3.8%, widening the gap with posted wage growth and further squeezing real purchasing power. US postings have dipped modestly since the conflict began, but the knock-on effects — consumer confidence, business investment, and a Fed now even less likely to cut rates — may prove more significant in the months ahead.

The full chartbook with additional sector, wage, and JOLTS detail is available here.


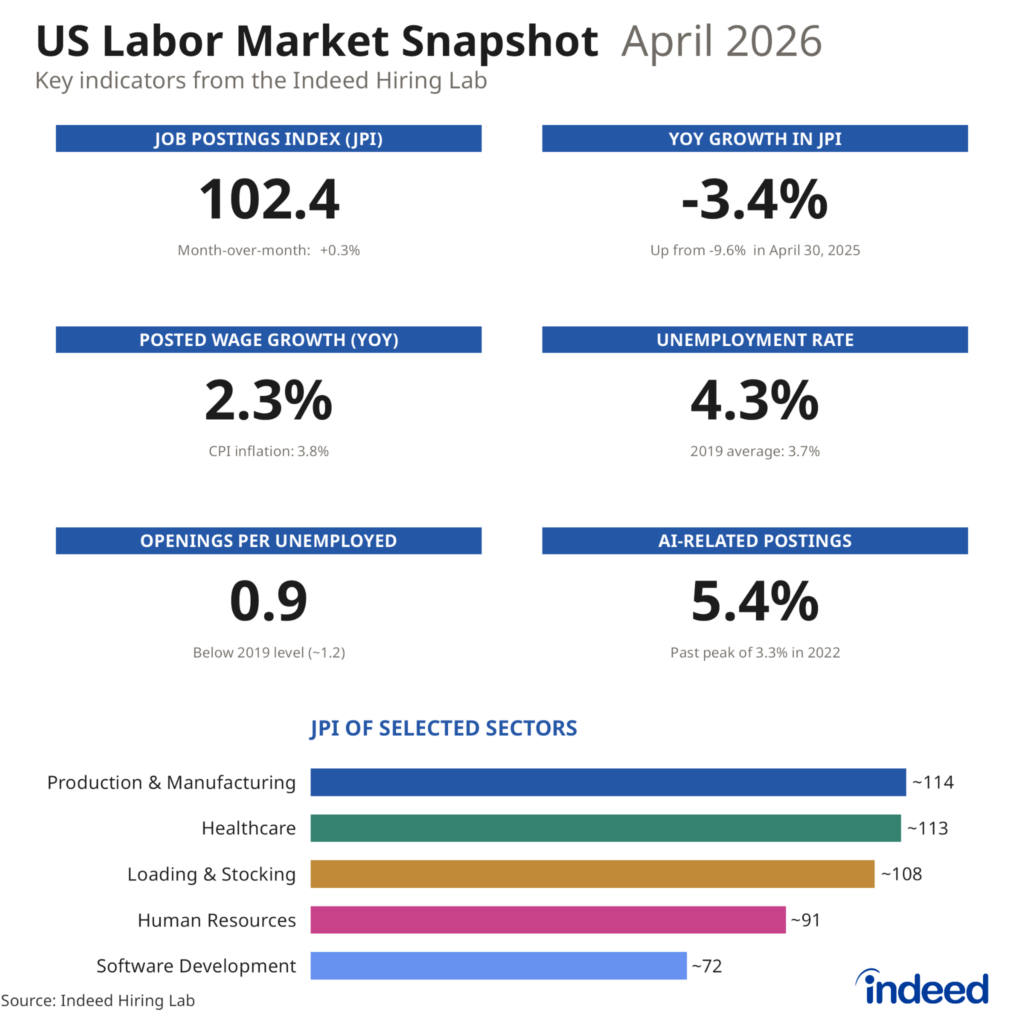
Infographic titled “US Labor Market Snapshot: April 2026” presenting key indicators from the Indeed Hiring Lab. The Job Postings Index (JPI) sits at 102.4, up 0.3% month-over-month but down 3.4% year-over-year (an improvement from -9.6% in April 2025). Posted wage growth has slowed to 2.3% year-over-year, trailing CPI inflation of 3.8%, while the unemployment rate stands at 4.3%, above the 2019 average of 3.7%. Job openings per unemployed worker have fallen to 0.9, below the 2019 level of roughly 1.2, and AI-related postings have climbed to 5.4%, well past their prior peak of 3.3% in 2022. A bar chart of selected sectors shows Production & Manufacturing (~114) and Healthcare (~113) well above the February 2020 baseline, Loading & Stocking (~108) modestly above, and Human Resources (~91) and Software Development (~72) still below pre-pandemic levels.