
Key points:
- The US labor market has been cooling for over three years, with unemployment drifting upward for 35 months, the longest such stretch without a recession on record.
- Rather than a sign of structural breakdown, this prolonged cooling can be better understood as the cyclical unwinding of an equally unprecedented pandemic-era labor boom.
- The recent surge in productivity growth is largely consistent with the final stage of this unwind — firms getting more from existing workers rather than adding new ones — though early AI adoption may also be contributing.
- With the Indeed Job Postings Index back near pre-pandemic levels, the labor market appears to be normalizing, not collapsing. But several dynamics bear close watching with potential trouble on the horizon.
The US unemployment rate has been quietly drifting upward for 35 months, the longest such stretch on record without triggering a recession. And yet, most of the usual labor market alarm bells aren’t ringing. To understand why, we need to look past where the labor market is today and consider the true scale of what has unfolded over the past half-decade. We are only just emerging from the shadow of the pandemic era, one of the most distorted, overheated hiring environments in modern history. And the enduring scars of this period have real implications for how employers should think about hiring, retention, and the risks still ahead.
What appears to be three years of deterioration can be better understood as the slow, cyclical unwinding of an unprecedented boom. Job postings have largely normalized, layoffs remain near historic lows, and GDP is still growing. But persistent inflation, rising geopolitical and economic uncertainty, the fragility of the current “low-hire, low-fire” equilibrium, and the early stirrings of demographic and AI-driven structural change mean the road ahead may be bumpier than the recent (relative) stability might suggest.
The slowest cooldown on record
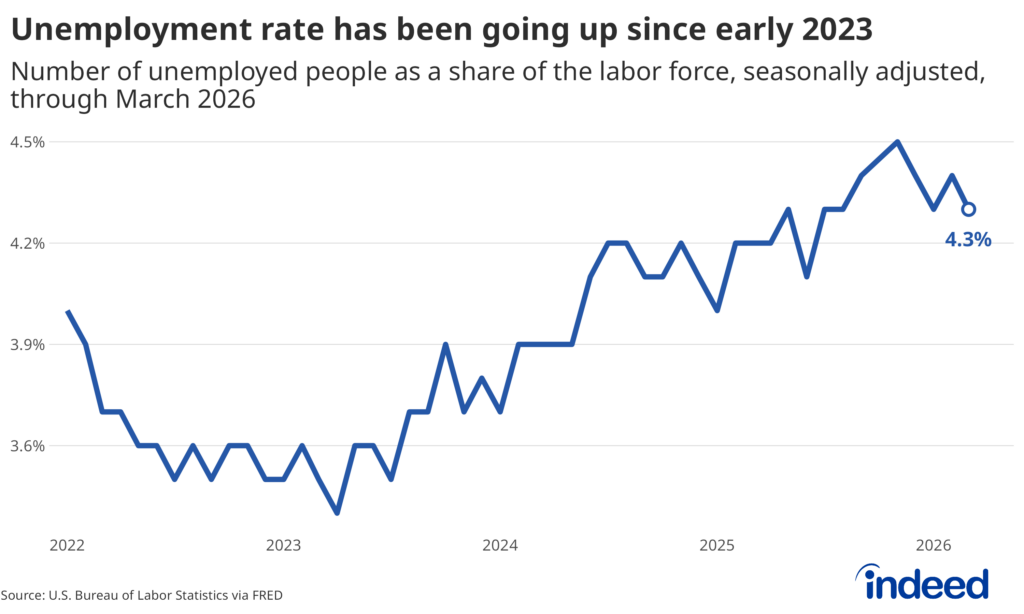
The US labor market has been sending mixed signals for nearly three years. Unemployment has risen from its 3.4% trough in April 2023 to 4.3% as of March 2026 — a 35-month upward drift that represents the longest sustained deterioration in the unemployment rate on record without a recession following. Every prior episode in which unemployment rose from a low base but remained below 4.5% was eventually followed by a recession, making the current episode genuinely unprecedented in its gradualism.
It’s natural to look at that statistic and worry. But context matters enormously here: the pandemic-era labor market that preceded this cooling was itself unprecedented. What we’re watching unfold isn’t a market that has been weakening for three years, but rather one that was supercharged to extraordinary heights and has been gradually coming back to earth ever since. This cooling has been largely cyclical, a natural shift in employment levels, unemployment rates, and labor force participation caused by the regular expansion and contraction of the business cycle. But real structural changes are also starting to emerge — including demographic changes and technological progress — that represent more-permanent shifts challenging conventional wisdom. We may soon live in a world with much less job creation but still-muted unemployment.
The boom that set the stage
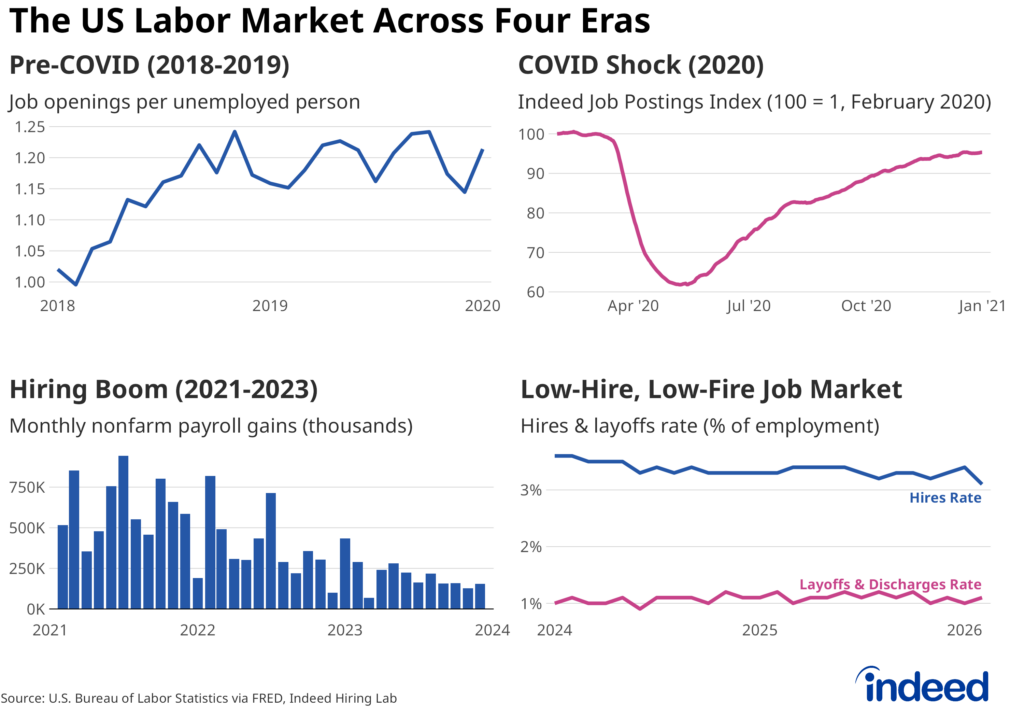
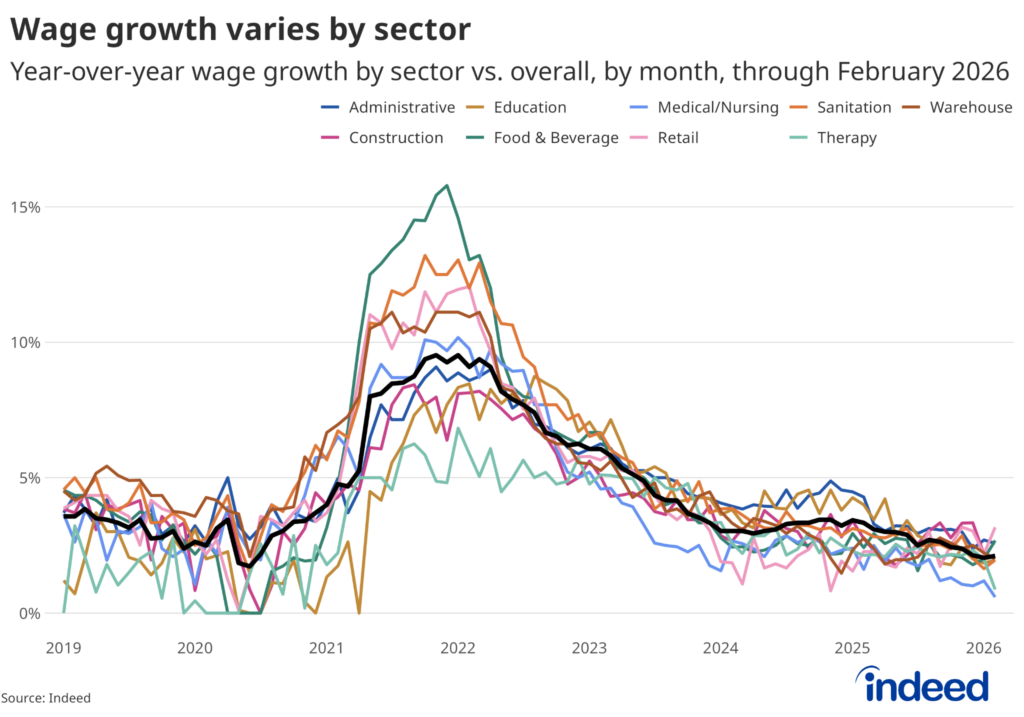
To understand where we are, we have to understand where we came from. After plunging in spring 2020 during the initial COVID shock, job postings surged to roughly 60% above pre-pandemic levels by late 2021 and early 2022. Job postings in some sectors, including human resources and software development, more than doubled during this period. At its peak, there were two available jobs for every person looking for work, and posted wages were growing at over 9% year-over-year. In this high-demand environment, workers had extraordinary leverage to pursue better pay and conditions, leading them to leave jobs and find new opportunities at record levels, ushering in the Great Resignation era.
This was not a normal labor market. It was a market distorted by pandemic-era demand shifts, massive fiscal stimulus, supply chain disruptions, and a workforce still adjusting to new patterns of consumption and work. Companies hired aggressively (in many cases beyond their immediate needs) because the pain of recruiting in a historically tight market made every vacant position feel urgent.
A cooling in stages
The unwinding of that boom has played out not as one sudden reversal but as a series of overlapping stages.
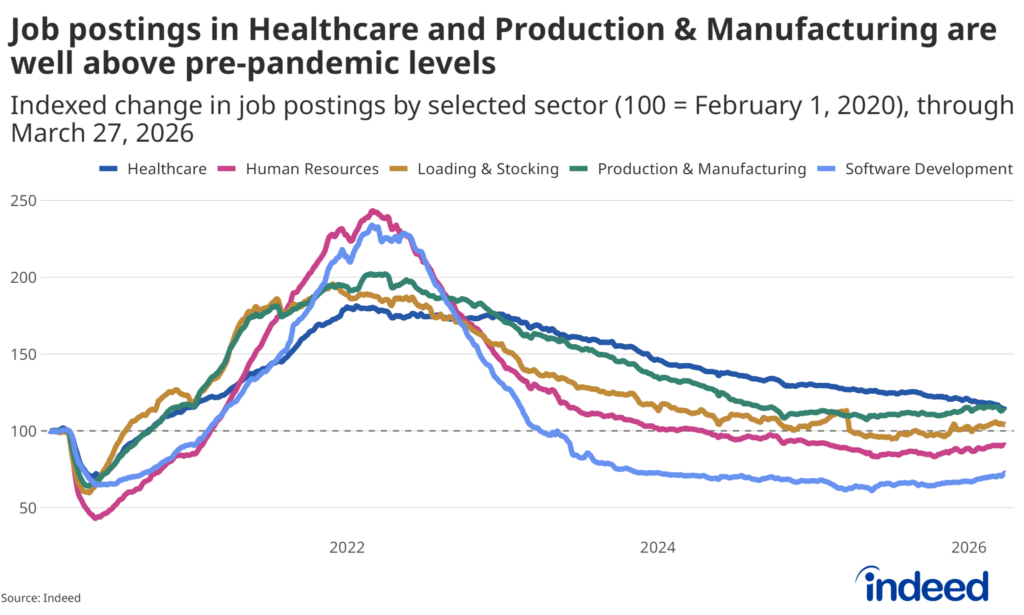
The pullback in demand. The Indeed Job Postings Index peaked at the end of March 2022 and has been on a downward path since. This didn’t happen all at once or uniformly. Jobs for software developers, for example, experienced both a dramatic, pandemic-era boom and an equally sharp post-pandemic bust (job postings in the sector are now roughly 30% below pre-pandemic levels). Job postings for healthcare and production & manufacturing, by contrast, never boomed quite as dramatically, but never really busted either, and remain well above their 2020 baseline. Other sectors, including loading & stocking and human resources, have settled near or slightly below their pre-pandemic starting points.
The decline in postings was initially driven by interest rate hikes that made capital more expensive and by a normalization of the demand patterns that had been pulled forward during the pandemic. When the cost of capital rises — essentially, when interest rates and other expenses on loans and other financial tools businesses use every day to fund their growth go up — businesses often scale back or delay planned expansions and/or new investments in equipment or facilities. And because labor and capital are often complementary (you need workers to operate new equipment or staff new facilities), reduced capital spending can directly translate into fewer new roles being created. But critically, while firms stopped hiring as aggressively during this cooldown phase, they didn’t start laying off workers in large numbers. The layoff rate has remained near its pre-pandemic, all-time low throughout this period.
The hoarding phase. Having been burned by the extraordinary difficulty of hiring in 2021 and 2022, many employers chose to hold onto workers even as business conditions softened. The logic was understandable: better to potentially be slightly overstaffed than to be understaffed and have to go through the pain of trying to rehire in a future upturn. The result was a period of labor hoarding — workers on the payroll but not fully utilized, with firms absorbing the cost of carrying excess capacity rather than risking future talent shortages.
But a new dynamic also emerged during this period. Not only were employers actively holding onto staff, staffers themselves stopped the kind of job-hopping that characterized the Great Resignation period, and started to hang on to their jobs at historic rates. In 2022, the quits rate started its decline, leveling off at around 2% by 2024, roughly equivalent to 2015 levels. Workers stopped voluntarily leaving because the incentives to move had largely disappeared. The wage premium for job-switching evaporated, job postings were declining, and uncertainty — economic, geopolitical, policy-related — made staying put the rational choice. Throughout 2024 and 2025, the labor market was characterized by this persistent “low-hire, low-fire” stasis.
The utilization squeeze. Rather than hiring new workers, firms have begun extracting more output from the workers they already have, which is evident in productivity data. The Bureau of Labor Statistics reported that nonfarm productivity (measured as total output per hour worked) grew at an annualized rate of 1.8% in the fourth quarter of 2025, following a 5.2% surge in the third quarter — the strongest quarterly gain in five years. For the full year, productivity rose 2.1%. Annual productivity growth at that rate is largely in line with long-run averages, but the fact that this kind of growth happened even as the typical hours worked by employees barely budged is unusual. The current period of strong productivity growth with essentially no growth in hours worked has been unique to the past couple years.
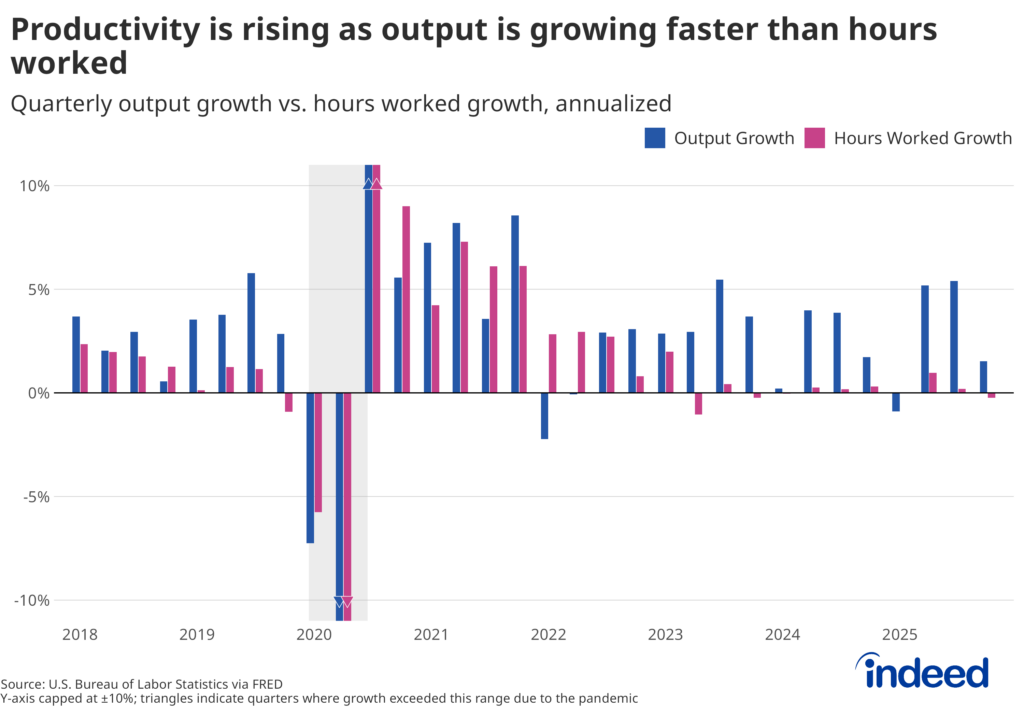
In the fourth quarter of 2025, total output rose 1.8% while overall hours worked actually decreased 0.2%. Average weekly hours for private-sector workers have held steady in a tight range between 34.2 and 34.3 for more than a year, down from a pandemic peak of 35.0 in January 2021, but essentially unchanged month-to-month. Workers aren’t working longer; employers are getting more from the hours they’re already working.
This is the signature of the utilization squeeze. During the hoarding period, a worker clocked in for 34 hours might have been doing 25 hours of genuinely productive work. Now, that same worker is fully loaded. The data reflect the same 34 work hours in both cases, but the output per hour jumps. Some of this productivity improvement is likely attributable to early AI adoption and business investment in new technologies, but a tighter utilization squeeze is a significant and perhaps primary driver of the recent gains.
Cyclical, not (yet) structural
So is this a structural transformation of the labor market, or a cyclical unwinding of a pandemic-era distortion? The weight of the evidence points to the latter.
For example, if AI were structurally displacing workers from some sectors, we would expect to see wages fall in areas where AI can perform more tasks at a high level, and rise in sectors where human workers remain essential and scarce. Instead, wage growth is broadly slowing down across virtually every sector, which is more consistent with a cyclical shift than a structural reshuffling of the labor market. Advertised wages grew just 2.1% year-on-year in February, according to the Indeed Wage Tracker, down from 9.5% during the post-pandemic boom. The slowdown is evident across a variety of typically low-, middle-, and high-paying sectors; consistent with a demand-driven cooling, rather than a structural reshaping.
Overall posting patterns also reinforce this story. The sectors showing the sharpest post-pandemic declines in postings, including software development, HR, and professional services, are also among those that experienced the most dramatic pandemic-era booms. Healthcare, which had a slower, more sustained pandemic surge, has held up much better. This isn’t the pattern you’d expect if technology were systematically eliminating categories of work; it’s the pattern you’d expect if a temporary demand shock were normalizing.
Critically, the level at which demand is stabilizing is itself informative. The Indeed Job Postings Index is essentially back to February 2020 levels, which was considered healthy and relatively tight at the time, with low unemployment and solid demand. Of course, a lot has changed since then. Immigration and rising participation both have contributed to meaningful labor force growth, so the same level of postings translates to a somewhat less tight market than it did in early 2020. Still, the broader takeaway holds: demand didn’t fall off a cliff — it normalized back to a level that, not long ago, most economists would have considered pretty healthy.
The unprecedented length of the cooling is better explained by the unprecedented magnitude of the boom that preceded it. If the pandemic pushed labor demand to heights never before experienced, then it follows that the return to earth would take longer, too.
Unemployment in context: The level doesn’t tell the whole story
During cyclical transitions, the inevitable outcome after a period of rapid growth is often a period of contraction — a recession. Conditions don’t currently suggest a recession is imminent, but things could change. A challenge is that many of the main indicators we have of recessions (namely, the unemployment rate) are often backward-looking, rather than forward-looking. Additionally, looking at any single indicator in isolation is never as telling as examining the overlapping interactions of many indicators at once.
The unemployment rate tells you where the economy has been, not where it’s going. Unemployment often continues to rise well after a recession has officially ended. The official end of the Great Recession came in June 2009, but unemployment kept climbing for another four months, peaking at 10% in October of that year. After the official end of the 1990–91 recession, unemployment continued rising for 15 months. The National Bureau of Economic Research, the private organization that officially determines the start and end dates of economic recessions, places relatively little weight on the unemployment rate alone when dating business cycles.
What has historically distinguished a genuine recession is the combination of rising unemployment, falling GDP, spiking layoffs, contracting consumer spending, and tightening credit conditions. In every single recession since World War II, all five of these indicators moved together. But right now, only unemployment is rising. GDP growth remains positive. Layoffs are near historic lows. Consumer spending, while showing some strain, has not collapsed. The labor market is softening, but the constellation of conditions that defines a recession has not materialized.
Again, the current period is less like the early stages of past recessions and more like a prolonged normalization from an abnormal starting point.
But the risks are real (and concentrated)
None of this is to say the outlook is without risk. The labor market may be normalizing rather than breaking, but normalizations can tip into contractions if the wrong dominoes fall.
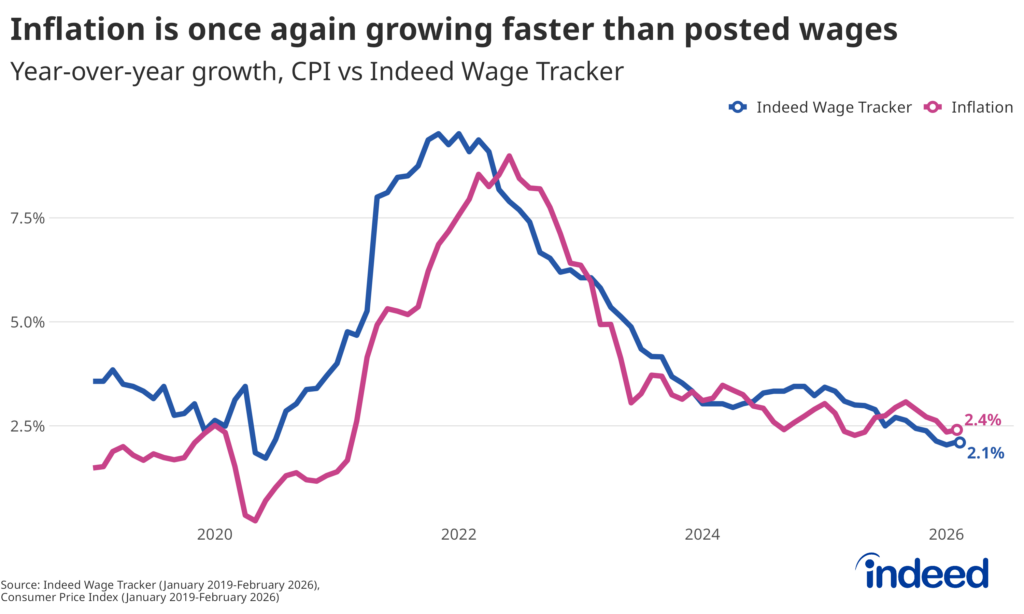
The most concerning development is the crossover between inflation and wage growth. The Consumer Price Index (the most widely watched indicator of inflation) grew at 2.4% year-over-year in February, compared to just 2.1% annual growth in posted wages, signifying an erosion in workers’ real purchasing power. US GDP growth has historically been driven by strong consumer spending. When consumers feel poorer, when the prices of everyday goods and services are rising faster than paychecks, they defer purchases. We’ve recently seen some evidence of this response, with retail sales declining 0.1% month-over-month in January 2026.
Layoffs remain the critical firewall. The “low-hire, low-fire” environment is sustainable as long as the “low-fire” part holds. But if firms move from cautious hiring freezes to active headcount reductions — whether driven by tariff pressures, geopolitical uncertainty, weakening consumer demand, or simply the exhaustion of the labor hoarding buffer — the slow bleed in unemployment could accelerate quickly. This dynamic tends to be self-reinforcing: layoffs reduce incomes, which in turn reduce spending, which in turn reduces demand, which prompts more layoffs.
On the supply side, labor force participation continues to decline as the Baby Boomer generation retires and immigration slows under current policy. Indeed data show that the share of clicks on US job postings by foreign job seekers has fallen sharply since mid-2023 and continues to decline. In sectors with high concentrations of foreign-born workers (food and beverage, agriculture, construction), time to hire has risen noticeably. These pockets of genuine labor scarcity exist alongside the broader cooling, creating a bifurcated market.
AI: Transformative potential, limited footprint — for now
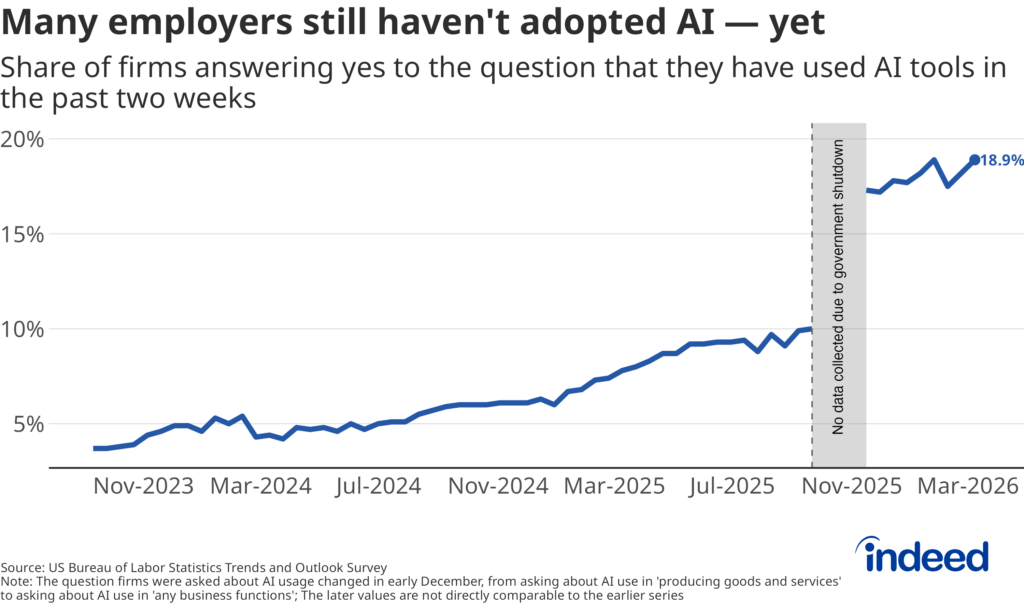
AI is increasingly part of the labor market conversation, but the data suggest we’re still in the early stages of its impact. Census survey data show that less than one-in-five firms report using AI regularly — a figure that is growing rapidly but still a minority. On Indeed’s platform, less than 5% of all job postings mention AI-related terms. Only about 6% of US firms have any AI-related job openings, and these are concentrated almost exclusively among large, tech-forward companies.
In tech specifically, there are suggestive signals: the share of tech postings requiring five or more years of experience rose from 37% in Q2 2022 (just before the widespread introduction of ChatGPT in Q3 2022) to 42% in Q2 2025, and senior roles are in higher demand relative to junior positions. This pattern is consistent with AI beginning to substitute for some entry-level work. But this shift is not showing up in healthcare or most other occupations and remains a largely tech-specific phenomenon for now.
To be clear: the fact that AI’s measurable footprint in the labor market is small today should not be mistaken for a signal that it won’t matter tomorrow. We expect AI to be a genuinely transformative technology with significant long-term impacts on how work is organized, which skills are valued, and how productive firms can be. Indeed’s research suggests that AI will touch virtually all jobs, though only about a quarter will be highly impacted. The gap between AI’s potential and its current measurable impact is wide. But as adoption scales beyond the largest firms and into the broader economy, the effects on job composition, experience requirements, wages, and productivity are likely to be profound.
The long shadow
The pandemic didn’t just temporarily disrupt the labor market. It pulled demand to extraordinary highs, enticed millions of workers to switch jobs, scarred employers with historically difficult hiring conditions, and created a period of labor hoarding that we’re only now fully working through.
So far, the labor market has been reacting to cyclical changes, but that doesn’t mean that more structural ones aren’t on the horizon. The “low-hire, low-fire” equilibrium has held because layoffs have stayed low. But that is a description of the present, not a guarantee of the future. If firms move from hiring freezes to active cuts, the slow bleed in unemployment could accelerate rapidly, and the feedback loop into spending and broader demand would be difficult to stop, putting us closer to a recession. However, the sawtooth nature of recent jobs reports — gains one month erased by losses in the next — is a potential early indicator of emerging structural impacts from lower birth rates, an aging workforce, lower labor market participation, and significantly lower levels of immigration. These structural headwinds are no longer on the distant horizon; they are already beginning to mount, and will have a profound impact on the labor market in the not-so-distant future.