
The Big Picture
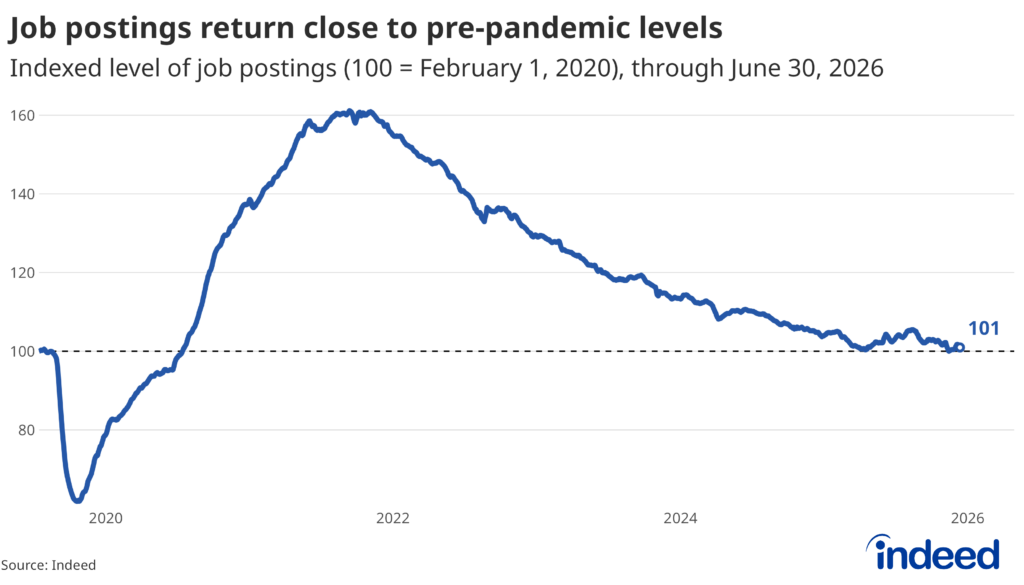
Overall hiring demand remained steady in June, with job postings on Indeed increasing marginally over the month. June data adds one more month to the ongoing story of a labor market stuck in still water. With little churn under the surface, we continue to watch for signs of either a meaningful and broad improvement in labor demand — or a meaningful deterioration in layoffs — to gauge which way the tide will turn.
Job Postings
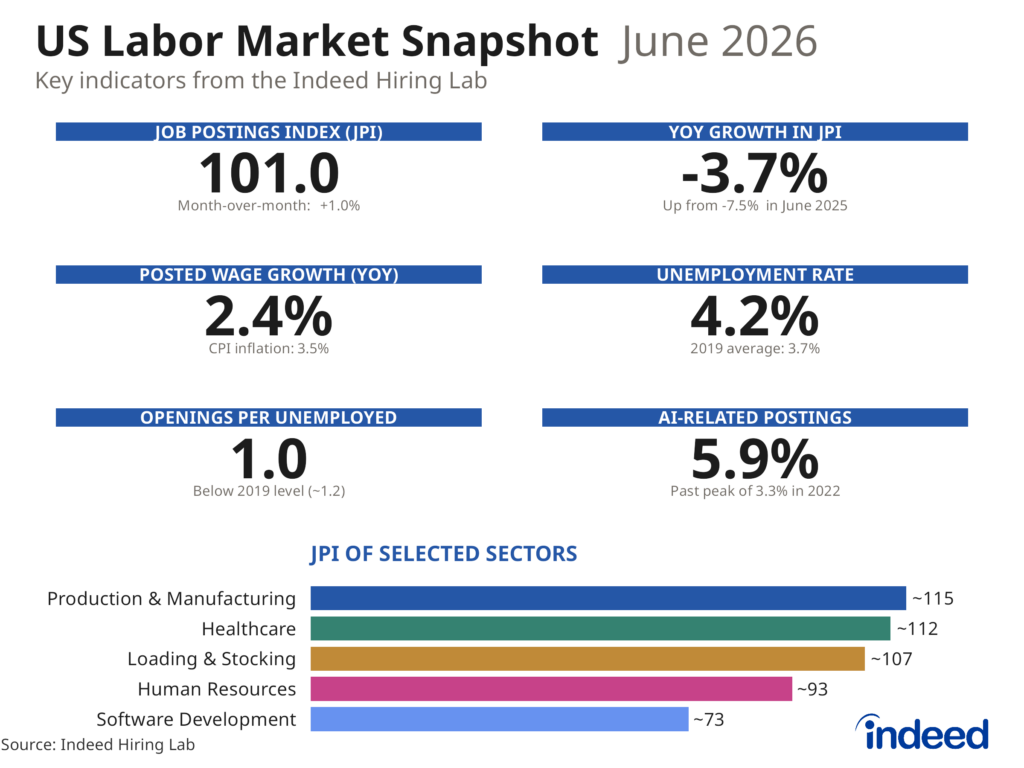
Where we are: Indeed’s JPI seems to be stabilizing around pre-pandemic levels, standing at 101.0 as of June 30, 2026. New postings (job postings on Indeed for 7 days or fewer) tell a similar story and have averaged exactly 100.0 in the first half of 2026.
Direction of travel: Labor demand improved marginally over June, with monthly growth in the JPI registering 1.0% as of June 30. Year-over-year change (-3.7%) remains negative, but the decline in labor demand is nevertheless decelerating as the labor market continues to weather years of successive shocks with surprising resiliency.
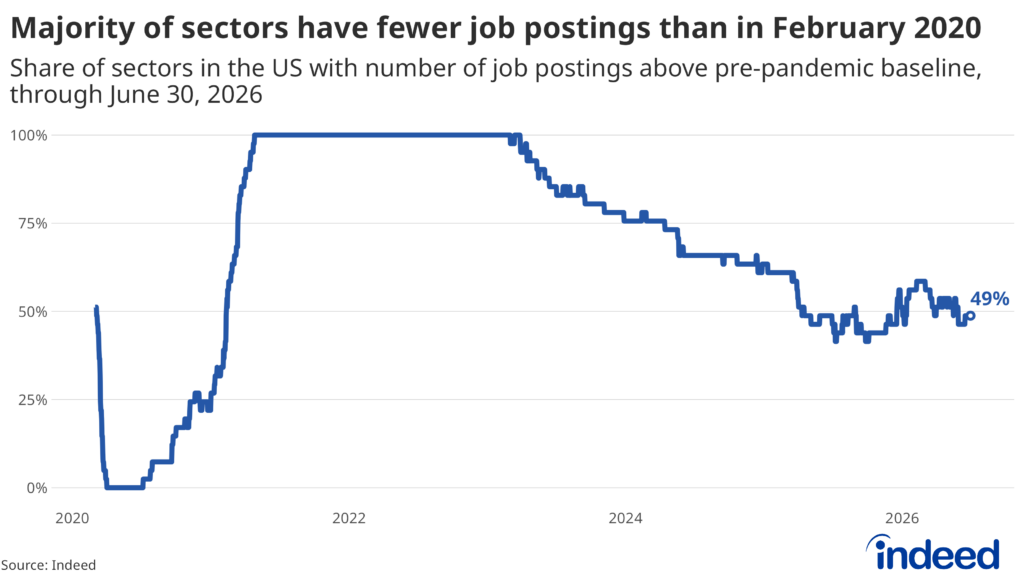
Sector split: About half of all sectors tracked are now near or below their pre-pandemic levels in terms of overall postings on Indeed. The gap between the strongest and weakest fields is striking. Many engineering and healthcare fields continue to have postings 30% higher than the pre-pandemic baseline. Meanwhile, marketing, data analysis, and software development roles have fallen by roughly 30% or more since February 2020.
Wages
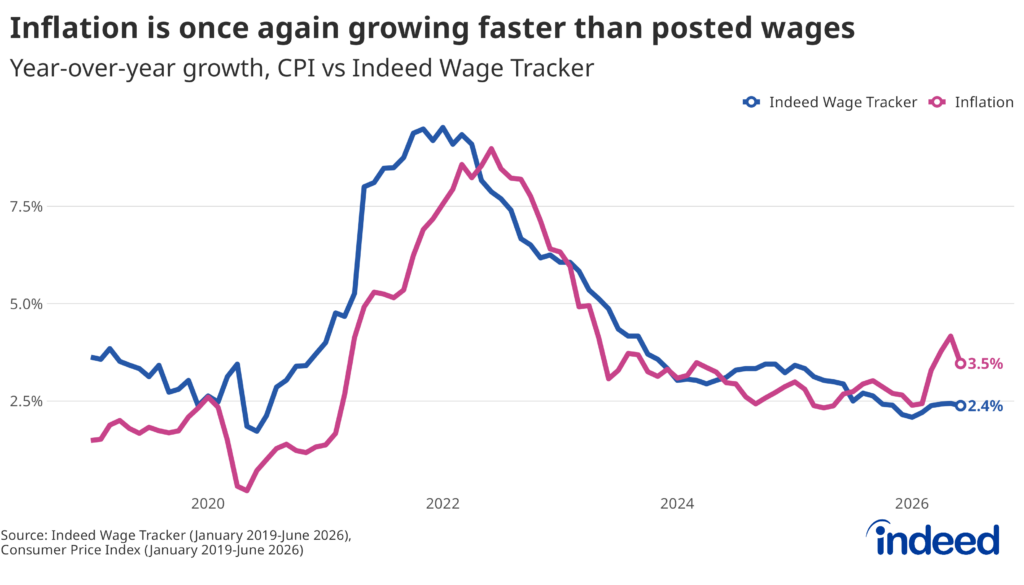
Headline: Posted wages rose 2.4% over the year ending June 2026, matching its annual growth rate registered over the preceding three months. Advertised wages have been growing more slowly than prices since mid-2025, but the recent inflationary run-up has widened the gap considerably. Diminishing real wage growth could squeeze households’ purchasing power ahead.
The Labor Market Balance
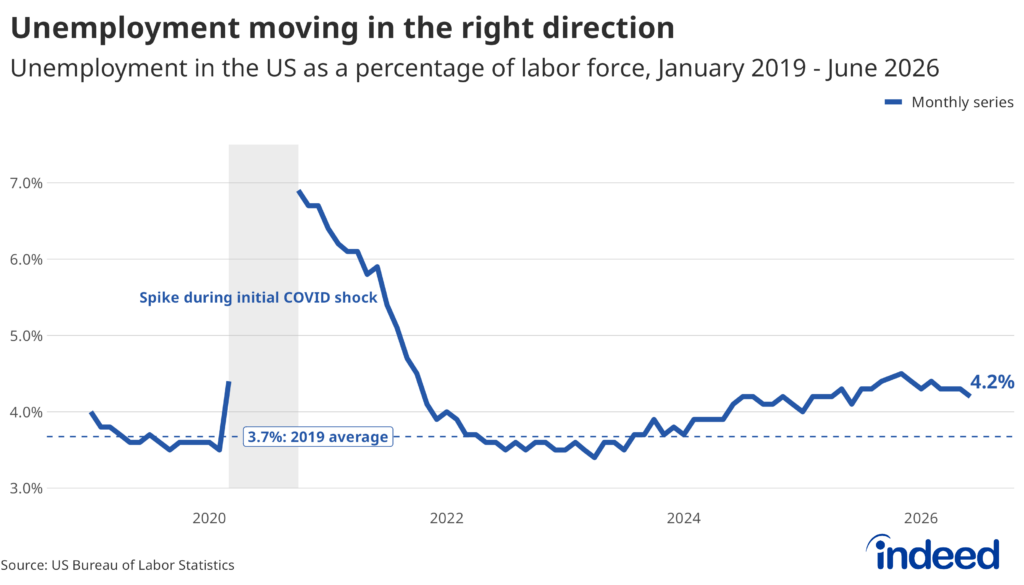
Unemployment: The unemployment rate improved to 4.2% in June. While this is the lowest jobless rate of the year, the move lower was due to the wrong reasons rather than fewer unemployed. Meanwhile, the vacancy-to-unemployment ratio held at 1.0 in May, indicating one available job vacancy for every unemployed worker. This indicator has improved from its lows last fall as the labor market has begun to show signs of stabilizing.
Hires, quits, and layoffs: The labor market remains low churn, with hiring near levels we saw 11 years ago, even as the labor force is nearly 13 million people larger today. Workers are clinging to their jobs in this environment, and the quits rate has been at or below 2% for almost a year. Low layoffs remain a bright spot in the labor market, keeping net hiring positive.
What We’re Watching
- Job creation from AI: The relationship between AI exposure and job postings appears to be flipping, from job destruction to job creation. Our recent report highlights how AI-related roles may be playing a large part in the recent rebound in software development labor demand. Further, job postings for roles related to the data center build-out are surging as AI infrastructure needs increase demand for untraditional tech jobs, like installation and maintenance workers who can bring specialized electrical knowledge and breathe life into new data centers.
- Monetary policy: Since the June meeting of the Federal Open Market Committee (the first monetary policy meeting chaired by Kevin Warsh), expectations for rate cuts this year have all but disappeared, as market watchers expect the Fed to hold (or even hike) interest rates in response to heightened inflationary pressures. A labor market that looks less on the brink than it did a few months ago is certainly contributing to policymakers’ reduced urgency to lower policy rates.
The full chartbook with additional sector, wage, and JOLTS detail is available [here].
Methodology
Data on seasonally adjusted Indeed job postings are an index of the number of job postings on a given day, using a seven-day trailing average. February 1, 2020, is our pre-pandemic baseline, so the index is set to 100 on that day. Data for several dates in 2021 and 2022 are missing and were interpolated.
Data on wage growth are the average year-on-year percentage changes in wages and salaries advertised in job postings on Indeed, controlling for job titles.
Data on AI-related postings are the share of AI (and generative AI) job postings, as a percentage of overall job postings, using a seven-day trailing average. We calculate the aggregate share of job postings in a specific location that included keywords associated specifically with: AI (e.g., “Machine Learning,” “Data Science,” and “Artificial Intelligence”) and Generative AI (e.g., “Generative AI,” “Large Language Models,” and “Chat GPT”).