Indeed Wage Tracker data series are available for download here. For details about the data and methodology, please see Pawel Adrjan and Reamonn Lydon’s working paper, “What do wages in online job postings tell us about wage growth?”
Key points:
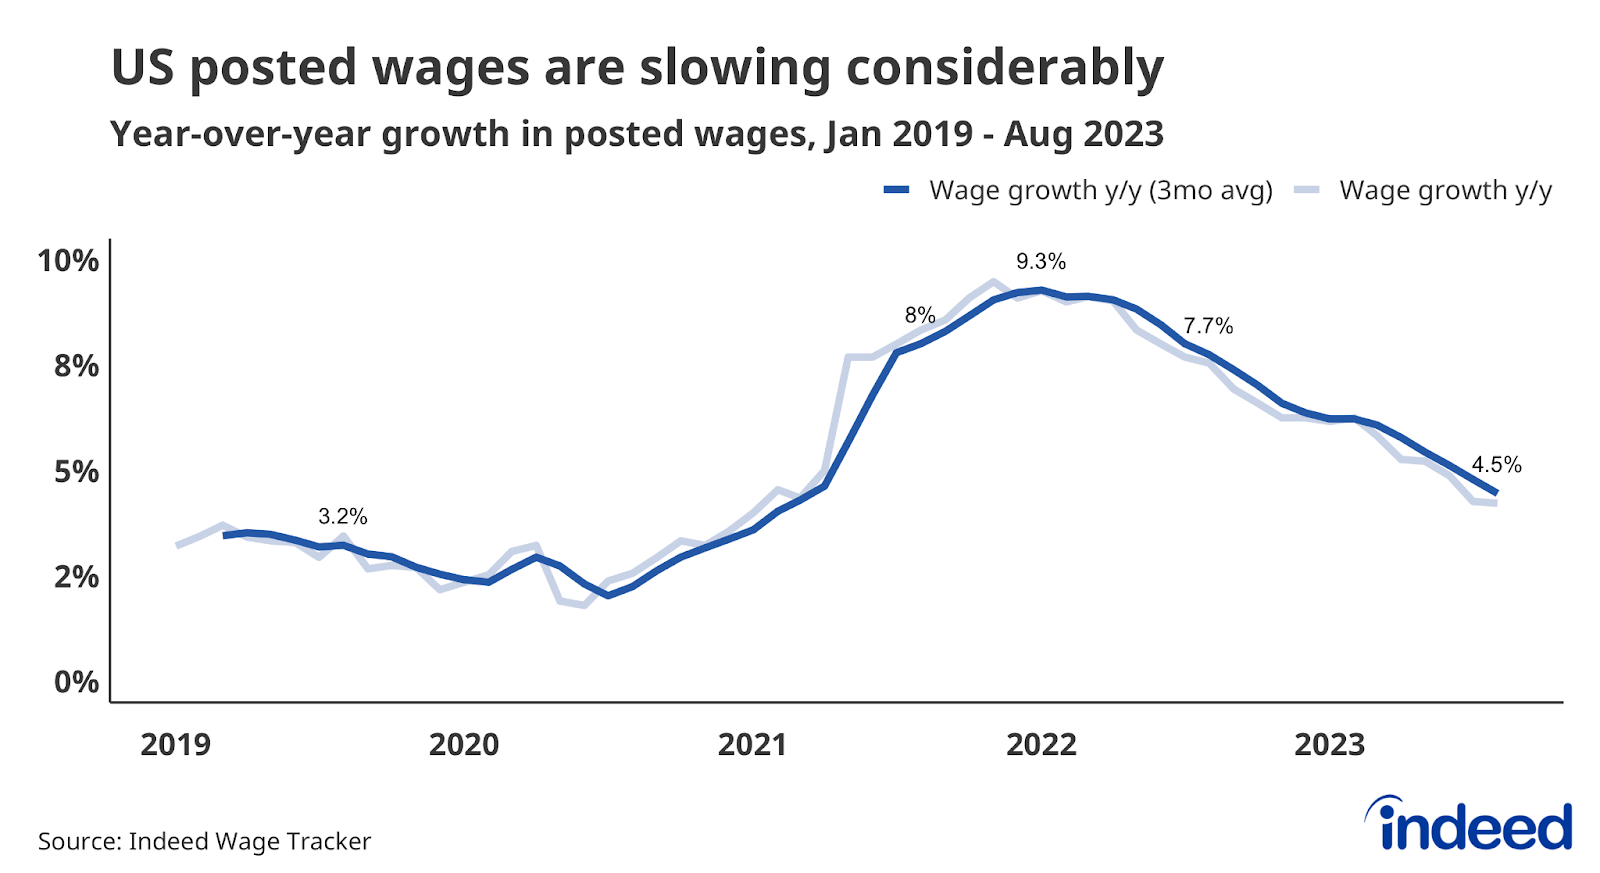
- The latest data from the Indeed Wage Tracker shows that US posted wages grew 4.5% year-over-year in August 2023, less than half their recent top speed of 9.3% in January 2022.
- At its current rate of slowing, posted wage growth would return to its 2019 average of 3.1% late this year or early in 2024.
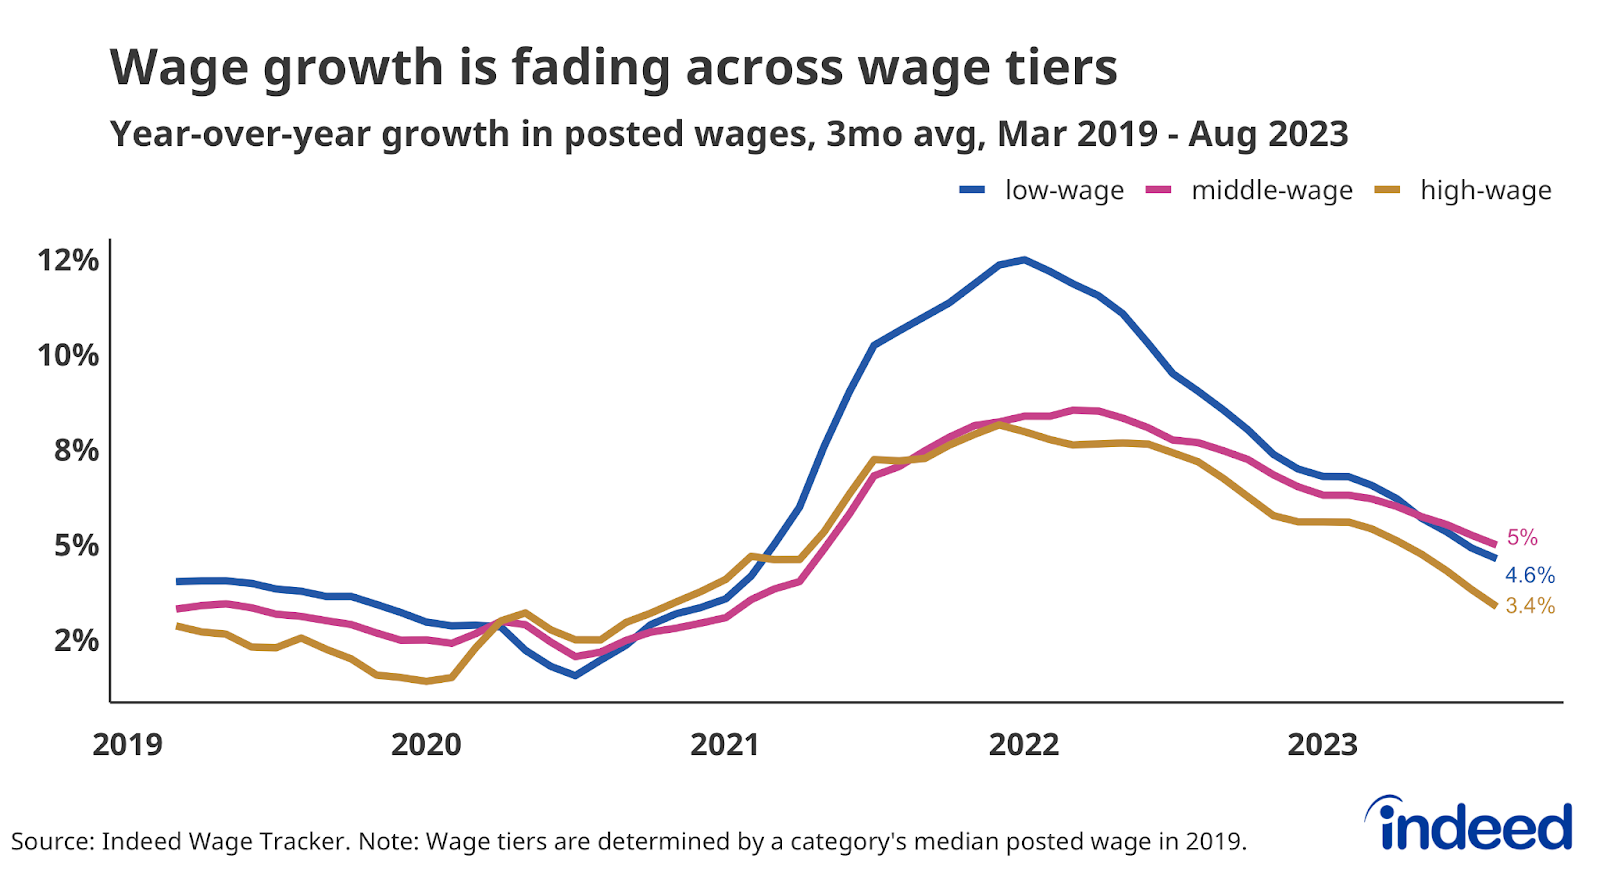
- The slowdown is broad-based as almost 80% of occupational sectors have wage growth lower than 6 months ago.
After years of rapid growth, US wage growth is headed toward pre-pandemic levels. The latest data from the Indeed Wage Tracker shows that posted wages in August were up 4.5% year-over-year. While this pace is elevated compared to pre-pandemic growth rates, it’s less than half the 9.3% rate seen in January 2022. And the current pace is unlikely to remain for long: At its current rate of deceleration, posted wage growth will hit its pre-pandemic average late this year or early in 2024.
Posted wages are slowing down in the vast majority of occupational sectors, reflecting a broad-based cooldown in the US labor market. Only 22% of sectors had wage growth in August equal to or above their February 2023 level. The size of those declines varies by sector, but they have been considerable across wage tiers. Notably, the recent slowdown is no longer tilted toward lower-wage sectors. Since February, posted wage growth has declined by 2.2 percentage points in both low-wage and high-wage sectors.
As it stands, the torrid wage gains of recent years are behind us now. In the months ahead, posted wages are set to return to their pre-pandemic speed, and broader measures of wage growth will likely follow.
Methodology
To calculate the average rate of wage growth, we follow an approach similar to the Atlanta Fed US Wage Growth Tracker, but we track jobs, not individuals. We begin by calculating the median posted wage for a given country, month, job title, region, and salary type (hourly, monthly, or annual). Within each country, we then calculate year-on-year wage growth for each job title-region-salary type combination, generating a monthly distribution. Our monthly measure of wage growth for the country is the median of that distribution. Alternative methodologies, such as the regression-based approaches in Marinescu & Wolthoff (2020) and Haefke et al. (2013) produce similar trends.
More information about the data and methodology is available in a research paper by Pawel Adrjan and Reamonn Lydon, Wage growth in Europe: evidence from job ads, published in the Central Bank of Ireland’s Economic Letter series.
The wage tiers of occupational categories are determined by ranking categories by the median wage advertised in the sector in 2019. The categories are then split into three tiers so each tier contains categories that covered one-third of job postings on Indeed on an average day in 2019. The average posted wage growth for each tier is a weighted mean of each category in the tier in which the weight is the number of salary or wage observations in the category that month.