
We regularly update this report to track the pandemic’s effects on the labor market.
Job postings on Indeed are a real-time measure of labor market activity. On July 16, 2021, they were 36.5% above February 1, 2020, the pre-pandemic baseline, after adjusting for seasonal variation. However, job postings increased in May, June, and July at a slower pace than in March and April.
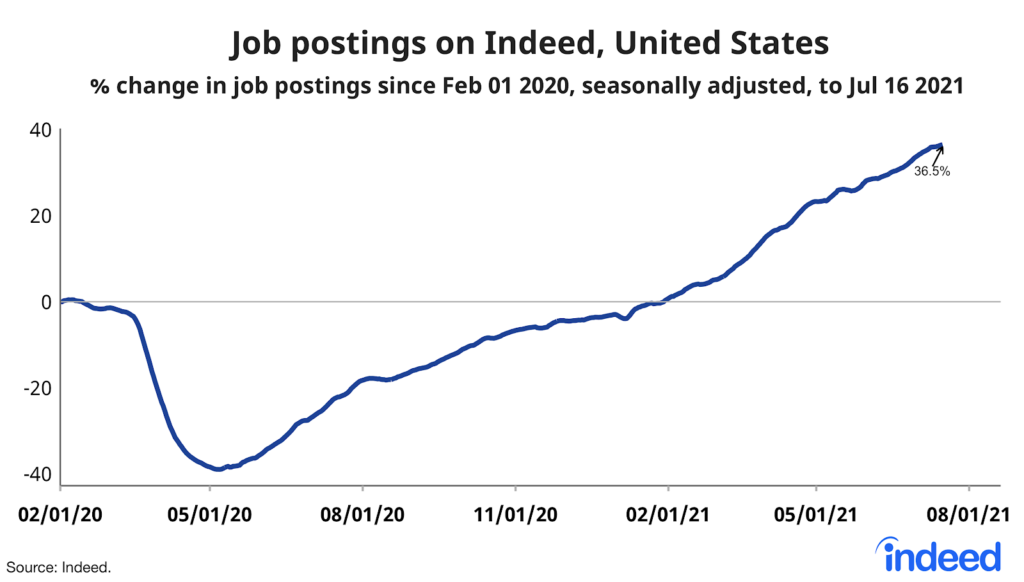
The Bureau of Labor Statistics reported 9.2 million job openings at the end of April in its latest JOLTS report. Job postings on Indeed increased 6.5% between May 31 and July 16. If JOLTS openings have grown since April 30 at the same rate as Indeed job postings, that implies 9.8 million job openings as of July 16.
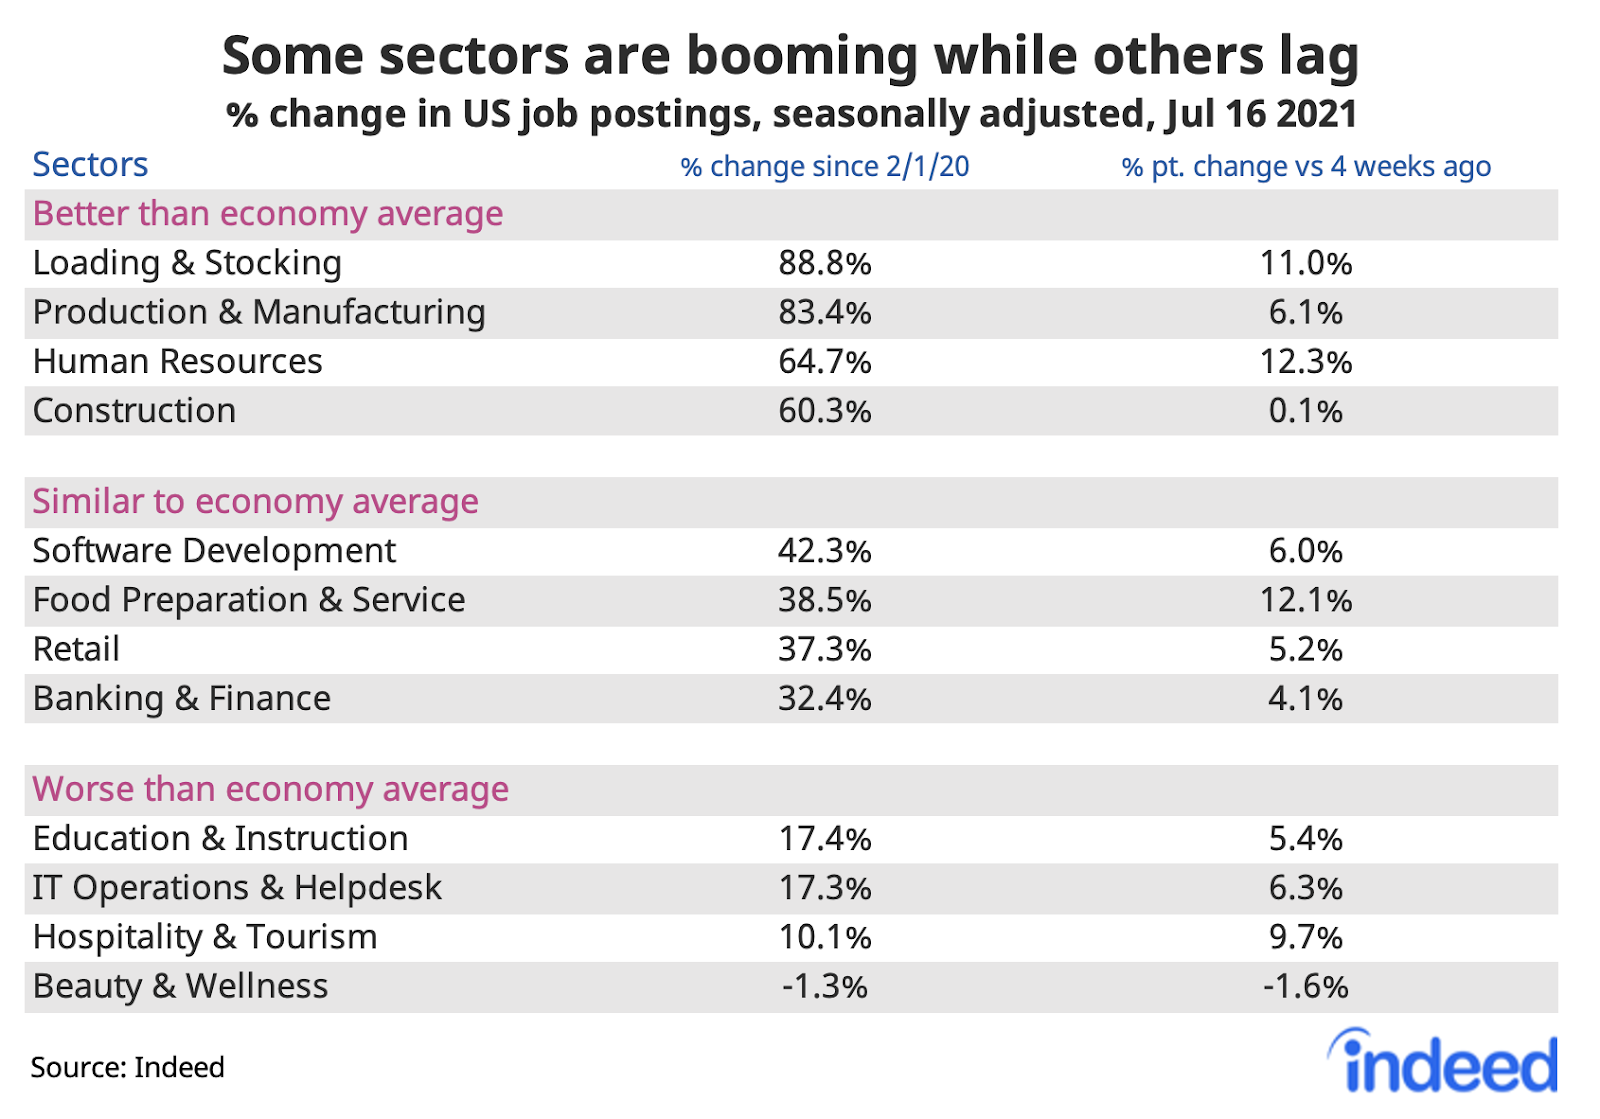
Big rebound in jobs that make & move stuff, and HR jobs
Job postings in all sectors are above the pre-pandemic baseline, led by goods-related sectors like loading & stocking, manufacturing, and construction. Human resources jobs are also far above baseline, as employers are eager to hire the people who will help them hire others. The big laggards remain hospitality & tourism and beauty & wellness.
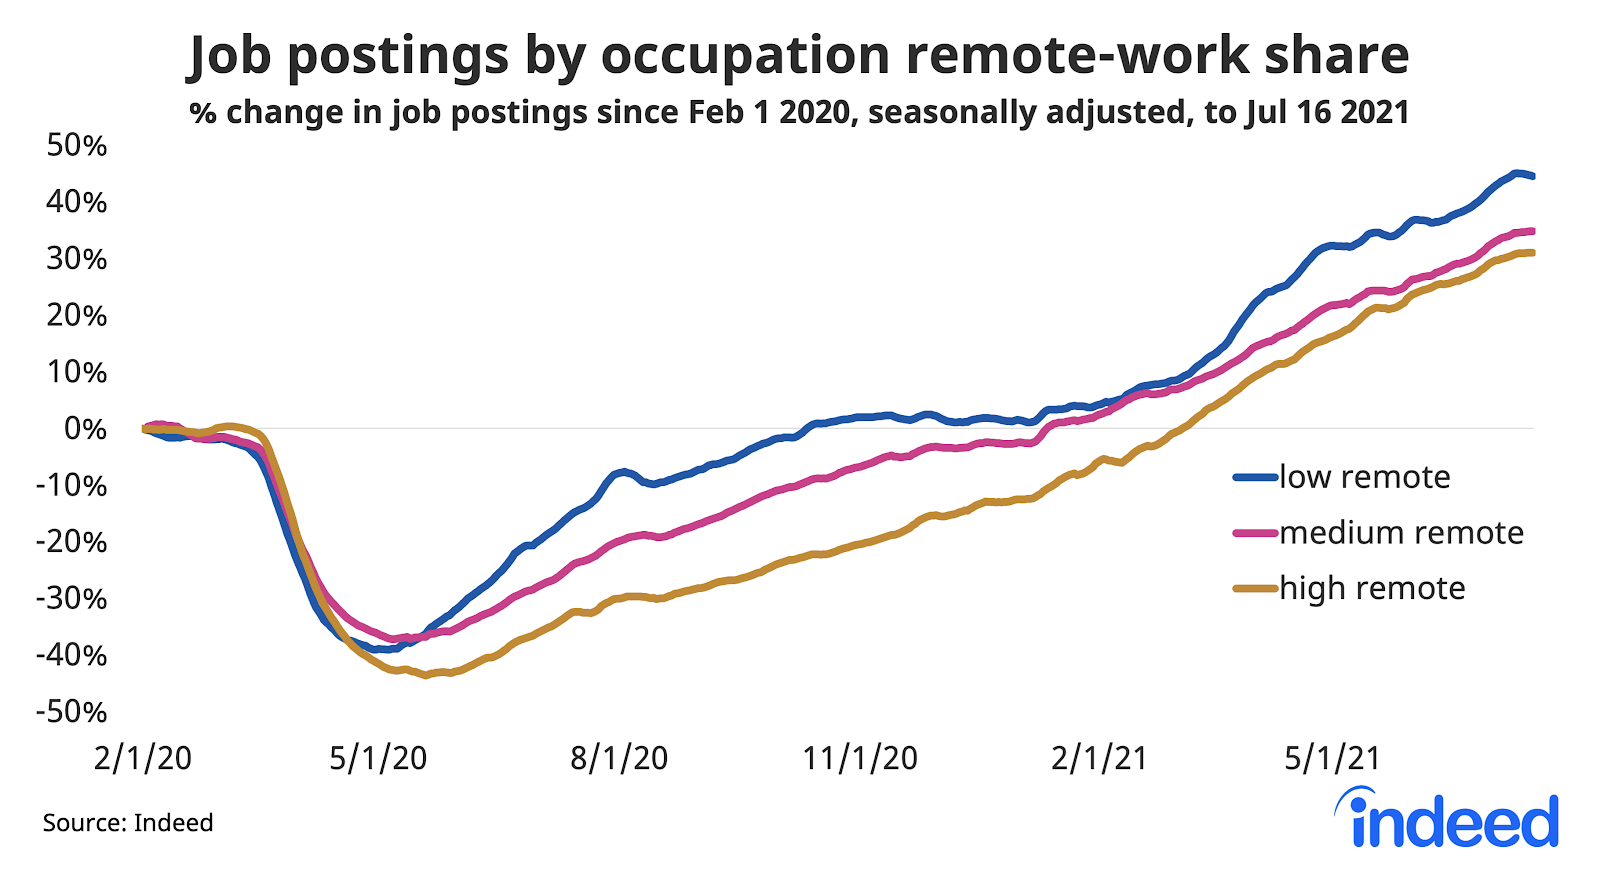
Postings for work that can’t be done from home recovered first and strongest. The shift to remote work in the pandemic created jobs in sectors that supported the stay-at-home economy, like driving and warehouse jobs, that aren’t themselves work-from-home jobs. But job postings in high-remote sectors have recovered, too.
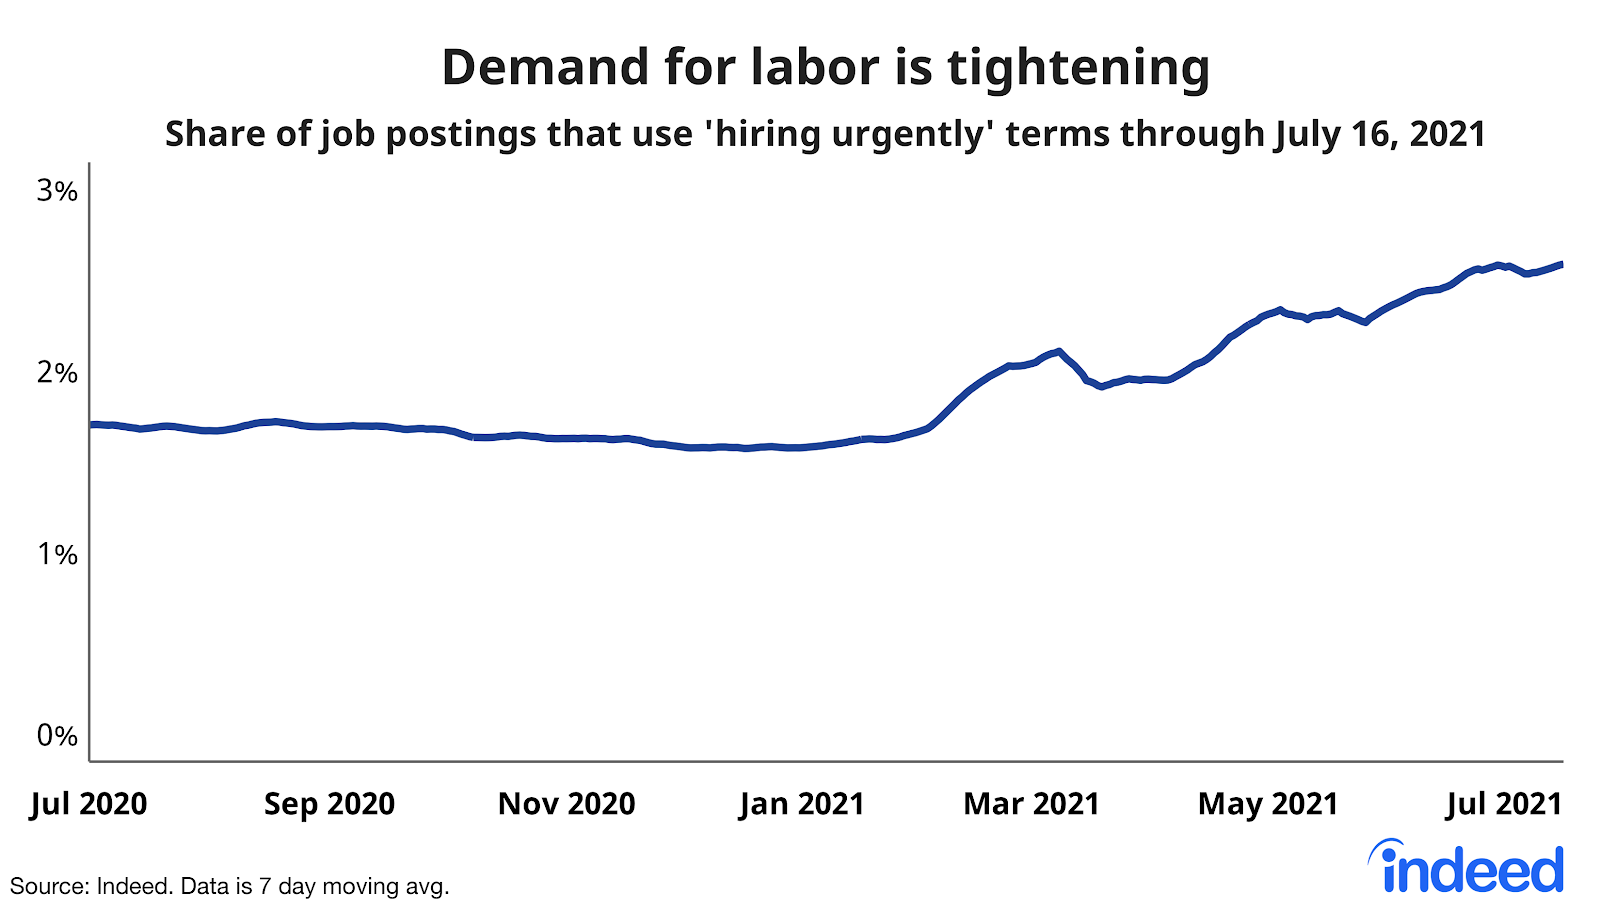
Job postings show employers are eager to hire
Employers are eager to hire — and that shows up not just in the number of job postings, but also in what those job postings say.
The share of job postings that use words like “hiring urgently” has jumped more than 50% since the start of the year. While job postings have been rebounding steadily since last summer, in recent months job postings have increasingly mentioned urgent hiring.
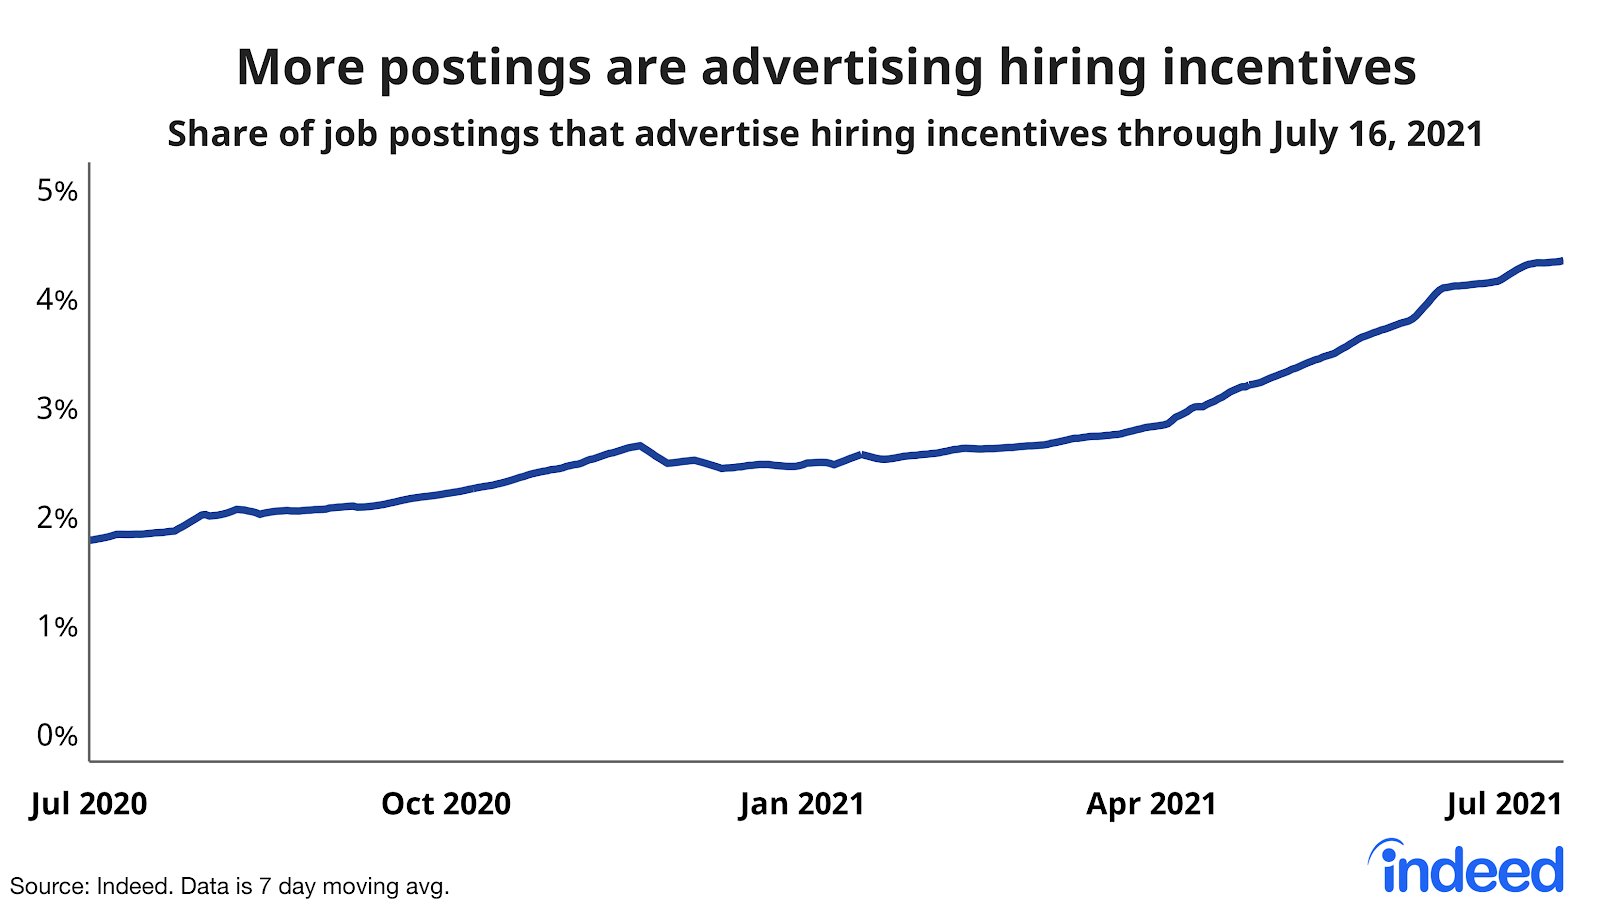
Furthermore, employers are offering bonuses and other hiring incentives. The share of job postings that mention hiring incentives has more than doubled, to 4.3% on July 16 from 1.8% one year earlier. Much of the increase in incentives has come just in the last several months.
Metros where job postings have recovered more slowly
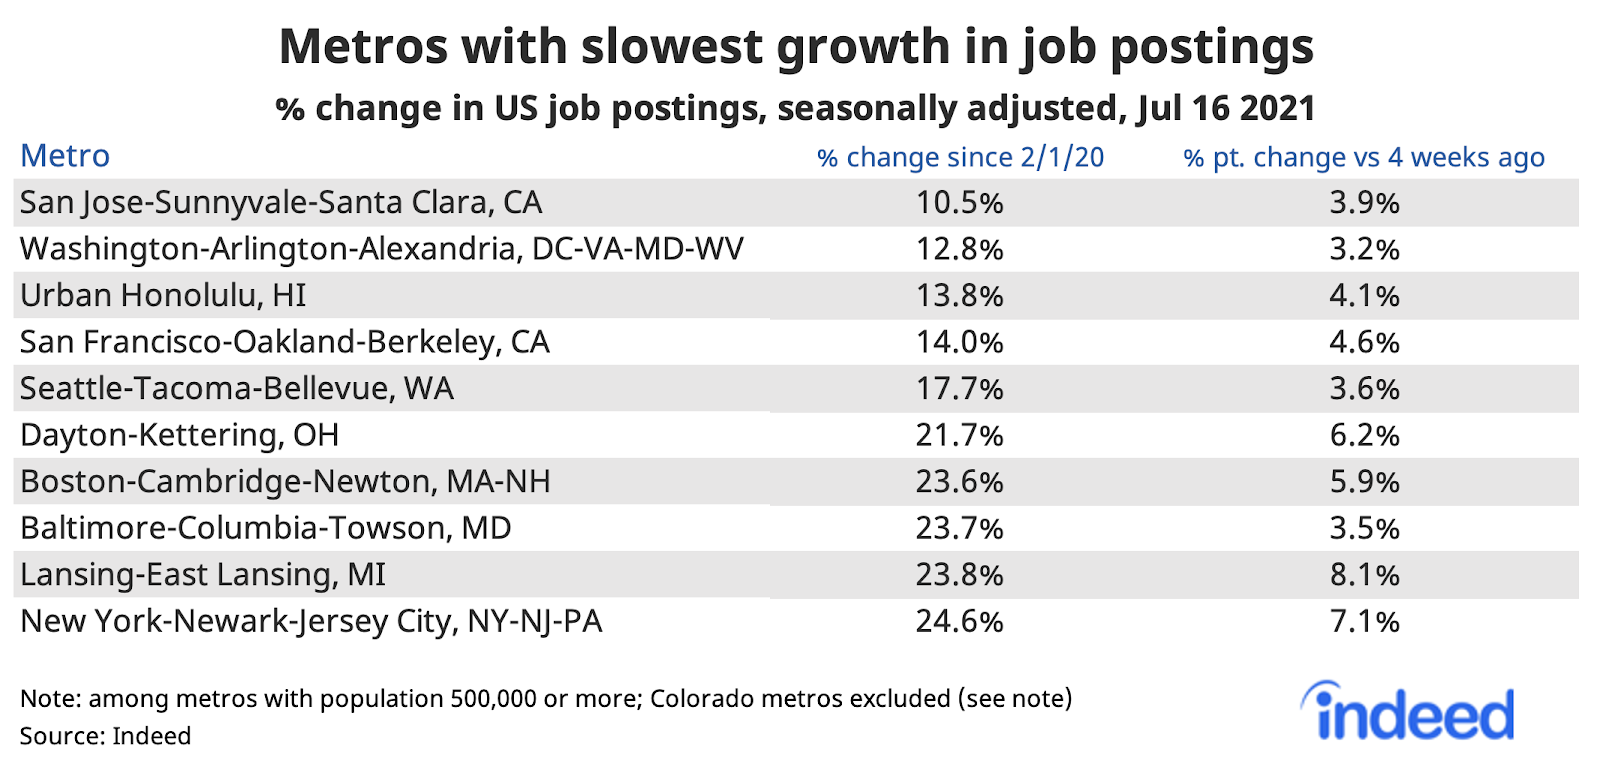
Within the US, job postings are back up above the pre-pandemic baseline in all large metros. Job postings have recovered least in San Jose and metro Washington DC.
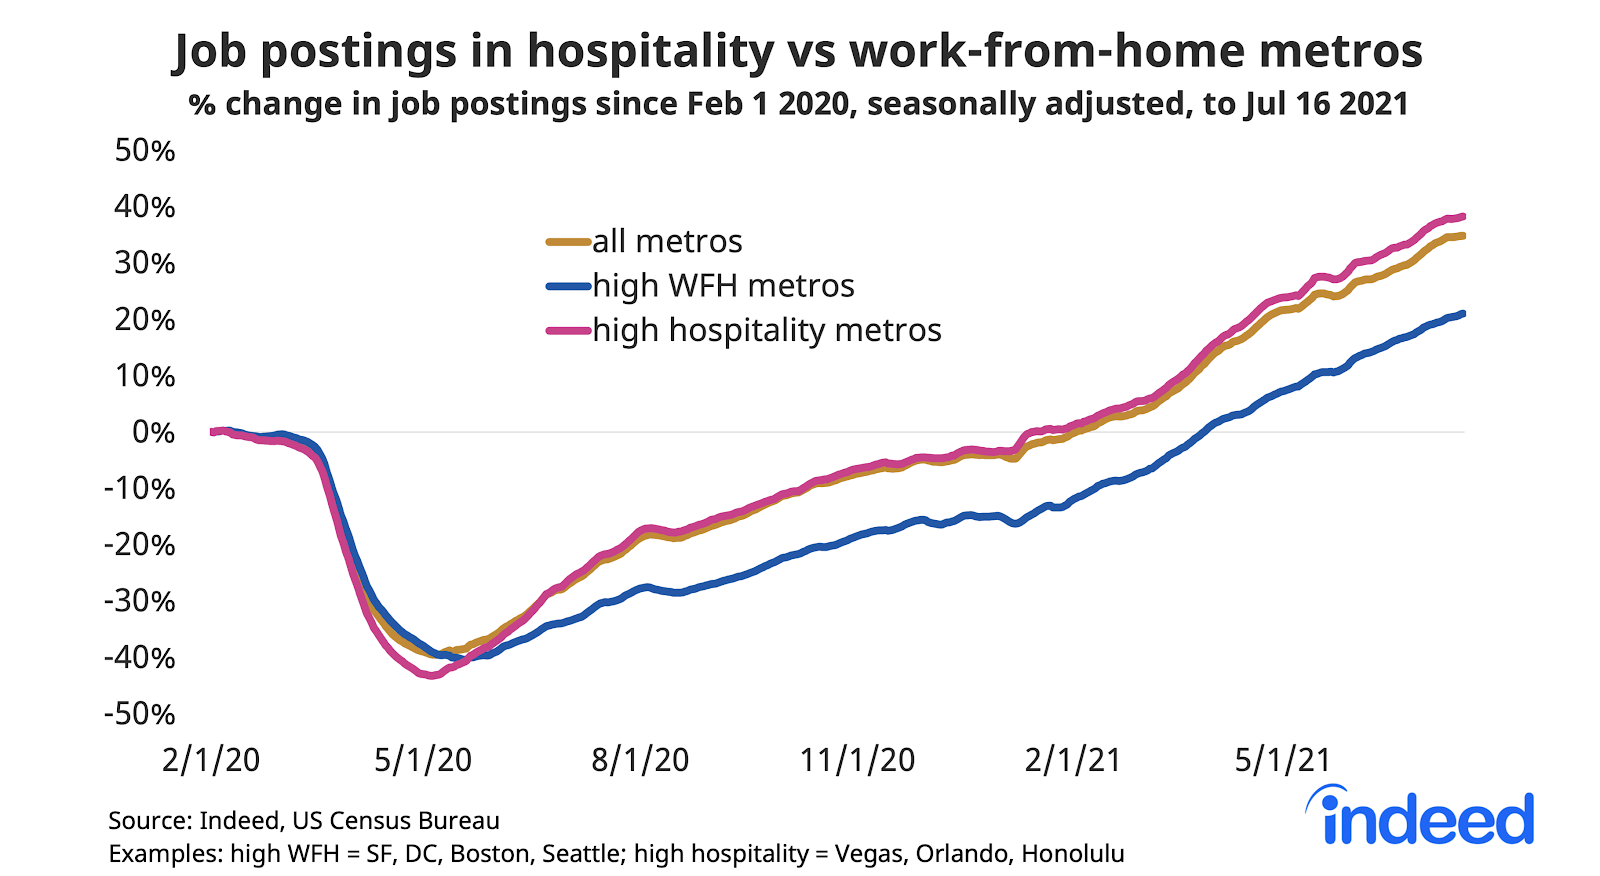
Job postings fell more initially in travel and tourism destinations. But job postings have rebounded more slowly in metros where a higher share of jobs can be done from home. In high work-from-home metros, postings in retail, restaurant, and personal-services jobs suffered. Postings in these metros finally rose above the pre-pandemic baseline at the end of March.
Local vaccination rates and job postings
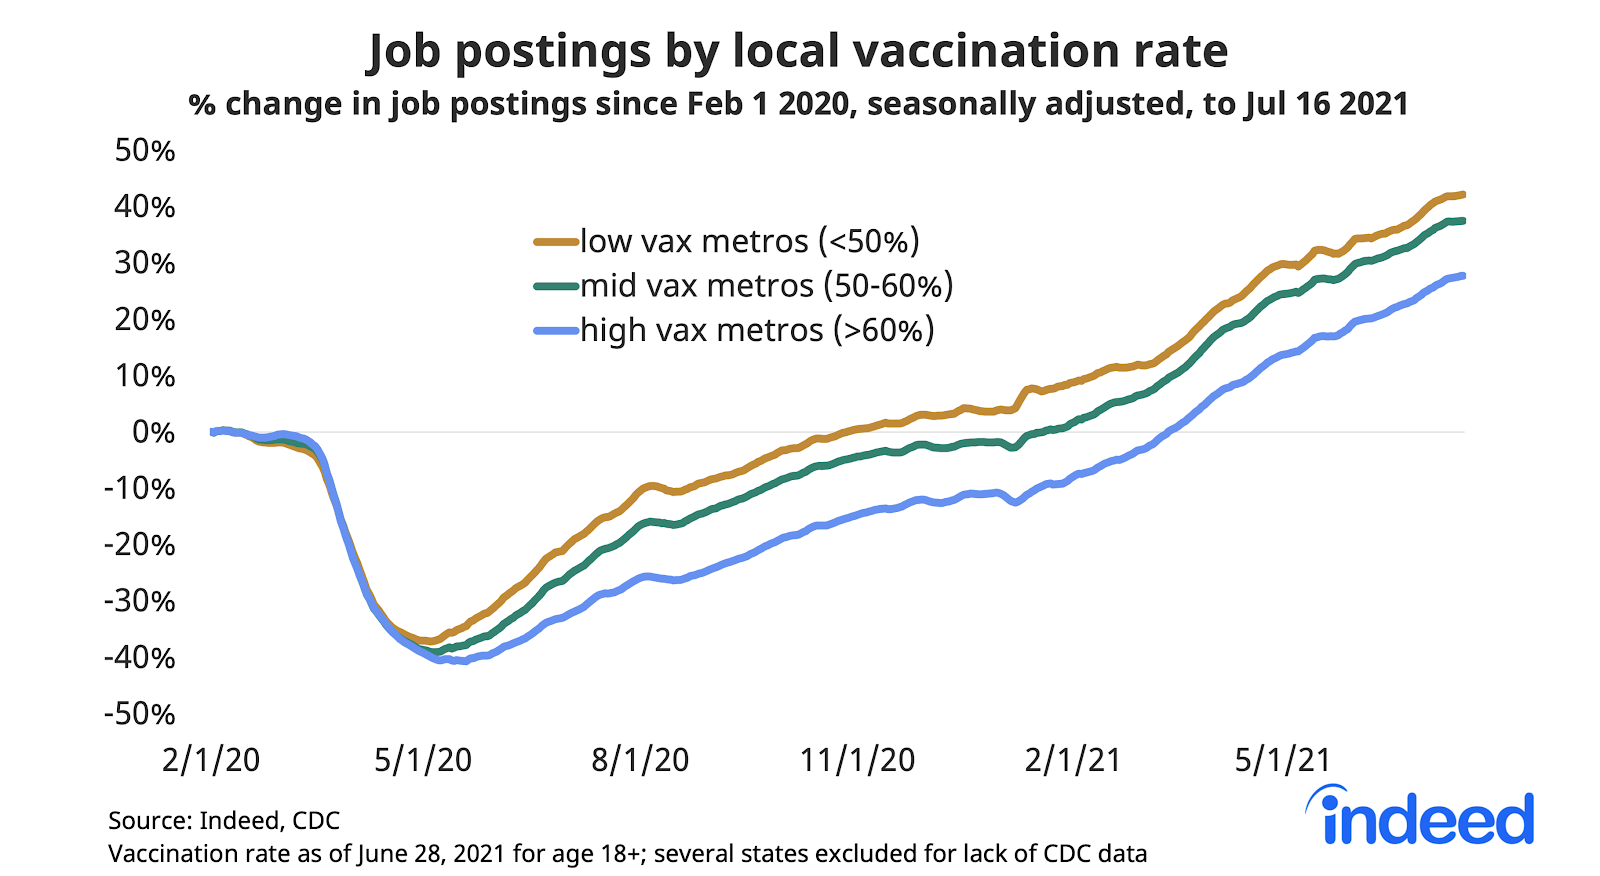
Job postings have increased less in metros with higher vaccination rates. In metros where fewer than 50% of adults were fully vaccinated as of June 28, job postings were 42% above the pre-pandemic baseline, versus 28% in metros where more than 60% of adults were fully vaccinated. High vaccination metros tend to be larger and have more jobs in sectors where people can work from home — both of which have been associated with slower growth in job postings throughout the recovery.
Since vaccines became widely available in late spring, job postings have increased at a similar rate in low, medium, and high vaccination metros.
We host the underlying job-postings chart data on Github as downloadable CSV files. Typically, it will be updated with the latest data one day after this blog post was published.
Methodology
All figures in this blog post are the percentage change in seasonally-adjusted job postings since February 1, 2020, using a seven-day trailing average. February 1, 2020, is our pre-pandemic baseline. We seasonally adjust each series based on historical patterns in 2017, 2018, and 2019. Each series, including the national trend, occupational sectors, and sub-national geographies, is seasonally adjusted separately. We adopted this new methodology in January 2021. Data for June 24-30, 2021, are missing and were interpolated.
Indeed no longer allows Colorado jobs that ask the candidate to disclose their previous salaries. This has a meaningful effect on our postings in the state of Colorado and its metros, though not on our national totals.
The number of job postings on Indeed.com, whether related to paid or unpaid job solicitations, is not indicative of potential revenue or earnings of Indeed, which comprises a significant percentage of the HR Technology segment of its parent company, Recruit Holdings Co., Ltd. Job posting numbers are provided for information purposes only and should not be viewed as an indicator of performance of Indeed or Recruit. Please refer to the Recruit Holdings investor relations website and regulatory filings in Japan for more detailed information on revenue generation by Recruit’s HR Technology segment.