
Key points:
- In many high-tech industries, tech workers have declined as a share of all workers.
- Meanwhile, other industries, such as finance, energy, and retail, have seen rapid growth in the shares of their workers in tech jobs.
- Tech-intensive companies are still hiring tech workers, but a growing share of their jobs are now in marketing, sales, and other non-tech occupations.
In today’s labor market, tech jobs are spreading ever more widely throughout the economy. While tech jobs have never just been in tech, increasingly tech workers have options outside traditional high-tech companies. Of course, many tech jobs are at the likes of Google, Apple, Microsoft, and other companies with tech-heavy workforces. But tech work is growing everywhere. Retailers are employing more web programmers to build ecommerce sites, banks are staffing up with data scientists for auditing, and utilities are hiring computer hardware engineers to build systems to monitor energy use.
Tech jobs as a share of all jobs rose 17% between 2012 and 2017, from 2.8% to 3.3%. But in many high-tech industries, tech workers actually declined as a share of all workers. Meanwhile, some industries outside the tech sector have seen rapid growth in the share of their workforces in tech jobs. Tech-intensive companies are still hiring plenty of tech workers, but a growing share of their jobs are now in the form of marketers, salespeople, and other non-tech occupations.
Top tech occupations and tech-intensive industries
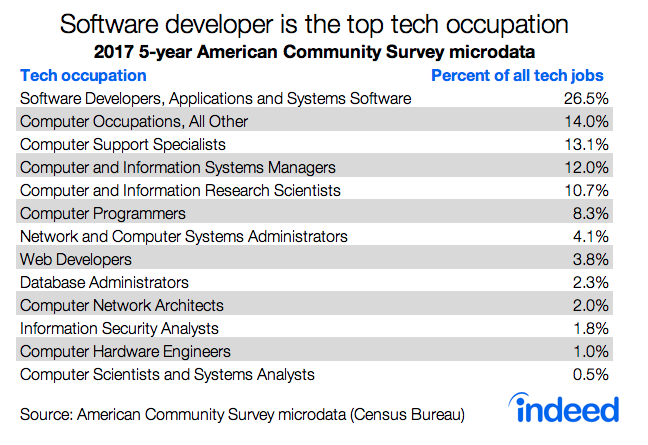
To be classified as tech, a job generally involves development or direct application of software, computers, or other information technology tools. Software developer — which is a combination of two sub-occupations, for Applications and Systems Software — is the top tech occupation, representing 27% of all tech jobs. The category Other computer occupations — such as web administrator and software quality assurance engineer — is second at 14%, followed by support specialist and tech manager at 13% and 12%, respectively. Further down the list are web developer, database administrator, and hardware engineer.
There is a distinction between occupations and industries. A job is what an individual worker does, while an industry is what good or service the establishment produces. Industries vary in the share of workers in tech occupations. “Computer systems design and related services” — think IBM and Oracle — is by far the largest industry employing tech workers. In it, 58% of all workers are in tech occupations. The next most tech-worker-intensive industry is “Software publishing,” with a tech worker share of 40%. The table below lists the top 10 high-tech industries.
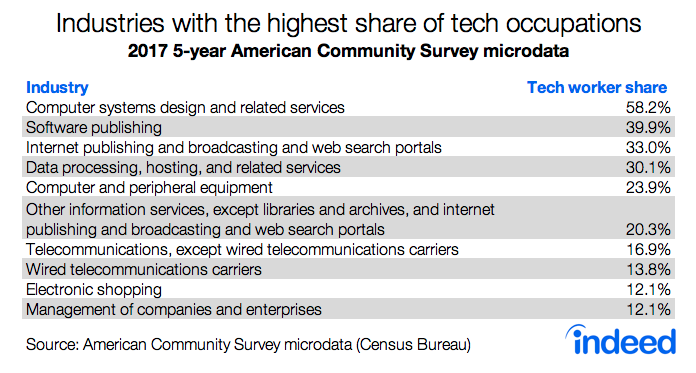
Outside computer systems design, most employees in high-tech industries are not tech workers. Even in the awkwardly named industry “Other information services except libraries and archives, and internet publishing and broadcasting” — a catch-all that includes parts of such tech giants as Google, Facebook, and Twitter — tech workers represent just 20% of all employees. Notably, in “Electronic shopping” (ecommerce), just 12% of workers are in tech roles. Industries outside the top 10 include “Videotape and disk rental,” which includes streaming companies like Netflix, at 11%; finance industries like banking and investment funds at around 9%; as well as the aerospace and utilities industries.
Tech jobs are a growing share of all jobs, but not in several high-tech industries
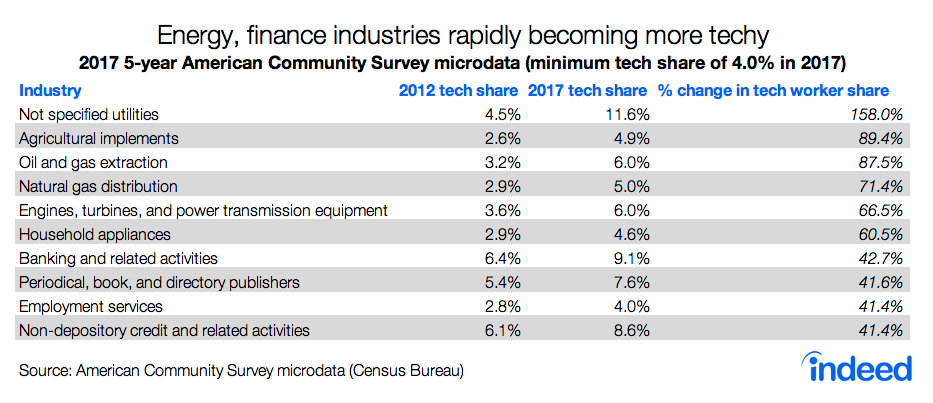
In the economy as a whole, tech jobs make up a rising share of employment. In 2012, tech occupations accounted for 2.8% of all jobs, but by 2017 their share had risen to 3.3%. A large part of this growth comes from what might be called “techification” of less tech-intensive industries. Several energy-related industries lead the way. The share of workers with a tech job at “Oil and gas extraction” companies nearly doubled between 2012 and 2017, rising from 3.2% to 6.0%. Banking and other finance industries have high and quickly rising shares of tech workers, too. And the tech worker share of “Employment services” rose 41%. The table below lists the 10 industries with at least 4% of tech workers that had the fastest increases in the share of workers in tech jobs over the five-year period.
By contrast, the workforces of several industries heavily concentrated in tech are actually becoming less techy. Four of the 10 most high-tech industries (including the top two) posted a relative decline in their shares of tech workers. To be sure, these high-tech industries are still adding tech workers at a strong pace. But they’re hiring for other roles, such as marketers, accountants, and salespeople, at an even more rapid rate. In absolute terms, tech workers in the top 10 high-tech industries increased 34%, but non-tech workers rose 37%. The result — a lower share of tech workers.
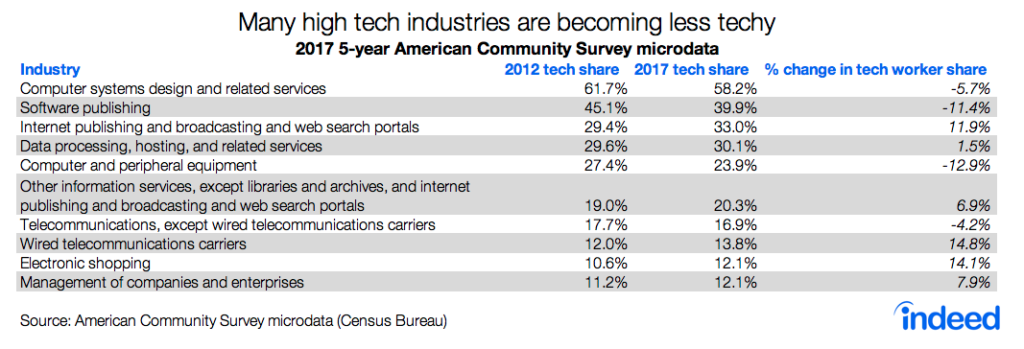
That said, a few of the highest tech industries saw their share of tech jobs grow strongly. Between 2012 and 2017, the share of tech workers in “Internet publishing and broadcasting and web search portals” rose from 29% to 33%, a nearly 12% increase. This industry covers digital news agencies like the Huffington Post or Newsweek, as well as other businesses. As the state of journalism jobs turns direr, the digital newsroom is becoming even more digital. The other high tech industry becoming techier is the aforementioned “Other information services,” which grew its tech worker share nearly 7%. Other industries also became more tech-intensive, like “Electronic shopping” (ecommerce), up 14%, and “Wireless telecommunications carriers,” up 15%.
What this all means is several industries with a high share of tech workers are proportionally hiring more non-tech workers, while some lesser-tech industries are hiring proportionally more tech workers. Increasingly, people who want tech jobs have options beyond Silicon Valley and its fellow tech centers.
Tech jobs are a growing share of all jobs, but not in all high-tech industries. Thus on the margin, many high-tech companies are looking for salespeople, marketers, accountants, and other non-tech specialists. That means job seekers increasingly can break into tech companies without learning code.
Conversely, tech workers have more options outside traditional high-tech companies. For example, banks, energy companies, and news organizations are hiring greater numbers of software developers and data scientists. Tech jobs have never been just in tech, but they are becoming ever more prevalent in almost every industry.
Methodology
The year 2012 refers to data from the 2008-12 5-year American Community Survey (ACS) microdata and 2017 refers to the 2013-17 5-year ACS microdata.
The Bureau of Labor Statistics has a taxonomy of occupations, the Standard Occupational Classification. We chose 15 tech occupations from it. Included are all occupations in the category of “computer occupations” (SOC 15-1000), along with “computer and information systems managers” (SOC 11-3020) and “computer hardware engineers” (SOC 17-2060). Using microdata from the 2017 5-year ACS, those 15 SOC occupations collapse into 13 occupation categories, as coded by the OCCSCO variable, according to this crosswalk.
We only calculated the share of tech workers for industries with at least an estimated 1,000 tech workers. Only employed respondents were counted.
IPUMS citation: Steven Ruggles, Sarah Flood, Ronald Goeken, Josiah Grover, Erin Meyer, Jose Pacas, and Matthew Sobek. IPUMS USA: Version 9.0 [dataset]. Minneapolis, MN: IPUMS, 2019. https://doi.org/10.18128/D010.V9.0