Editor’s Note: Wage growth series are available for download here. For details of the data and methodology, please see our research paper, “What do wages in online job postings tell us about wage growth?”
Key Points:
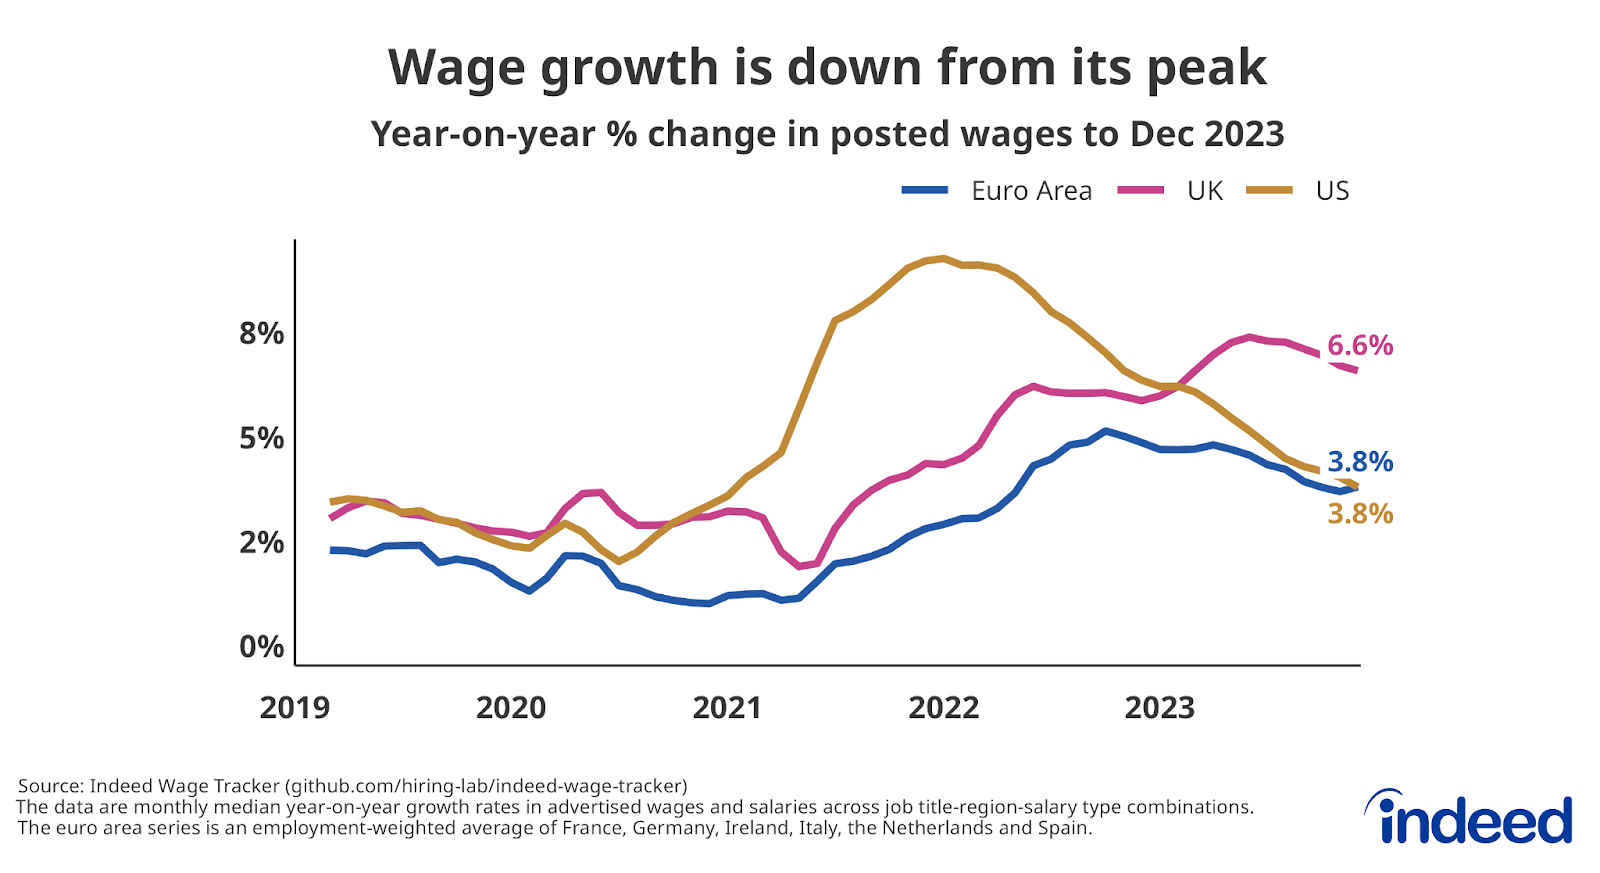
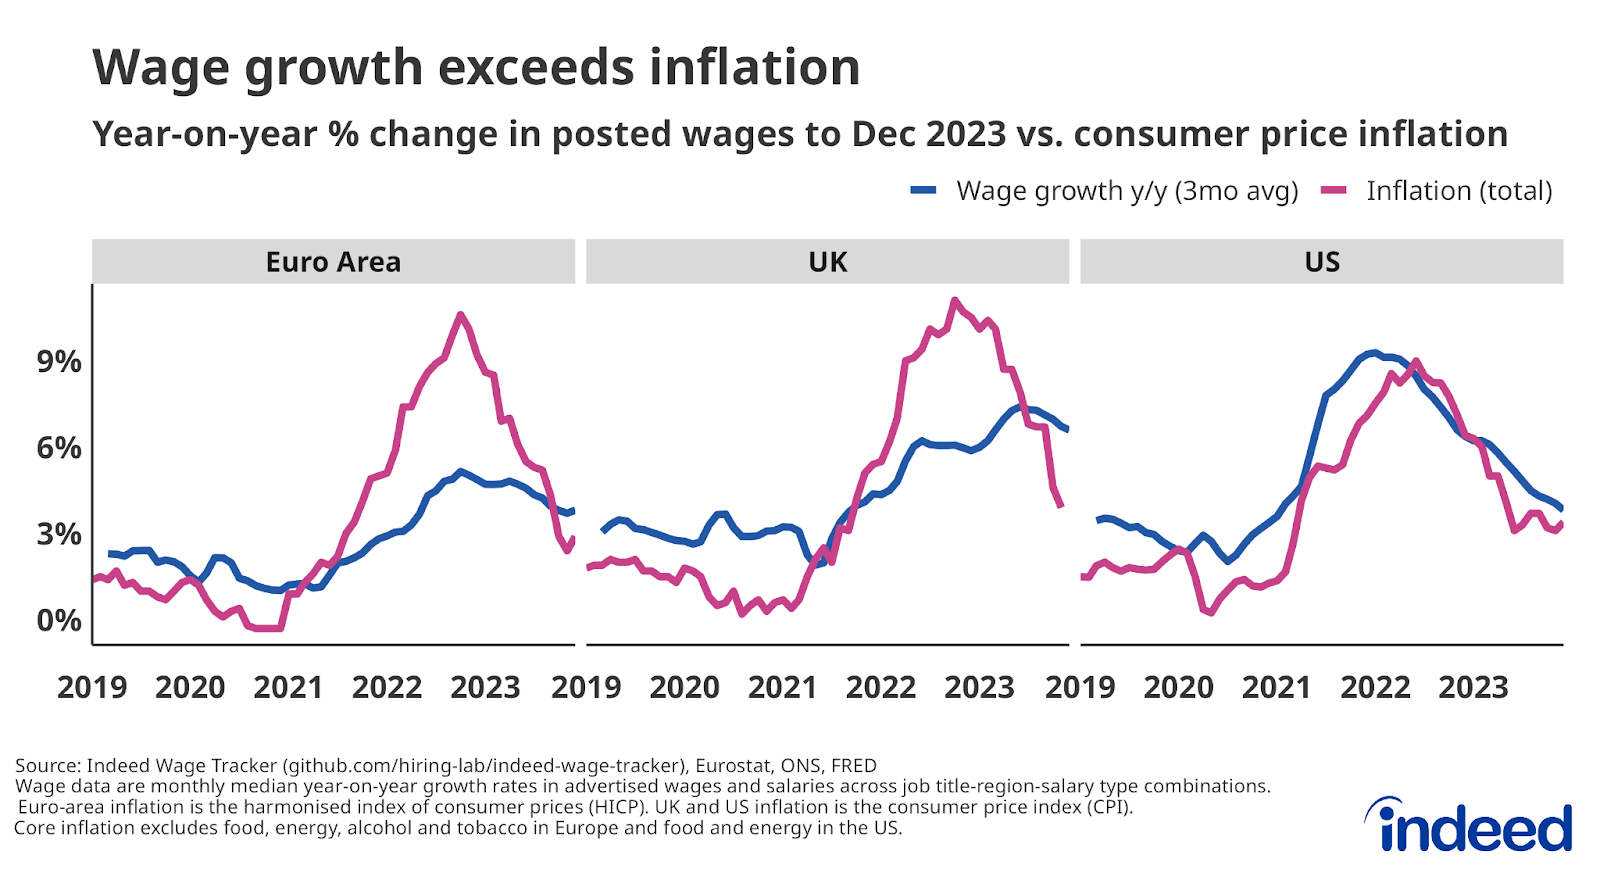
- Wage growth in job postings slowed during 2023 in the US, UK, and most euro area countries tracked by Indeed. Wages, as measured by the Indeed Wage Tracker, grew at an annual rate of 3.8% in the US, 6.6% in the UK, and 3.8% in the euro area in December 2023.
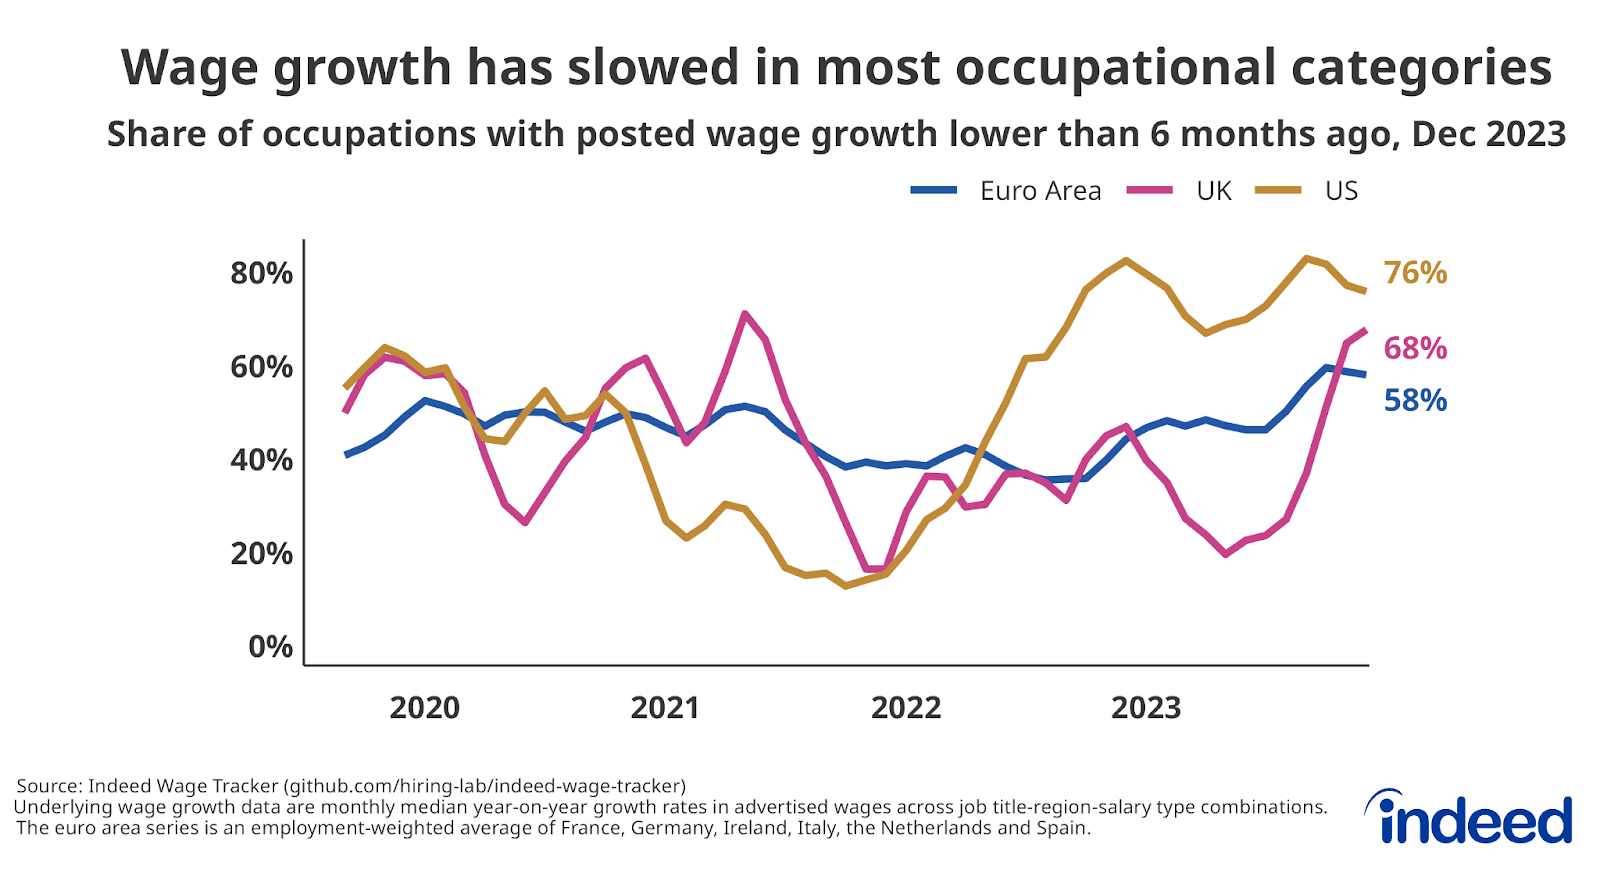
- The slowdown in wage growth was broad-based, with 76% of occupational categories in the US, 68% in the UK, and 58% in the euro area seeing lower growth rates in December compared to June.
- Wage growth remains above pre-pandemic levels but is expected to continue to slow in 2024, approaching levels more compatible with the European Central Bank’s and the US Federal Reserve’s inflation targets.
Annual wage growth in the euro area, the UK, and the US slowed in the final months of 2023, according to year-end data from the Indeed Wage Tracker, a welcome sign of further normalisation in job markets worldwide after years of volatility. The pace of wage growth is a crucial indicator followed closely by central banks as they continue to worry about still-high (albeit declining) inflation and monitor activity in labour markets that largely remain resilient and tight despite an ongoing slowdown.
Wage growth has slowed
Typical advertised wages in the UK ended the year 6.6% higher than the year prior, more than twice the 2019 average annual growth rate of 3.1%, but below the June 2023 peak of 7.4%. Annual wage growth in the US was at 3.8% following a steady decline over the past two years. In the euro area, the employment-weighted average annual wage growth in the six countries tracked by the Indeed Wage Tracker ended the year up 3.8%, well below its 2022 peak of 5.2%.
Wage growth in the UK remains high and well above the Bank of England’s comfort zone, as both Indeed data and the latest ONS figures suggest. In the euro area, the ECB’s Chief Economist has suggested that 3% annual wage growth is consistent with the bank’s 2% inflation target, a mark that may be within reach. But the path to a 3% rate of nominal wage growth is likely to be bumpy. Upcoming and in-progress collective bargaining agreements for some euro-area workers may take time to adjust to the past inflation surge, while some of the agreements that have already been struck incorporate future increases.
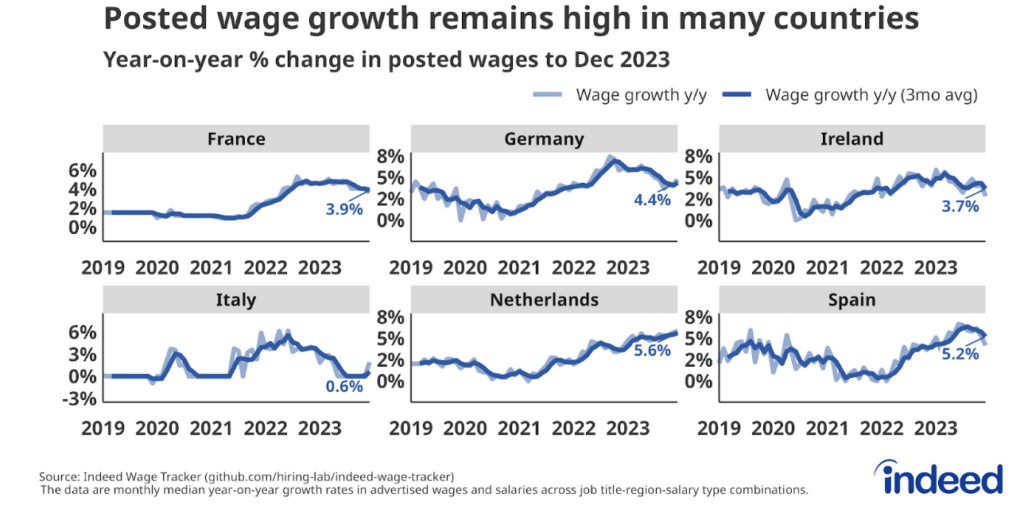
While the euro-area average suggests a general slowdown in wage growth in the bloc, the trends differ by country. As of December, annual growth in posted wages was 5.6% in the Netherlands, a historic high, and the highest growth rate among all individual countries tracked. Annual wage growth ticked up to 4.4% and 0.6% in Germany and Italy, respectively, but remained below 2022 peaks. In France, Ireland and Spain, wage growth also remained below peak rates, having slowed to 3.7%, 3.9%, and 5.2%, respectively.
Wage growth has slowed in most occupational categories
It’s important to consider whether the recent deceleration in wage growth is a broad-based phenomenon or if it reflects slower wage growth in a few occupations where the labour market may have become less tight. To assess this, we have re-estimated the wage tracker for each of Indeed’s 54 occupational categories and, for each month in our time series, calculated how many of those categories saw lower wage growth than six months earlier.
In the US, wage growth was slower in December than in June in 76% of those occupations. In the UK and euro area, where overall wage growth also appears to have peaked, the respective figures are 68% and 58%. In other words, the slowdown is apparent in most occupational categories, suggesting it is not a niche phenomenon.
Broadly speaking, wage growth was highest in lower-paid service occupations, where job postings have also held up most strongly during the year. In the UK, for instance, the occupations with the highest annual wage growth in 2023 were childcare (10.1%), cleaning & sanitation (8.6%), and retail (8.1%). The UK sector with the lowest year-on-year wage growth was software development (1.6%), where postings declined substantially during the year. Trends in the euro area were broadly similar: care, cleaning & sanitation, driving, loading & stocking, and food preparation & service were among the categories with the highest wage growth in 2023 in many of the countries tracked.
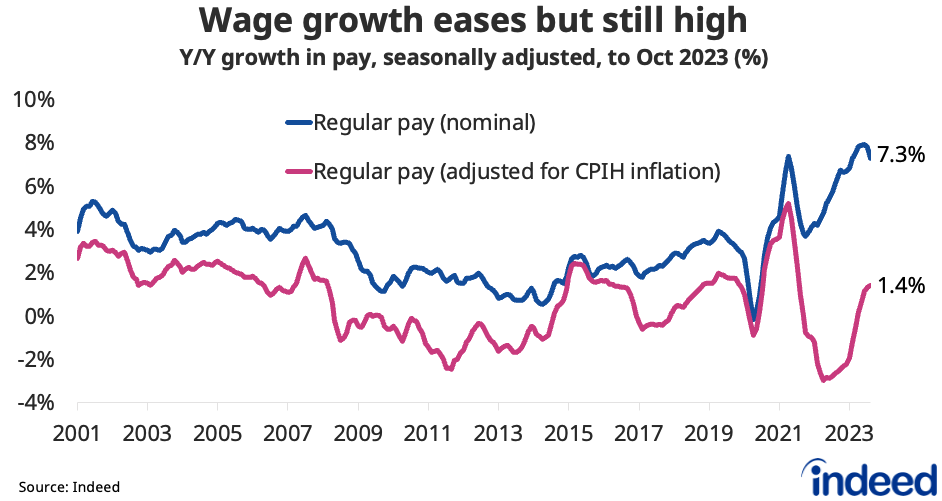
Real wage growth is back in positive territory
The good news for workers and job seekers is the return of real wage growth. Wages in job postings aren’t growing as fast as they used to, but inflation — which can diminish purchasing power for consumers if it grows more quickly than wages — has fallen even further. The annual pace of wage growth needs to stay higher than the annual pace of inflation in 2024 if real wages are to make up for losses incurred over the past few years when inflation outpaced wage growth.
Outlook for wage growth
At the end of 2023, growth in advertised wages remained above historical levels in the UK, the US, and most of the euro-area countries tracked by Indeed. However, given the broad-based nature of the slowdown in the second half of last year, and the softening of other labour market metrics — including job posting levels in many countries — we expect wage growth to keep moderating in 2024. A tangible slowdown in wage growth will be a focus for central bankers as they decide if and when to start reducing interest rates that they initially pushed up in order to bring inflation down. Wage growth at rates broadly similar to pre-pandemic norms would make decisions to loosen monetary policy — in other words, to cut rates — more palatable.
Methodology
To calculate the average rate of wage growth, we follow an approach similar to the Atlanta Fed US Wage Growth Tracker, but we track jobs, not individuals. We begin by calculating the median posted wage for each country, month, job title, region and salary type (hourly, monthly or annual). Within each country, we then calculate year-on-year wage growth for each job title-region-salary type combination, generating a monthly distribution. Our monthly measure of wage growth for the country is the median of that distribution. Alternative methodologies, such as the regression-based approaches in Marinescu & Wolthoff (2020) and Haefke et al. (2013) produce similar trends.
The euro-area figures are an employment-weighted average of growth rates in France, Germany, Ireland, Italy, the Netherlands, and Spain. The weights for the most recent months are revised periodically as new employment figures are published by Eurostat. We currently use the weights from Q3 2023.
More information about the data and methodology is available in a research paper by Pawel Adrjan and Reamonn Lydon, What Do Wages in Online Job Postings Tell Us about Wage Growth?, forthcoming in Research in Labor Economics.