
Key Points:
- Vacancies and job postings retreat further from peaks.
- Wage growth remains high but may have peaked.
- Concern over accuracy of official employment figures muddies waters for policymakers.
There are further signs of softening in the UK labour market, with vacancies continuing to fall and indications that strong wage growth may have peaked. But it’s difficult to get a rounded picture amid doubts over the reliability of official figures, with statisticians unable to give strong assurances on the accuracy of several key indicators.
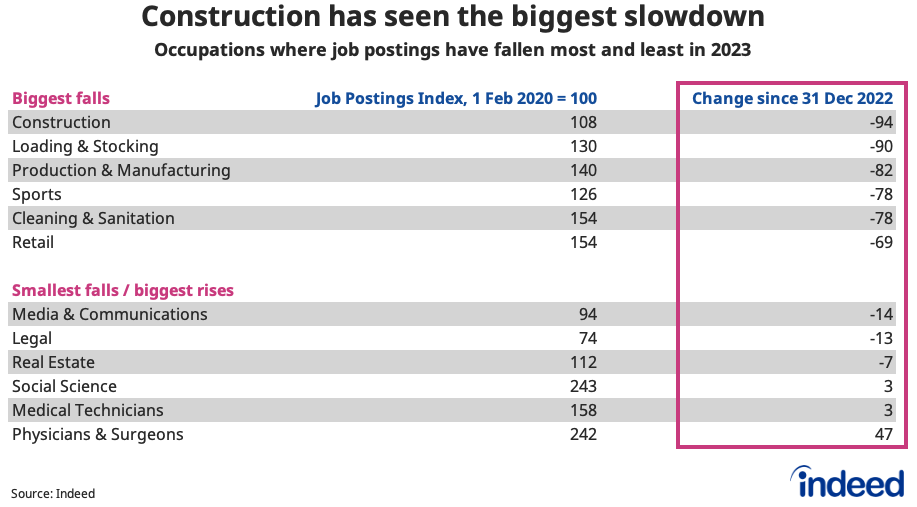
Spotlight: Construction, manufacturing and distribution have seen the biggest job postings slowdowns this year
Job postings have retreated from peaks in 2023. Overall postings have fallen 25% since the start of the year, though remain 10% above their 1 February 2020, pre-pandemic baseline, as of 20 October 2023. Postings had been plateauing over the summer but have started to fall again in recent weeks amid signs of a faltering economy, dropping 3% in the past month.
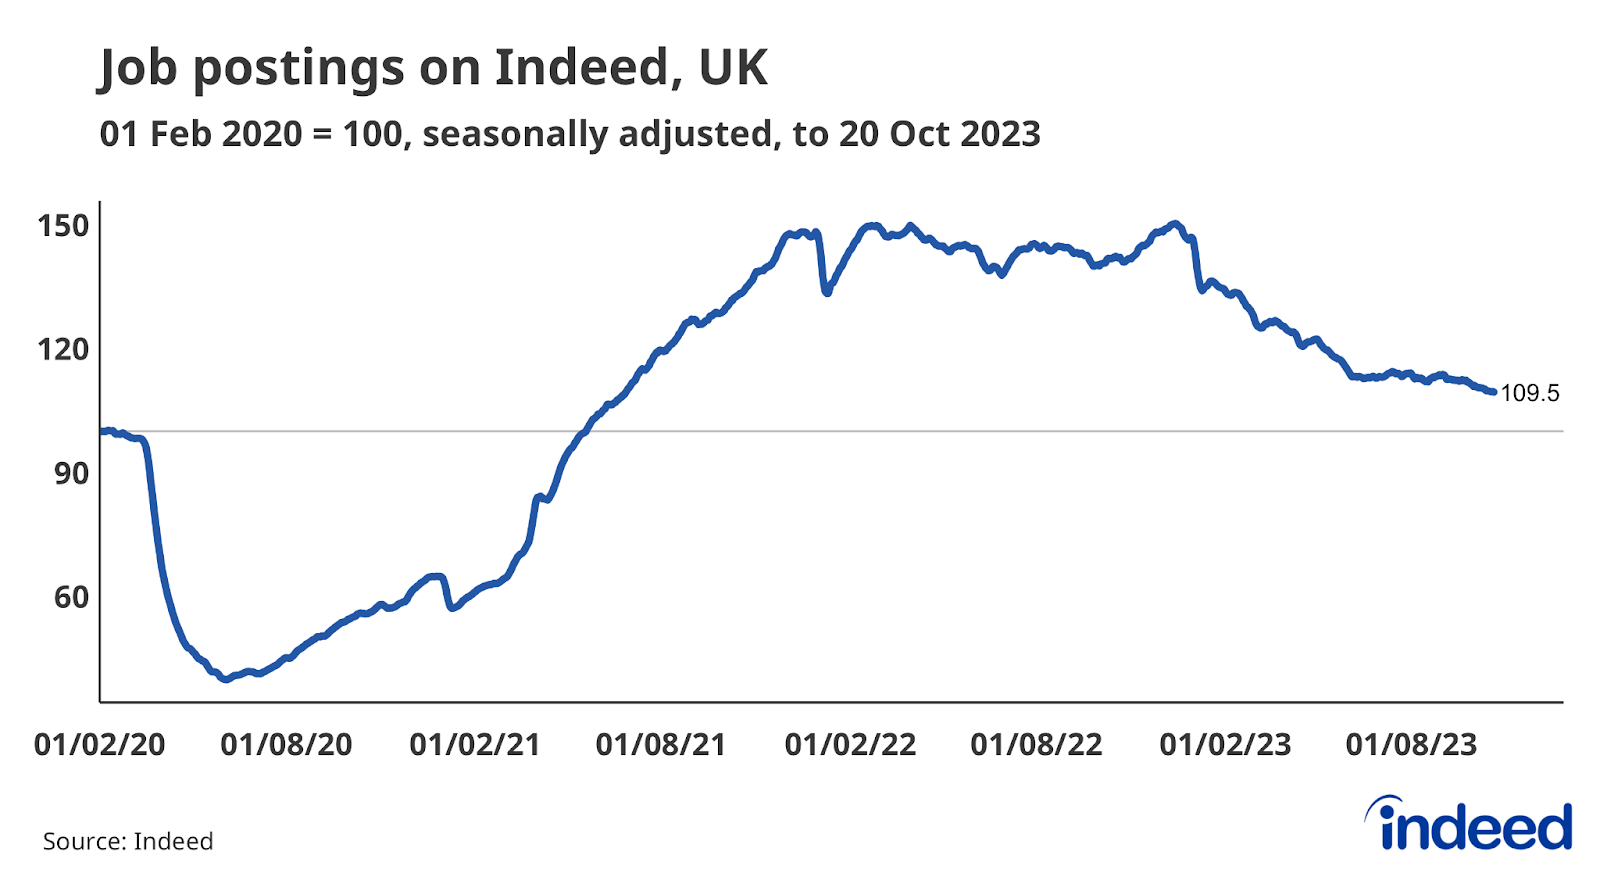
Nearly all categories have seen falls, with the biggest decline seen in construction (albeit postings remain 8% above the baseline). The sector has been hit hard by the impact of rising interest rates, with residential construction activity in particular having slowed sharply. Loading & stocking and production & manufacturing have seen the next-sharpest declines, though in both cases postings remain comfortably above pre-pandemic levels.
Only three categories have seen increases, with two being in the healthcare sector (physicians & surgeons and medical technicians) alongside social science (a category which includes psychologists, researchers, librarians and economists).
Labour Market Overview
Wages have risen the most in real terms in nearly two years, delivering workers a much-needed boost after a prolonged period of erosion. With inflation continuing to fall back, real wages grew by 1.1% y/y, the strongest since late-2021.
Overall, regular pay growth remained close to a record high in the three months to August at 7.8% year-over-year, ticking down from 7.9% in the previous period.
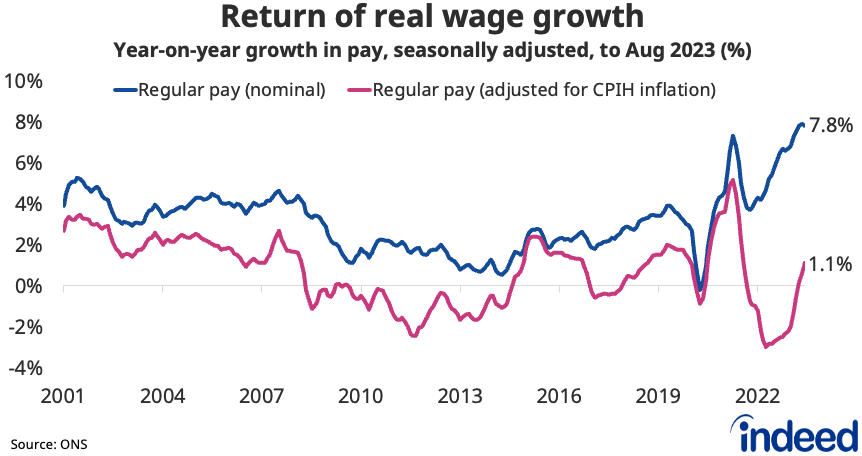
Public sector regular wage growth hit a record high at 6.8% y/y, though it trails the private sector, which recorded 8.0%. One-off NHS bonuses following the recent pay deal drove public sector wages including bonuses up by a record 12.5%.
Wage growth remains a crucial metric for the Bank of England in assessing the persistence of domestically generated inflation and hence prospects for interest rates.
While the strength of wage growth means policymakers need to remain vigilant, more recent data from the Indeed Wage Tracker offers them hope that pay pressures may be starting to cool. Growth of advertised pay for new hires eased in September on both the single-month and three-monthly measures (7.3% y/y to 7.1% on 3m measure and 7.3% to 6.9% on single month).
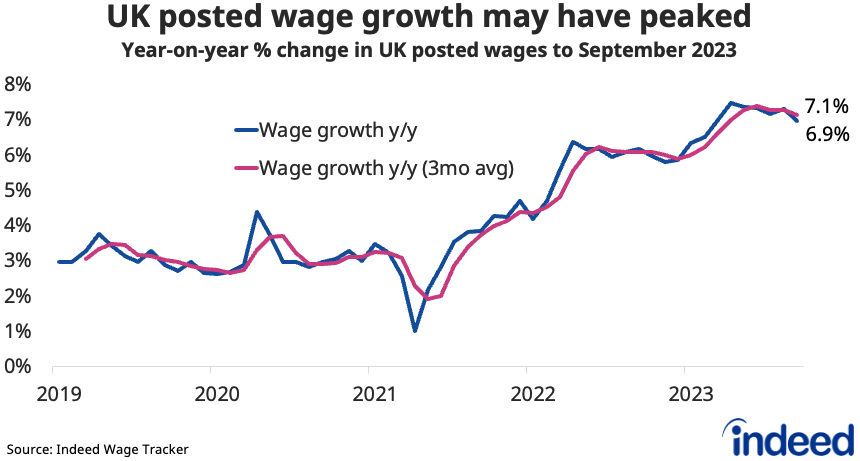
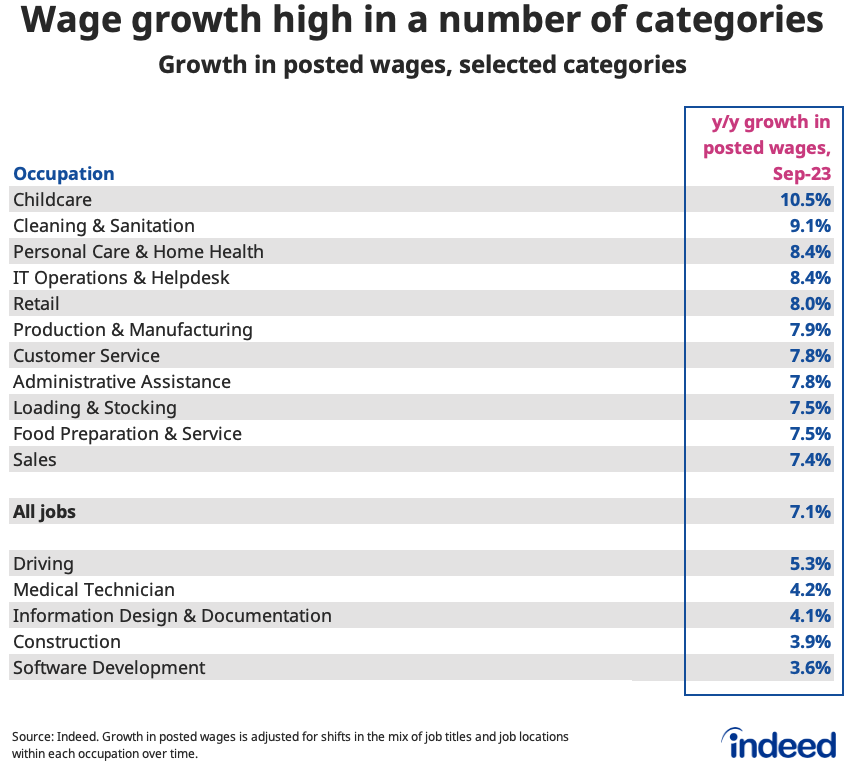
Wage growth remains high in a number of categories though, led by childcare (10.5% y/y), cleaning (9.1%) and care (8.4%). It’s well down from peaks though in categories including driving, construction and tech.
Labour demand continues to gradually fall back from last year’s peaks. Vacancies dropped for the fifteenth consecutive period in the three months to September to 988,000 and are down 24% from their peak. The continued rebalancing of the labour market should take some of the heat off wage growth in coming months.
Concern over accuracy of official figures
Meanwhile, the publication of some ONS labour market figures was delayed by a week amid concern over a persistent fall in response rates to its flagship Labour Force Survey, on which several of the headline indicators are based. The latest estimates of employment, unemployment and inactivity have been downgraded to ‘experimental’ statistics, reflecting concerns over their accuracy.
In particular, the headline measure of employment has sharply diverged from alternative measures based on business surveys and income tax records. Such concerns could cause headaches for policymakers such as those at the Bank of England, who are closely assessing labour market strength as a key determinant of interest rate decisions.
Notwithstanding those concerns, the figures in question suggested at face value that the labour market continued to cool in the three months to August, with the employment rate dipping and the unemployment rate continuing to gradually rise (to 4.2%).
Conclusion
Concerns over the validity of official figures mean it’s hard to confidently assess the current strength of the labour market, but assessing the range of evidence points to a continued gradual cooling. Wage growth remains high for the time being, but we may be past the peak, which would reassure the Bank of England that inflationary pressures aren’t worsening even if they remain well above levels consistent with their target. Workers meanwhile are finally getting some respite as real wage growth has entered positive territory after a prolonged period in which their earnings have been squeezed by high inflation.
Hiring Lab Data
We host the underlying job-postings chart data on Github as downloadable CSV files. Typically, it will be updated with the latest data one day after this blog post was published.
Methodology
The Indeed Job Postings Index is a daily measure of labour market activity that is updated and will continue to be released weekly, superseding the Job Postings Tracker. The primary difference between the Indeed Job Postings Index and the legacy Job Postings Tracker is the level. The Indeed Job Postings Index is set to 100 on February 1, 2020, and this effectively provides a uniform level shift of 100 to the existing Job Postings Tracker across all time points.
To calculate the average rate of wage growth, we follow an approach similar to the Atlanta Fed US Wage Growth Tracker, but we track jobs, not individuals. We begin by calculating the median posted wage for each country, month, job title, region and salary type (hourly, monthly or annual). Within each country, we then calculate year-on-year wage growth for each job title-region-salary type combination, generating a monthly distribution. Our monthly measure of wage growth for the country is the median of that distribution.
The number of job postings on Indeed.com, whether related to paid or unpaid job solicitations, is not indicative of potential revenue or earnings of Indeed, which comprises a significant percentage of the HR Technology segment of its parent company, Recruit Holdings Co., Ltd. Job posting numbers are provided for information purposes only and should not be viewed as an indicator of performance of Indeed or Recruit. Please refer to the Recruit Holdings investor relations website and regulatory filings in Japan for more detailed information on revenue generation by Recruit’s HR Technology segment.