
Key Points:
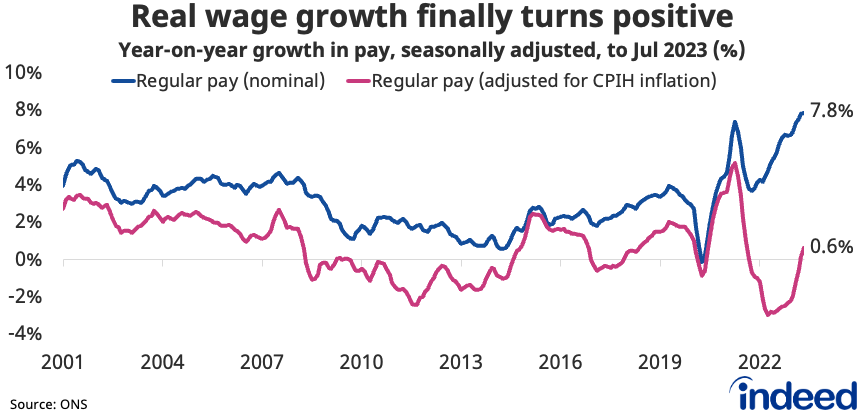
- Regular pay growth remains at a record 7.8% year-on-year pace.
- Vacancies fall below one million for the first time in over two years.
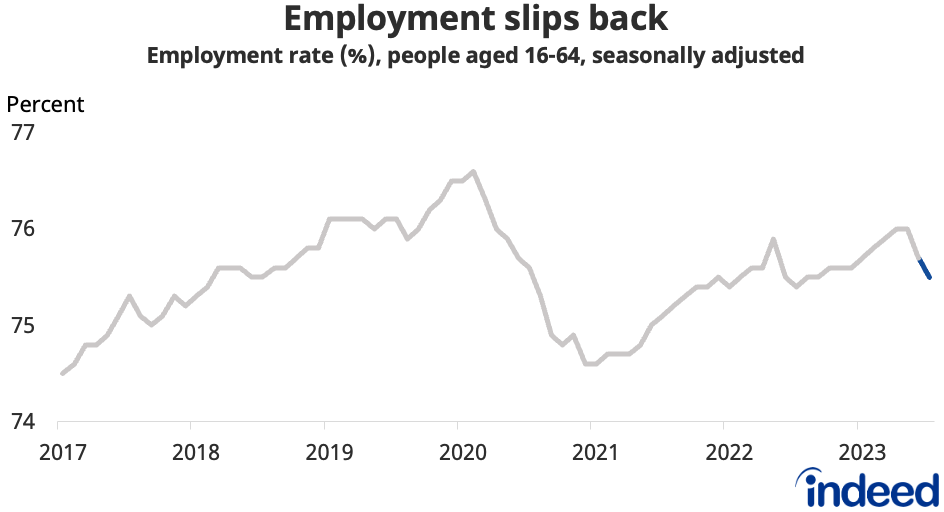
- Employment drops while jobless rate rises, as labour market shows further cooling.
The UK labour market continues to lose steam, but that’s still not translating into weaker pay growth. Instead, wages are rising at a record pace. That’s good news for workers, who are finally seeing pay rising faster than consumer prices after a prolonged period of falling real wages. But wage growth remains well above the level that policymakers at the Bank of England are comfortable with as they seek to calm inflationary pressures.
Spotlight: Labour market tightness could continue to gradually ease
Though it has been softening, the labour market remains tight overall, with just 1.4 unemployed jobseekers per vacancy (up from 0.9 last summer). Looking ahead, we anticipate this metric could gradually drift upwards towards its 20-year average by 2026, assuming vacancies continue to fall back towards historic averages around 680k and looking at unemployment projections from the Bank of England (peaking at 4.8%) and OBR (peaking at 4.4%).
That implies hiring becoming gradually easier but happening more slowly than in past downturns (barring a sharper-than-expected slowing in the economy). While that would be decent news for jobseekers, it could help support upward pressure on wages for a while yet.
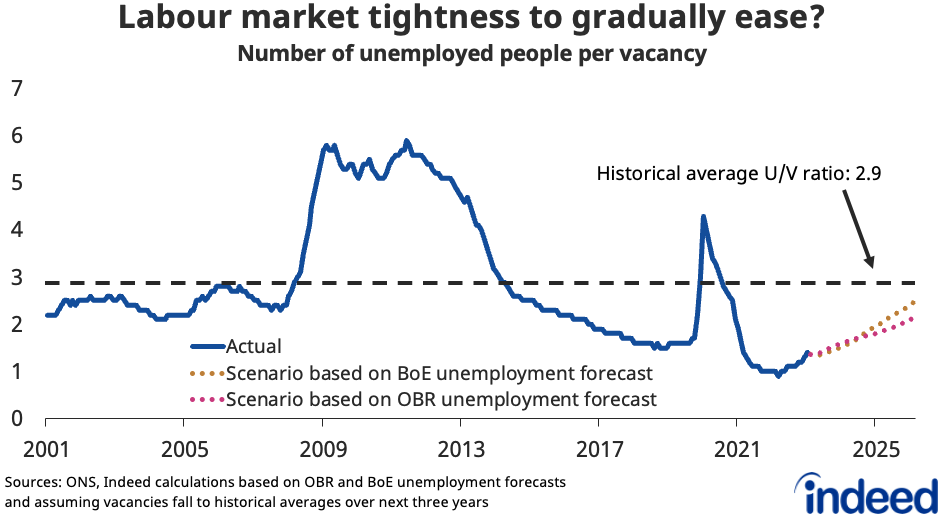
Line chart titled “Labour market tightness to gradually ease?” shows the ratio of unemployed people for each vacancy. The ratio has risen in recent months but remains historically low at 1.4; it could gradually rise towards historic averages over coming years based on different macroeconomic scenarios.
Labour Market Overview
Wage growth continues to run at elevated levels. Regular pay was up 7.8% year-on-year in the three months to July, matching the record pace seen in the period to June. After accounting for consumer price inflation, real wages were up 0.6% year-on-year, the best outturn since October 2021. The Indeed Wage Tracker signalled that growth of posted wages held at a record 7.3% year-on-year pace in August.
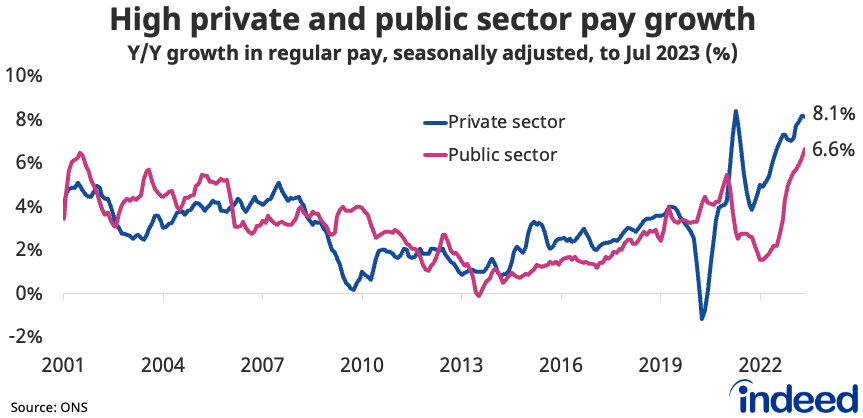
Wage growth remains high in both the private and public sectors. In the private sector, it eased marginally to 8.1% y/y but remains close to its highest outside the pandemic period. In the public sector, pay was up by a record 6.6% y/y.
But other labour market indicators point to a softening. The employment rate (based on the Labour Force Survey) dropped 0.5 percentage points to 75.5% in the three months to July, having reversed recent gains to stand at a ten-month low and having failed to return to its early-2020 level since the pandemic struck. The decline was driven by a fall in self-employment. That said, provisional administrative data based on payrolls suggested a broadly flat trend in employment, with the two data sources highlighting slightly conflicting narratives.
There was a corresponding 0.5 percentage point increase in the unemployment rate to 4.3%, which has gradually risen in recent months having hit a low of 3.5% last summer. Meanwhile, the inactivity rate ticked up to 21.1%, with declines seen late last year and early this year having stalled in recent months. Inactivity due to long-term sickness remains a key concern, having hit a new record of 2.6 million in the latest period.
Vacancies dropped below the one million mark for the first time in over two years, to 989,000 in the three months to August. Though down 24% from their peak, vacancies remain 20% above their level on the eve of the pandemic.
Conclusion
The labour market’s softening is well underway and likely to continue as the effect of past interest rate rises weigh on the economy over the coming months. But that continues to happen only gradually and wage growth remains particularly elevated for the time being. That’s uncomfortable for the Bank of England, though lower-than-expected inflation figures for August have tempered expectations for further interest rate rises.
Hiring Lab Data
We host the underlying job-postings chart data on Github as downloadable CSV files. Typically, it will be updated with the latest data one day after this blog post is published.
Methodology
The Indeed Job Postings Index is a daily measure of labour market activity that is updated and will continue to be released weekly, superseding the Job Postings Tracker. The primary difference between the Indeed Job Postings Index and the legacy Job Postings Tracker is the level. The Indeed Job Postings Index is set to 100 on February 1, 2020, and this effectively provides a uniform level shift of 100 to the existing Job Postings Tracker across all time points.
The number of job postings on Indeed.com, whether related to paid or unpaid job solicitations, is not indicative of potential revenue or earnings of Indeed, which comprises a significant percentage of the HR Technology segment of its parent company, Recruit Holdings Co., Ltd. Job posting numbers are provided for information purposes only and should not be viewed as an indicator of performance of Indeed or Recruit. Please refer to the Recruit Holdings investor relations website and regulatory filings in Japan for more detailed information on revenue generation by Recruit’s HR Technology segment.