
Key Points:
- Wage growth hits record high.
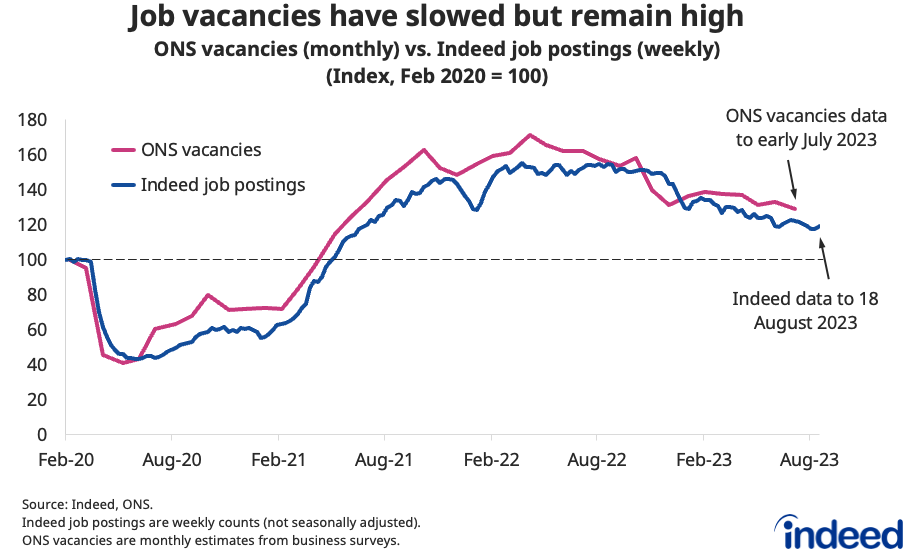
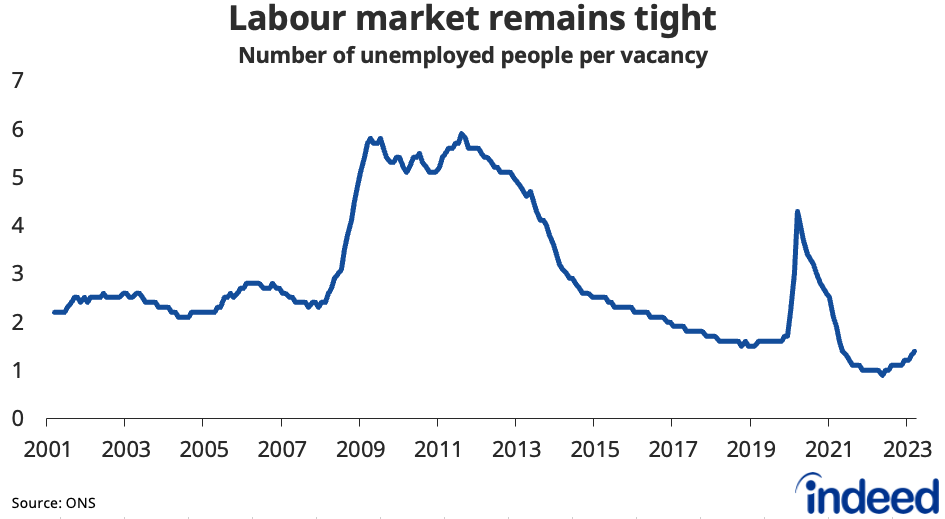
- Labour market remains tight, despite falling vacancies and rising unemployment.
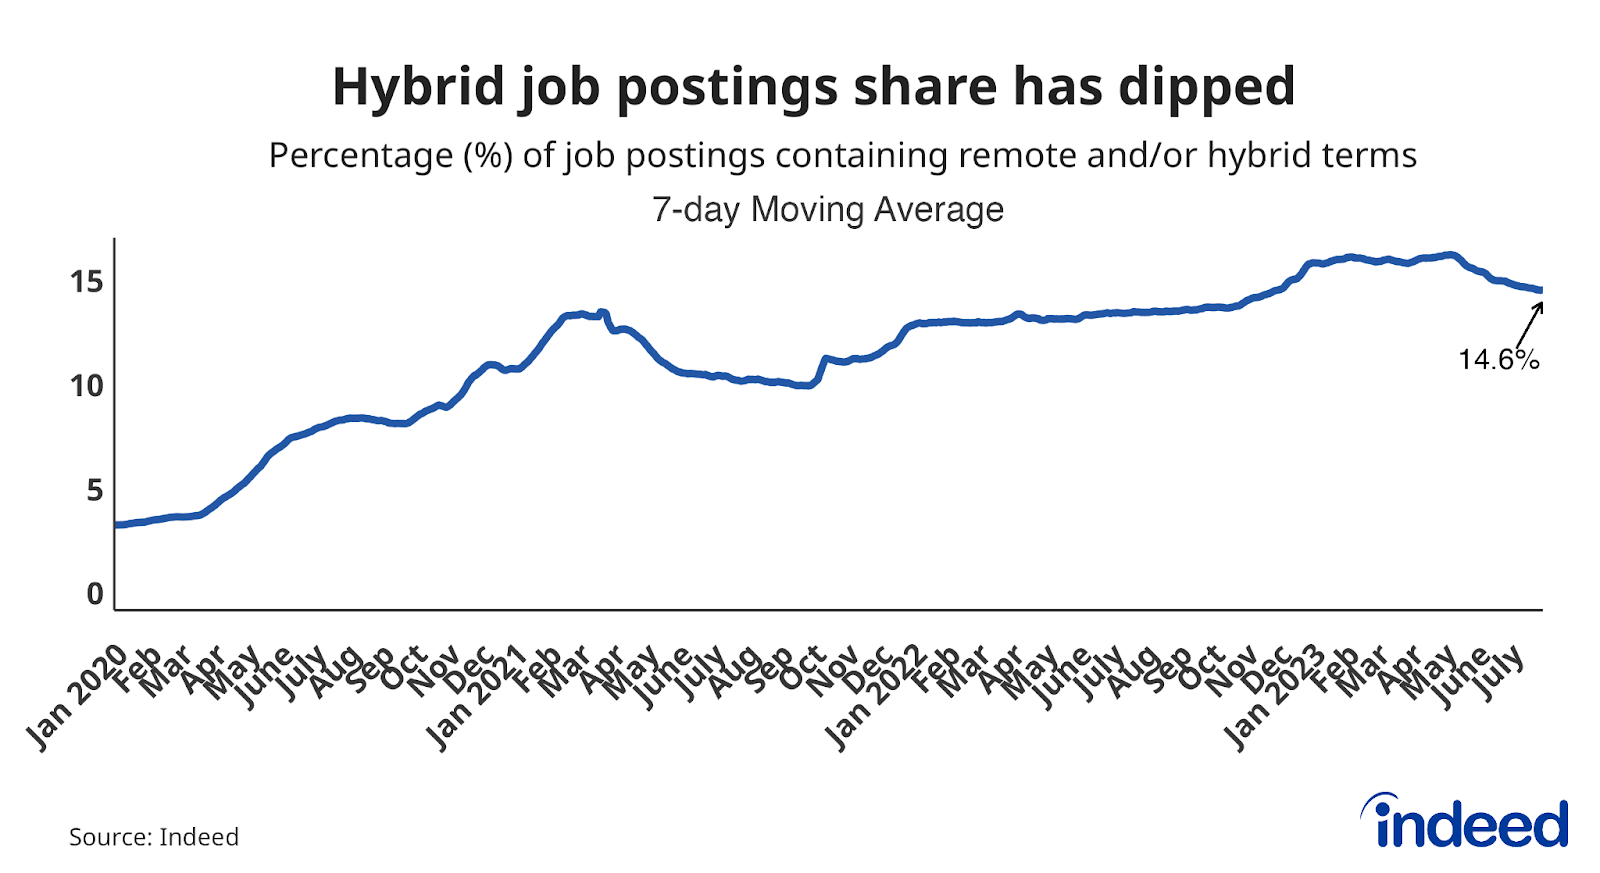
- Share of hybrid postings has dipped amid a return to office calls.
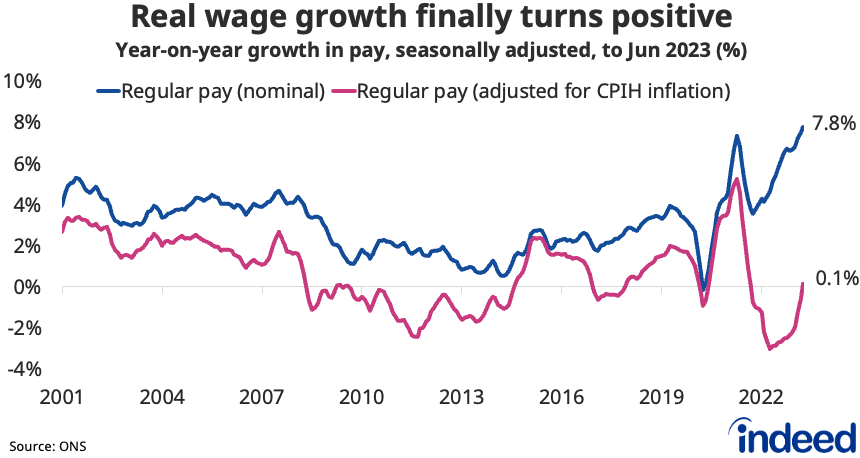
The UK labour market continues to cool, but there is no sign yet of that translating into an easing of pay pressures. Though vacancies continue to gradually fall from their peaks and unemployment has risen, the labour market remains tight overall. That, combined with still-high inflation, continues to support strong wage growth. Indeed, growth of regular pay hit a record 7.8% year-on-year in the three months to June.
Spotlight: Hybrid job postings share has dipped
The ongoing rebalancing of the labour market means candidates no longer hold all the power, and we’re seeing signs of employer behaviour starting to shift—hybrid work being one example. Indeed data shows the share of job postings mentioning remote or hybrid terms appears to have topped out, and has fallen from 16.3% to 14.6% over the past three months. That could be a sign of employers being less likely to accommodate worker preferences amid a labour market that, while still tight, is less challenging from a recruitment perspective than a few months ago. A number of large companies have recently announced return to office plans.
Labour Market Overview
The latest Office for National Statistics (ONS) figures showed positive news for workers as record annual pay growth drove pay above inflation for the first time in over one-and-a-half years. Regular pay growth jumped to a record 7.8% year-on-year in the second quarter of 2023, the highest it’s been since comparable data began in 2001. Including bonuses, the figure was 8.2% year-on-year, driven by one-off NHS bonuses in June.
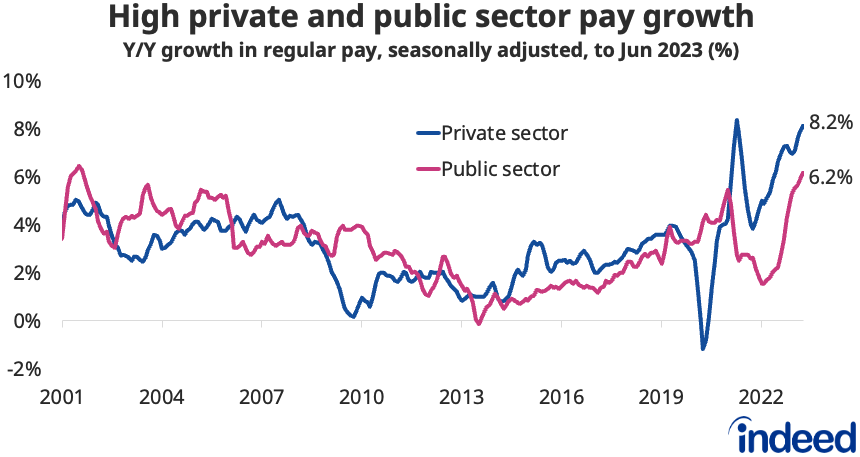
Wage growth accelerated across both the private and public sectors. In the private sector, it rose to 8.2% y/y, the highest outside the pandemic period. In the public sector, it accelerated to a record 6.2% y/y.
While the wage growth figures will grab attention, the ONS data also showed the labour market continuing to rebalance. Vacancies fell by 66,000 on the quarter to July, the thirteenth consecutive period they have declined. However, they remain 23% above pre-pandemic levels at just above one million (1.02m). More timely Indeed job postings data points to a further slight softening through mid-August.
The unemployment rate jumped by a larger-than-expected 0.3 percentage points to 4.2%, driven by an increase in long-term unemployment and more people moving out of inactivity. However, inactivity due to long-term sickness hit a new record high at nearly 2.6 million.
Though it has been softening, the labour market remains tight overall, with just 1.4 unemployed jobseekers per vacancy (up from 0.9 last summer). That could help support upward pressure on wages for a while yet.
The employment rate dipped 0.1 percentage points during the latest quarter and is still below pre-pandemic rates amid higher inactivity.
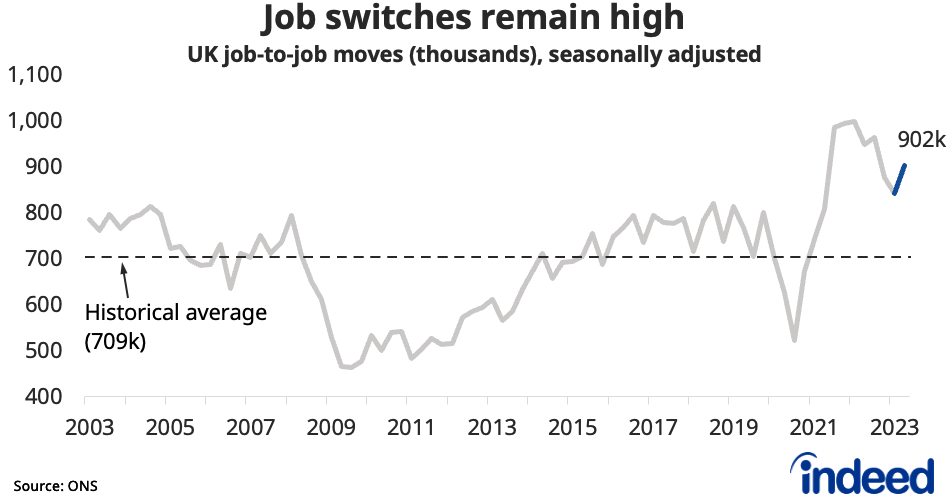
Meanwhile, there were few signs of economic uncertainty causing workers to be more reluctant to switch jobs during the second quarter. Job-to-job moves jumped above 900,000 in Q2, and remain elevated compared to pre-pandemic levels.
Conclusion
Bringing down high inflation remains a critical priority for the Bank of England and the government. The latest pay growth figures added to expectations that interest rates may have to be raised further to ease concerns over a wage-price spiral. But evidence is mounting that the economy is faltering amid tighter monetary policy, with the latest business surveys signalling a heightened risk of the economy slipping into recession.
Though the labour market continues to soften and inflation is showing signs of falling, they are only doing so gradually. The persistence of wage and price pressures throughout the economy means policymakers face considerable risk of a hard landing.
Hiring Lab Data
We host the underlying job-postings chart data on Github as downloadable CSV files. Typically, it will be updated with the latest data one day after this blog post was published.
Methodology
The Indeed Job Postings Index is a daily measure of labour market activity that is updated and will continue to be released weekly, superseding the Job Postings Tracker. The primary difference between the Indeed Job Postings Index and the legacy Job Postings Tracker is the level. The Indeed Job Postings Index is set to 100 on February 1, 2020, and this effectively provides a uniform level shift of 100 to the existing Job Postings Tracker across all time points.
The number of job postings on Indeed.com, whether related to paid or unpaid job solicitations, is not indicative of potential revenue or earnings of Indeed, which comprises a significant percentage of the HR Technology segment of its parent company, Recruit Holdings Co., Ltd. Job posting numbers are provided for information purposes only and should not be viewed as an indicator of performance of Indeed or Recruit. Please refer to the Recruit Holdings investor relations website and regulatory filings in Japan for more detailed information on revenue generation by Recruit’s HR Technology segment.