
Key Points:
- Wage growth was steady at 7.3% year-on-year in the three months to May, pointing to further monetary policy tightening from the Bank of England.
- The labour market continues to gradually loosen, with unemployment rising and vacancies and inactivity falling.
- But tightness in the labour market is not dissipating fast enough to ease pressure on policymakers to continue raising interest rates amid persistently high inflation.
The UK labour market is softening and competition for hires is easing somewhat, with a decline in the prevalence of signing bonuses advertised in job postings signalling a downshift in overall recruiting intensity. Even so, vacancies remain high and jobseekers can still expect a favourable market as relatively tight conditions continue. That tightness is helping drive strong nominal wage growth which appears unlikely to subside quickly enough to prevent the Bank of England from raising interest rates further. While nominal wage growth is high, real wages for UK workers continue to be squeezed by high inflation.
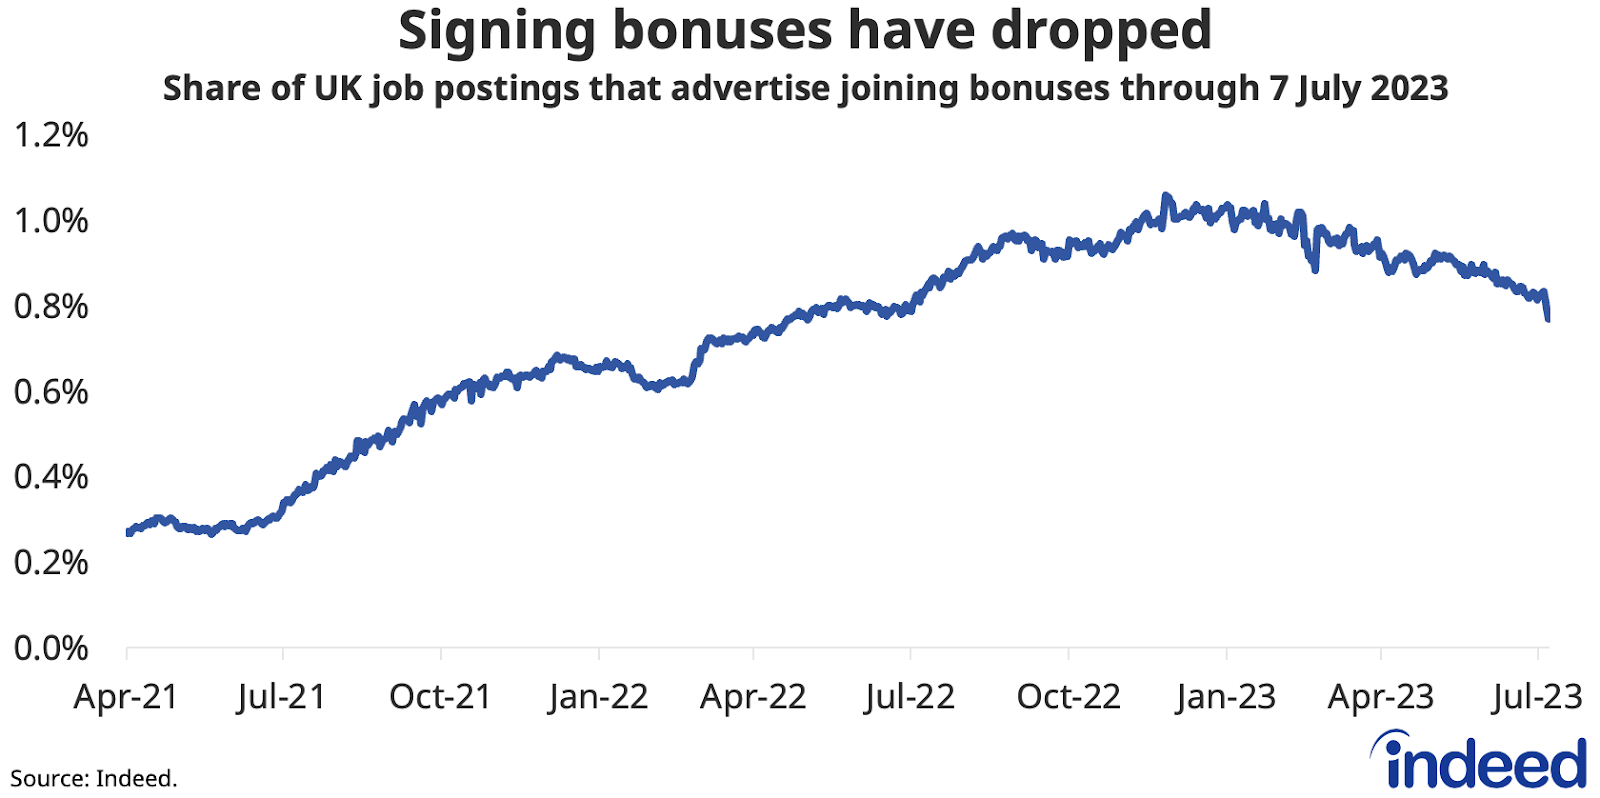
Spotlight: Fewer signing bonuses highlights reduced recruiting intensity
While pay pressures remain strong as workers continue to push for higher wages to compensate for high inflation, there are signs of weakening competition for hires among employers. For example, less than 0.8% of job postings on Indeed offered signing bonuses as of 7 July, down from a peak of 1.1% in November 2022.
Signing bonuses becoming less common could be a reflection of somewhat lower recruiting intensity among employers, which in turn could take some of the heat off wage growth as and when headline inflation declines in coming months. That could ease some of the pressure on Threadneedle Street, but the Monetary Policy Committee (MPC) will need to see evidence of moderating wage growth sooner rather than later to dissuade them from additional, perhaps substantial, rate hikes.
Labour Market Overview
Even as the national labour market gradually loosens, there were still 1.3 unemployed people per vacancy in the March to May period — one of the tightest readings of the last 20 years, according to official statistics. That’s helping to keep wage growth elevated at a rate that’s incompatible with the Bank of England’s 2% inflation target.
The key question for the MPC going forward is whether the labour market is cooling fast enough to bring down wage growth without the need to induce a recession through further monetary policy tightening.
Compared to the prior three-month period, the unemployment rate ticked up by 0.2 percentage points to 4.0% in the three months to May (the single-month unemployment rate for May climbed to 4.3%), suggesting that Bank decisions are starting to impact the labour market. Redundancies have risen slightly since the start of the year, though remain low by historical standards. Vacancies fell by 85,000 in the second quarter of 2023, the twelfth consecutive period to see a quarterly decline since May to July 2022, though vacancies (1.034 million as of June) remain 25% above their pre-pandemic level.

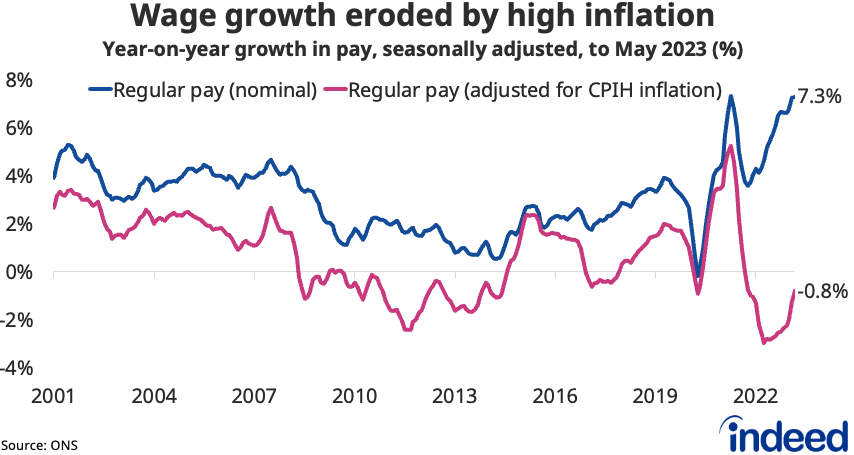
The tight labour market continues to generate strong regular pay growth at 7.3% year-on-year in the three months to May, according to the Office for National Statistics, unchanged from the previous month’s joint-record pace (and in line with the Indeed Wage Tracker). A deceleration in the single-month figure for May, from 7.7% to 7.1%, suggests April may have been the peak for wage growth after that month’s 9.7% increase in the National Living Wage. But a bigger-than-expected public sector pay offer by the government may add to pressures, sustaining wage growth at high levels for some time to come.
Wages continue to fall in real terms after accounting for inflation, though the latest drop of 0.8% was the smallest since December 2021. With inflation set to fall in the second half of the year, a belated return to positive real wage growth may be on the cards.
There was further progress on the inactivity front this spring, with the rate of inactivity among working-age people falling 0.2 percentage points to 20.8% in the three months to May. That remains higher than the 20.2% rate seen on the eve of the pandemic (equating to 280,000 more inactive working-age people) but is down from a peak of 21.7% last summer. Recent falls have been partly driven by more young people entering the workforce after studying longer during the pandemic. But inactivity due to long-term sickness remains a concern, remaining near record highs at over 2.5 million in the latest period.

Conclusion
The rebalancing of the labour market continues but is not happening fast enough to ease concerns that interest rates will have to rise further to get inflation under control. From an employers’ perspective, hiring conditions are getting gradually more favourable, but jobseekers continue to have plenty of opportunities with vacancies still high.
Hiring Lab Data
We host the underlying job-postings chart data on Github as downloadable CSV files. Typically, it will be updated with the latest data one day after this blog post was published.
Methodology
The Indeed Job Postings Index is a daily measure of labour market activity that is updated and will continue to be released weekly, superseding the Job Postings Tracker. The primary difference between the Indeed Job Postings Index and the legacy Job Postings Tracker is the level. The Indeed Job Postings Index is set to 100 on February 1, 2020, and this effectively provides a uniform level shift of 100 to the existing Job Postings Tracker across all time points.
The number of job postings on Indeed.com, whether related to paid or unpaid job solicitations, is not indicative of potential revenue or earnings of Indeed, which comprises a significant percentage of the HR Technology segment of its parent company, Recruit Holdings Co., Ltd. Job posting numbers are provided for information purposes only and should not be viewed as an indicator of performance of Indeed or Recruit. Please refer to the Recruit Holdings investor relations website and regulatory filings in Japan for more detailed information on revenue generation by Recruit’s HR Technology segment.