
Key Points:
- Wage growth acceleration points to further Bank of England monetary policy tightening.
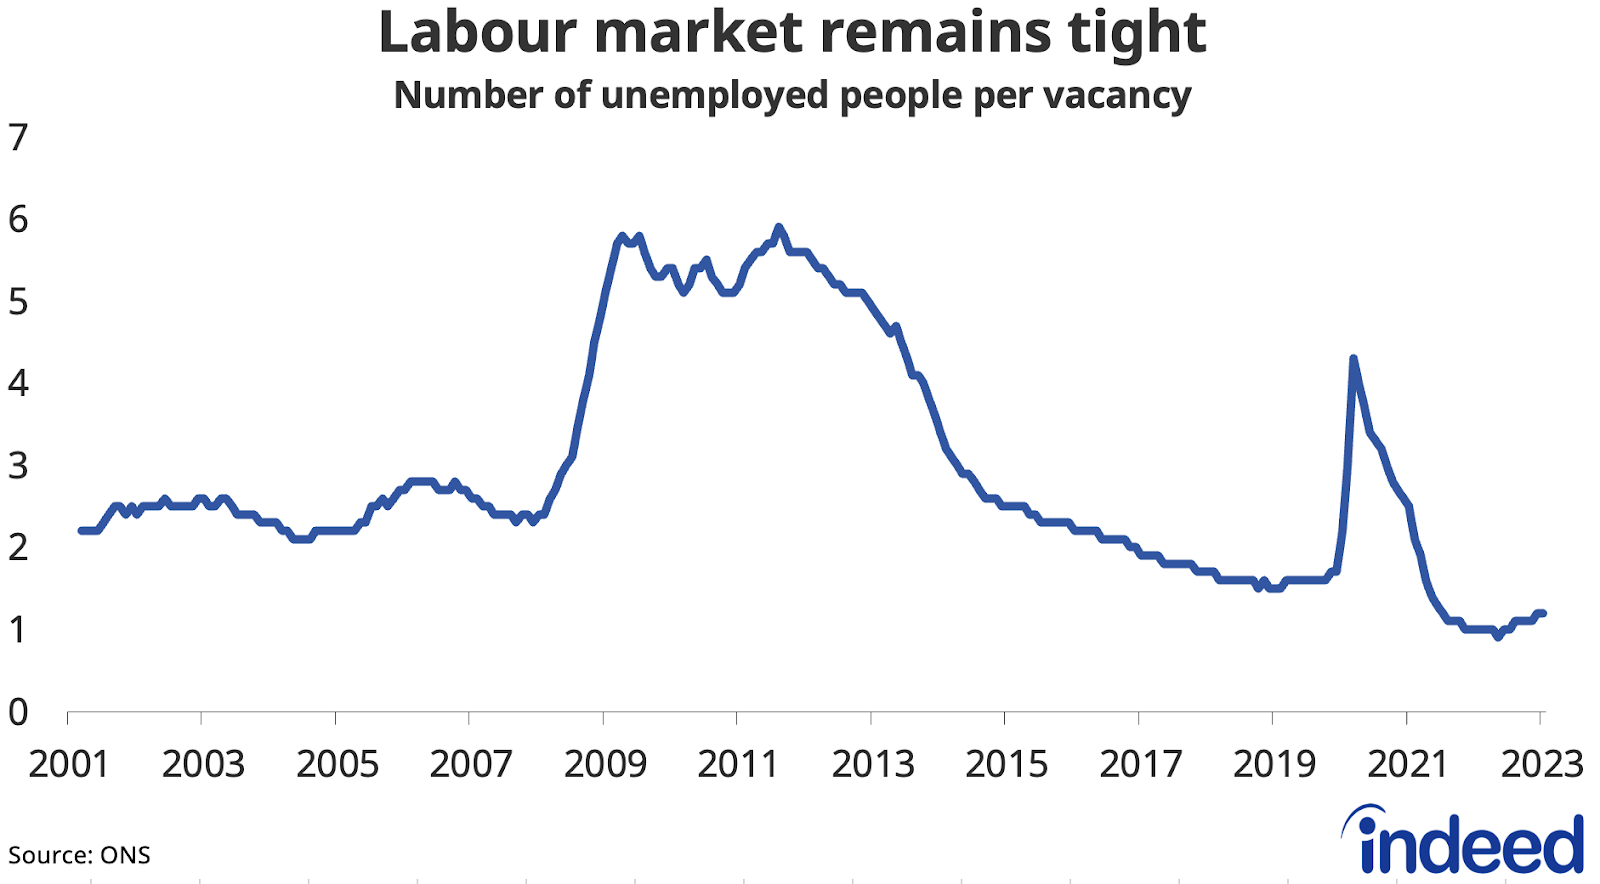
- The labour market remains tight despite falling vacancies and inactivity.
- Lower jobseeker interest in several lower-paid categories underlines hiring challenges.
The UK labour market shows further signs of rebalancing but is still tight. These signs are generating strong nominal wage growth which, combined with persistently high inflation, points to the need for further monetary policy tightening amid concerns of a wage-price spiral.
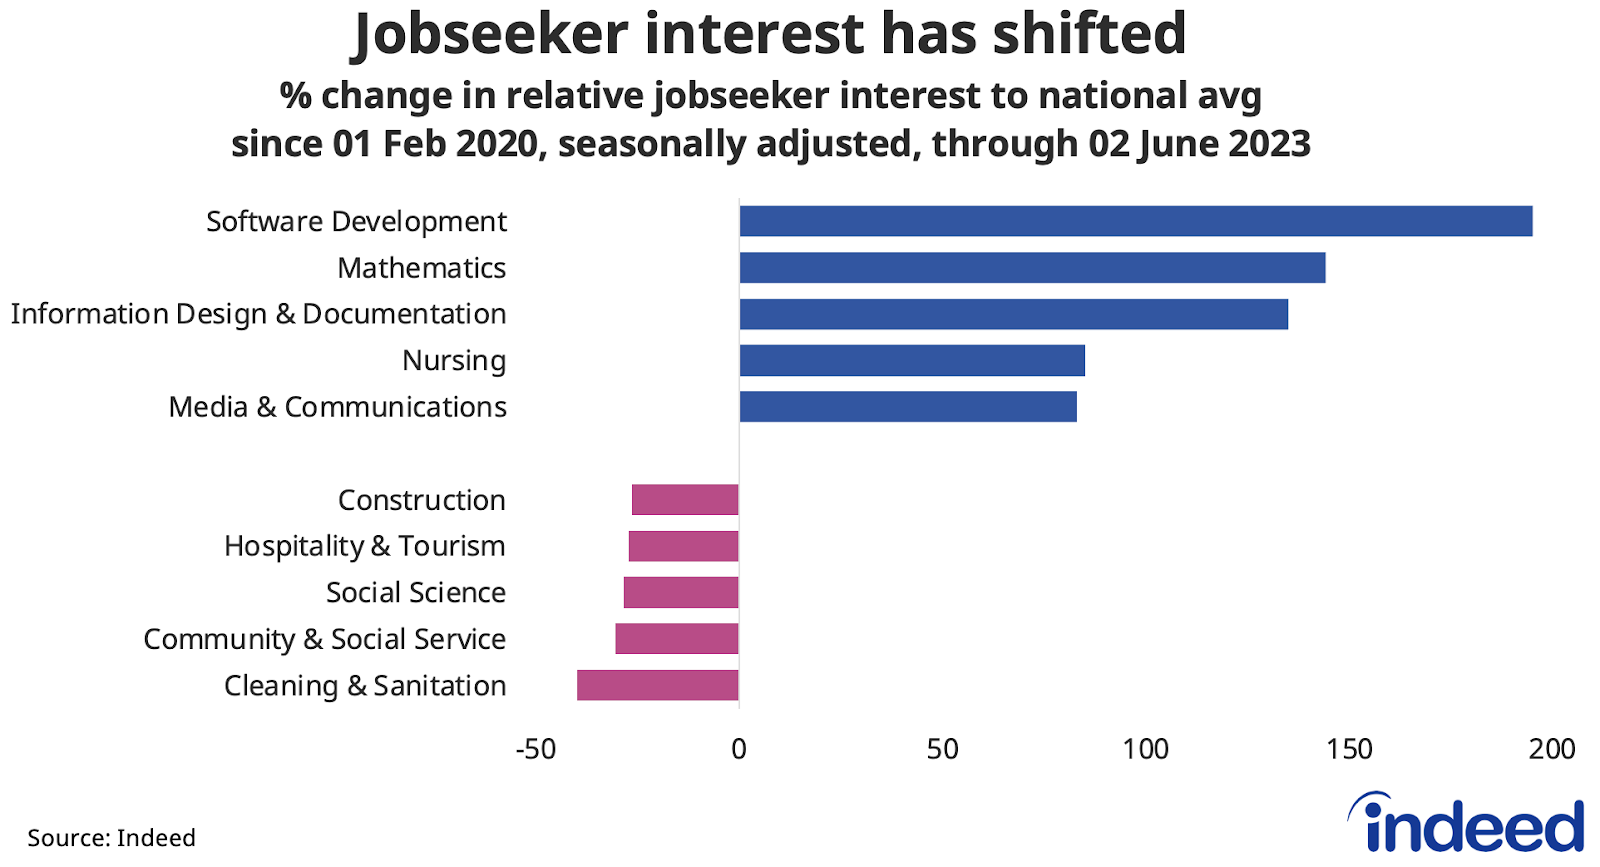
Spotlight: Shifts in jobseeker interest and job postings means hiring is becoming easier in some occupations but harder in others
Hiring challenges persist in lower-paid, in-person categories. Jobseeker interest in occupations like cleaning, community work, hospitality & tourism and construction remains lower than pre-pandemic, relative to the average job on Indeed. But higher-paid, remote-friendly occupations like tech, mathematics and media & communications continue to see increased jobseeker interest than pre-pandemic.
These trends are reinforced by the UK’s post-Brexit migration policy which prioritises the higher-skilled end of the labour market and healthcare occupations in particular. Worker shortages in lower-paid sectors are likely to remain a feature of the labour market for some time to come.
Labour Market Overview
Noteworthy in the latest ONS figures was that the number of people in employment climbed above its pre-pandemic level, hitting a record high of 33.1 million in the three months to April. That marks a slower recovery in employment than in other developed economies.
Hours worked also finally climbed above their pre-pandemic level, but there was a surprise dip in the unemployment rate, which edged down to 3.8%.
Labour demand continued to cool though. Vacancies continued their gradual descent in the three months to May and are now down 19% from last year’s peak. However, they remain high at over 1.05 million and are still 27% above their level on the eve of the pandemic.
One metric of labour market tightness, the ratio of unemployed jobseekers for each vacancy, remains close to historic lows at just 1.2. That’s up from a low of 0.9 late last summer.
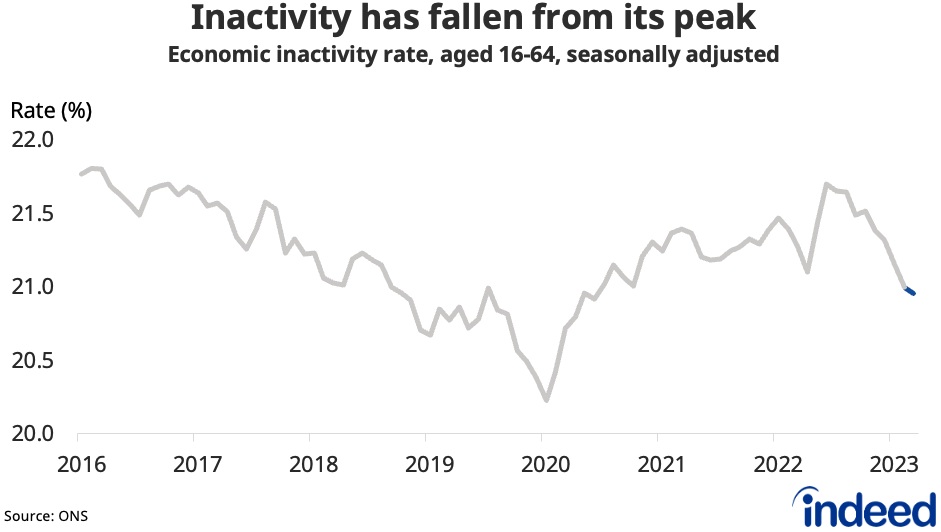
Worker shortages have eased somewhat but appear likely to remain a long-term issue. One reason is that economic inactivity among working-age people remains almost 350,000 above its pre-pandemic level, despite having dropped nearly 300,000 from last summer’s peak.
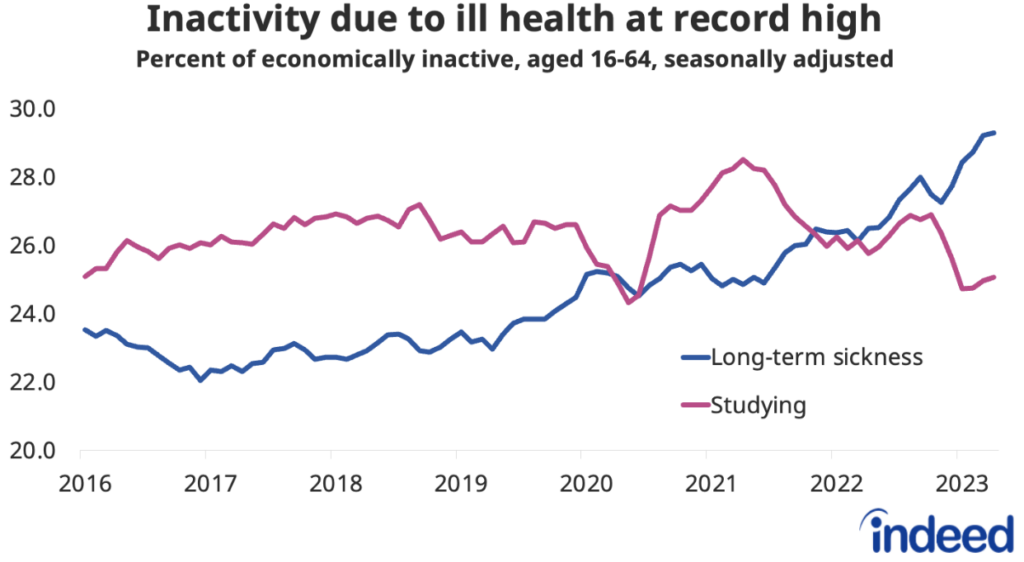
Inactivity due to long-term sickness remains a key concern, hitting a new record high of nearly 2.6 million in the latest period. The continued rise in inactivity due to ill health has been offset in recent months by a drop in those inactive due to studying. Many young people opted to ride out a tough pandemic labour market by staying longer in education, but are now entering the workforce.
Inactivity challenges have been partially compensated by record net migration, though there are signs of that slowing.
Wage growth accelerates
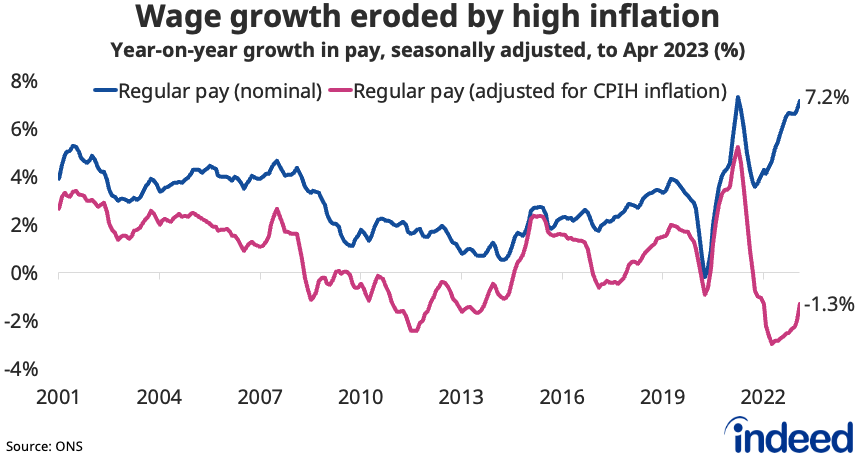
In line with the steer from the Indeed Wage Tracker, regular pay growth as tracked by the Office for National Statistics quickened from 6.8% to 7.2% year-on-year in the three months to April, the highest outside pandemic-related distortions in at least 20 years. The recent national minimum wage uplift of 9.7%, and public sector pay deals—including those for nurses—are contributory factors.
But the continued tightness in the labour market appears to be supporting workers’ ability to obtain substantial pay increases in response to high consumer price inflation. While inflation is expected to fall back in the second half of the year, workers continued to experience real-term pay cuts in the latest period, as regular pay after accounting for inflation dropped by 1.3% y/y.
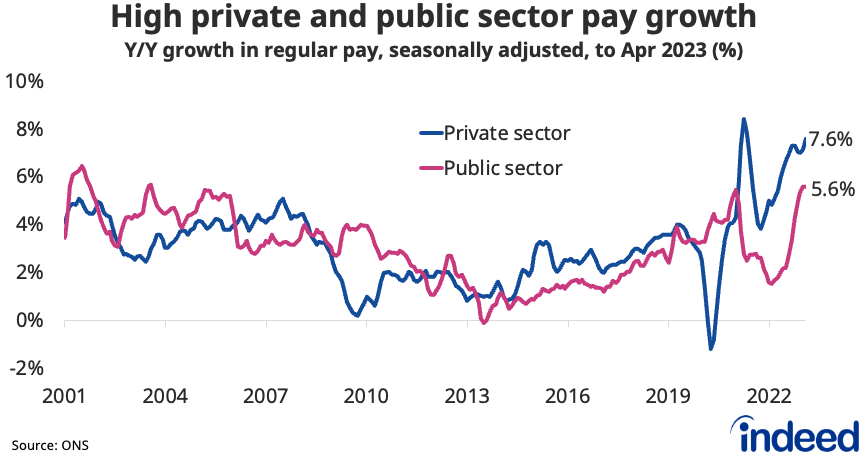
Wage growth accelerated in both the private and public sectors, reaching 7.6% y/y and 5.6% y/y, respectively.
Conclusion
The labour market continues to rebalance, but not quickly enough for the Bank of England. Elevated wage pressures suggest the need for interest rates to rise higher for longer to get inflation under control. This spells pain for mortgage holders and adds to headwinds facing the UK economy.
In the meantime, the resilience of the job market continues to be a positive for workers, as plentiful opportunities mean they retain a fair degree of bargaining power. Employers will be hoping to see further improvements on the labour supply side to ease hiring challenges further and reduce upward pressure on pay.
Hiring Lab Data
We host the underlying job-postings chart data on Github as downloadable CSV files. Typically, it will be updated with the latest data one day after this blog post was published.
Methodology
The Indeed Job Postings Index is a daily measure of labour market activity that is updated and will continue to be released weekly, superseding the Job Postings Tracker. The primary difference between the Indeed Job Postings Index and the legacy Job Postings Tracker is the level. The Indeed Job Postings Index is set to 100 on February 1, 2020, and this effectively provides a uniform level shift of 100 to the existing Job Postings Tracker across all time points.
The number of job postings on Indeed.com, whether related to paid or unpaid job solicitations, is not indicative of potential revenue or earnings of Indeed, which comprises a significant percentage of the HR Technology segment of its parent company, Recruit Holdings Co., Ltd. Job posting numbers are provided for information purposes only and should not be viewed as an indicator of performance of Indeed or Recruit. Please refer to the Recruit Holdings investor relations website and regulatory filings in Japan for more detailed information on revenue generation by Recruit’s HR Technology segment.