
Key Points:
- Almost half (49%) of Canadian job postings on Indeed in February 2024 featured pay information, up from 22% in early 2019.
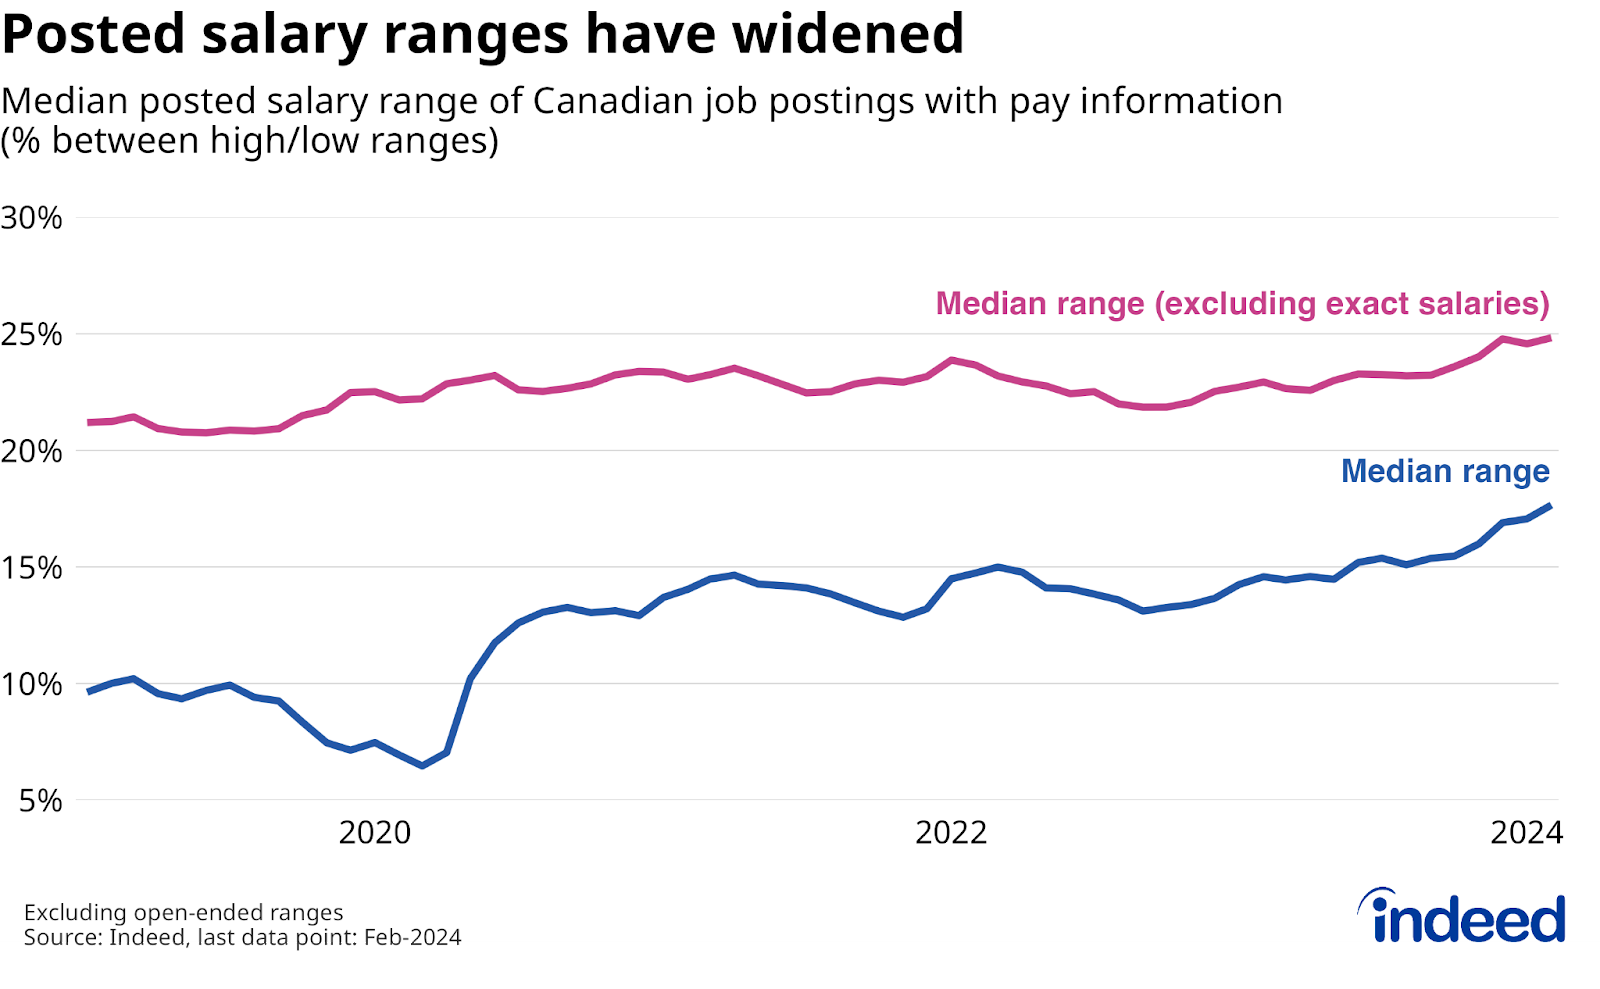
- While more postings now advertise pay, salary information has become less precise — the median gap between low and high wage estimates (including postings without ranges) rose to 18% in early 2024, up from 10% five years earlier.
- Less than one-third of postings in several white-collar fields mention pay, compared to more than 60% among jobs that predominantly pay by the hour. Pay ranges tend to be wider among higher-paying occupations.
- The share of BC postings mentioning pay jumped from 49% in Q3 2023 to 76% in February 2024, following a November 2023 law requiring posted salary transparency, with the largest increases in sectors where mentions of pay were previously rare. So far though, there haven’t been substantial broader labour market impacts from the policy change.
Higher pay is the most common reason employed Canadians cite when asked why they’re looking for a new job. But historically, information on what job opportunities might pay has been scarce. However, wage and salary information has become much more commonplace in Canadian job postings. Meanwhile, proposed legislation in Ontario, following recent moves in BC, Newfoundland, and PEI, could change the landscape further.
The share of Canadian job postings on Indeed including some form of salary information has more than doubled over the past five years. In February 2024, 49% of postings mentioned pay, up from 22% in early 2019. Among postings that included pay information last month, almost three-quarters offered wages in hourly terms, slightly less than 1-in-4 advertised annual salaries, and far smaller shares quoted pay in monthly, weekly, or daily frequencies.
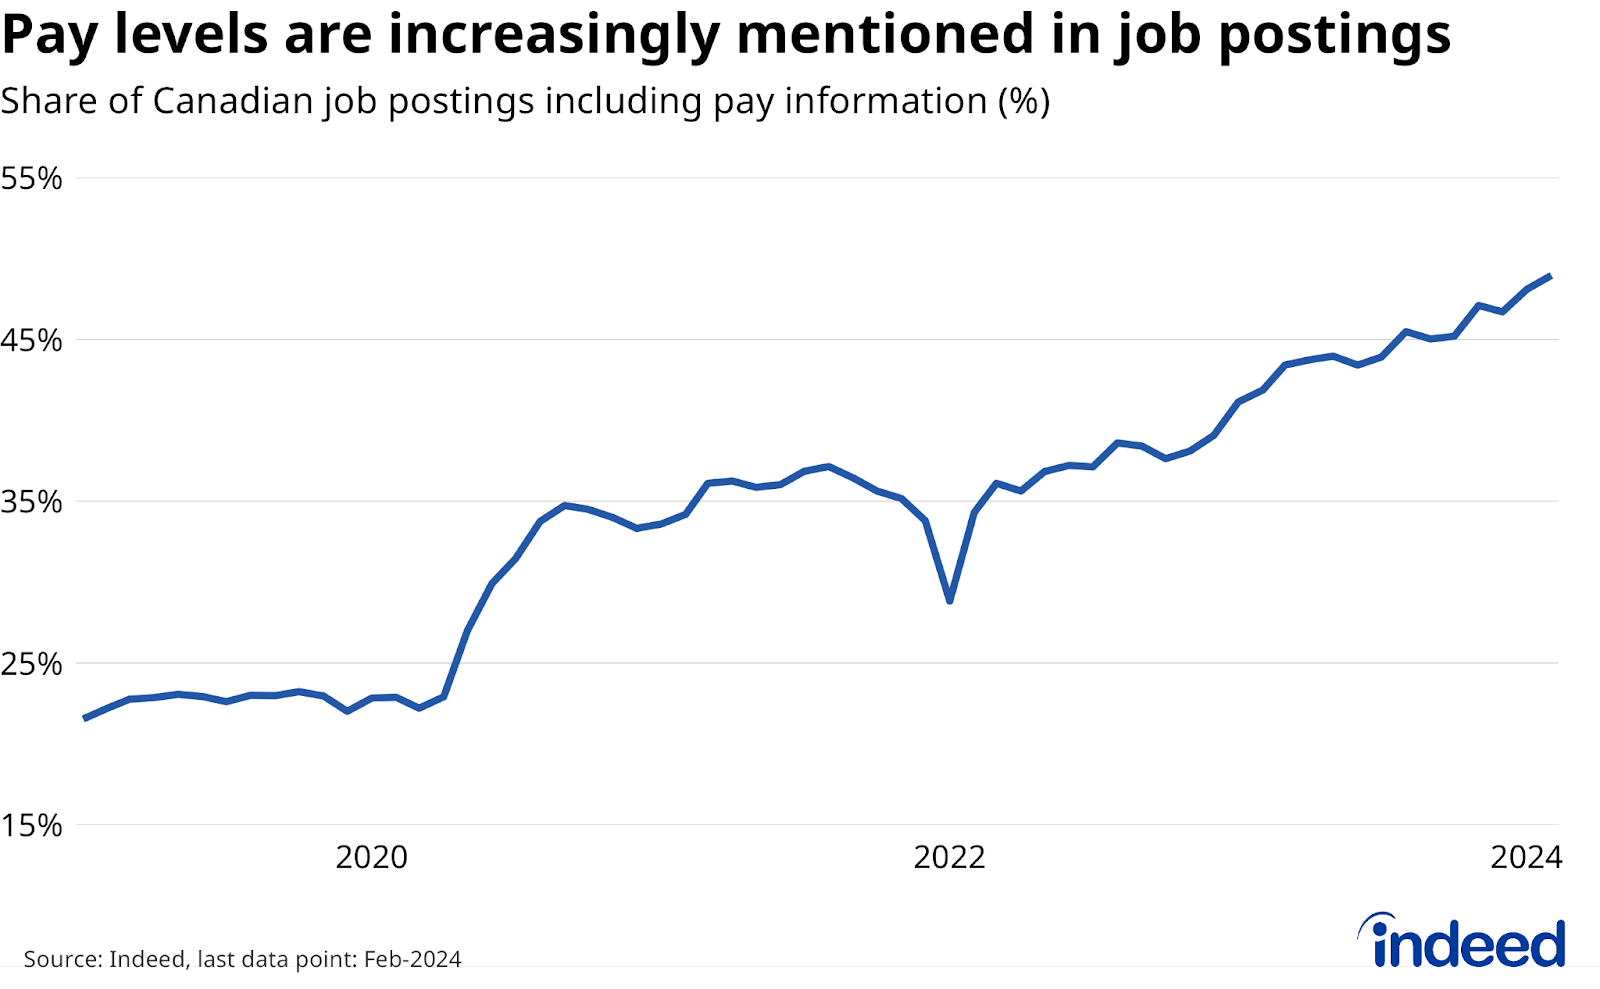
Some of the rise in posted salary transparency reflects changes to the Indeed platform itself: employers are prompted to include pay information when they post a job ad directly to Indeed. Changes to these prompts were a main driver of the early-2020 jump in overall salary transparency. But the share of postings including pay information has continued rising steadily since 2022, including among online job ads originating from other sources, such as company web pages.
Employers are increasingly mentioning pay in job postings likely because it helps attract job seekers. Prior Indeed research found that job postings that included wage estimates received more applications per day, and were active for shorter periods of time, than comparable postings that didn’t mention pay. This recruiting edge took on particular importance amid the tight labour market that emerged from the pandemic. Meanwhile, a culture shift among HR leaders could also be playing a part, with pay transparency seen as a way to promote an equitable workplace.
Pay ranges have become the norm, making posted wages less precise
Canadian job descriptions increasingly mention pay, but the information provided isn’t as precise as it used to be. In particular, fewer postings advertise exact pay levels, with more quoting ranges instead. In early 2024, 21% of job postings that included pay provided an exact level, down from about 40% in 2019. Exact pay is more common when pay is quoted in hourly terms (31% exact) rather than as annual salaries (10% exact).
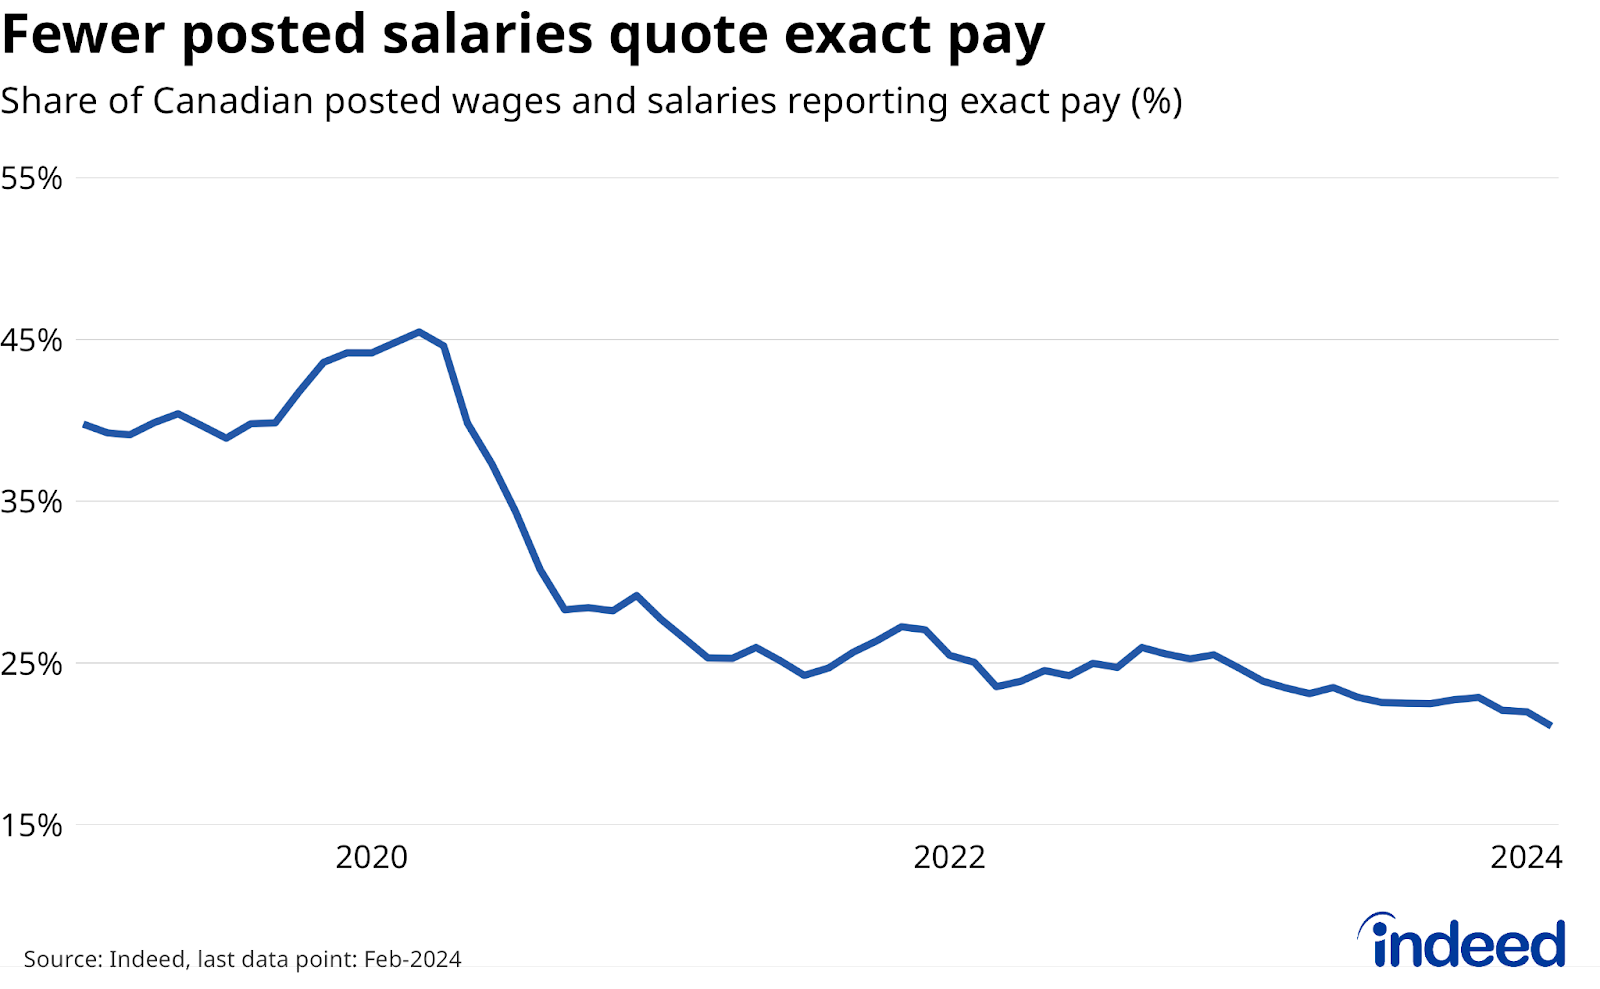
Similar to the prevalence of posted salaries, changes to the Indeed platform partially explain the shift to posted salary ranges, particularly in early 2020. However, the trend has also continued recently among postings sourced from elsewhere online. This suggests that including salary ranges still helps employers attract talent, while also maintaining some negotiating flexibility. Posting a less precise salary range may also help soothe potential concerns from existing employees who might be comparing their current pay to what is being advertised.
Naturally, the shift from exact wages to ranges has made pay information in general less precise. Among postings including either exact pay or a range, the median pay difference between low and high ends of offered wages went from 10% in 2019 to 18% in early 2024. Pay ranges themselves have also grown wider, though the change has been less dramatic. Excluding posts with exact pay levels, the median range between low and high offers rose from 21% to 25%.
Salary transparency has grown across the board, but wage information remains much more common among jobs that typically pay by the hour
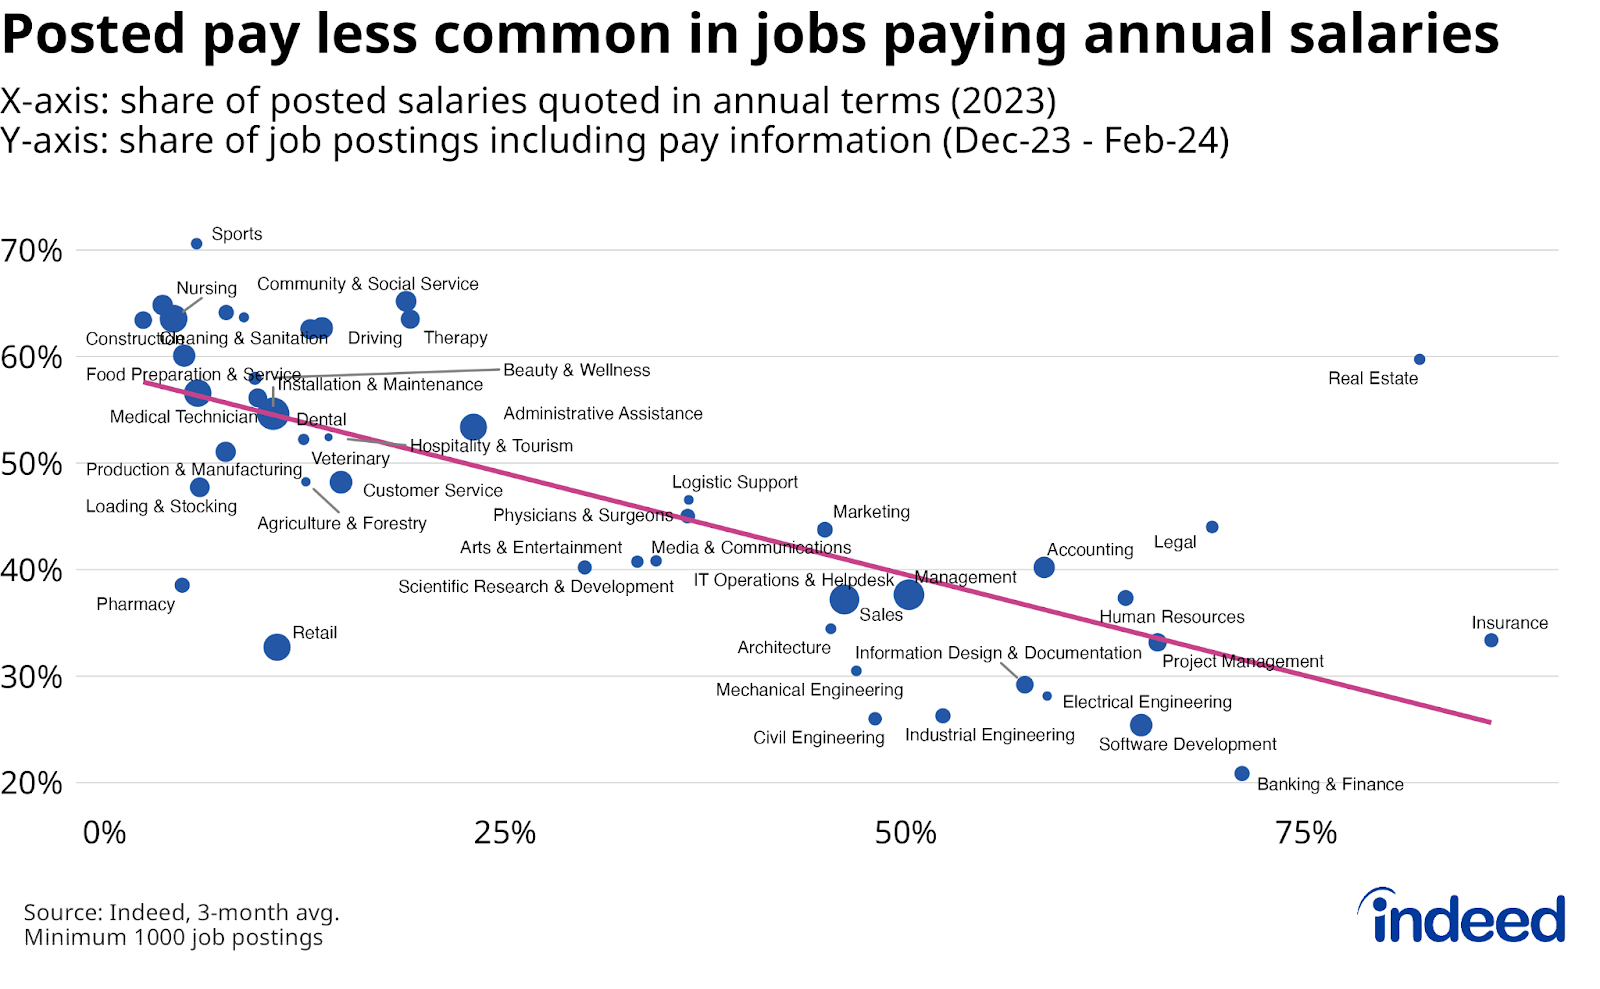
Posted salaries became more common throughout all areas of the economy after 2019. However, similar percentage point jumps across occupations has meant that the prevalence of posted wages continues to vary substantially. In early 2024, less than 30% of postings in white-collar fields like finance, tech, and engineering included salary information. Conversely, posted salaries were included in more than 60% of job posts in the sports, security, and cleaning and sanitation sectors, as well as several health care fields. Construction (60% of postings included pay data) and food service (57%) were also relatively transparent industries, just missing out on making the top 10.
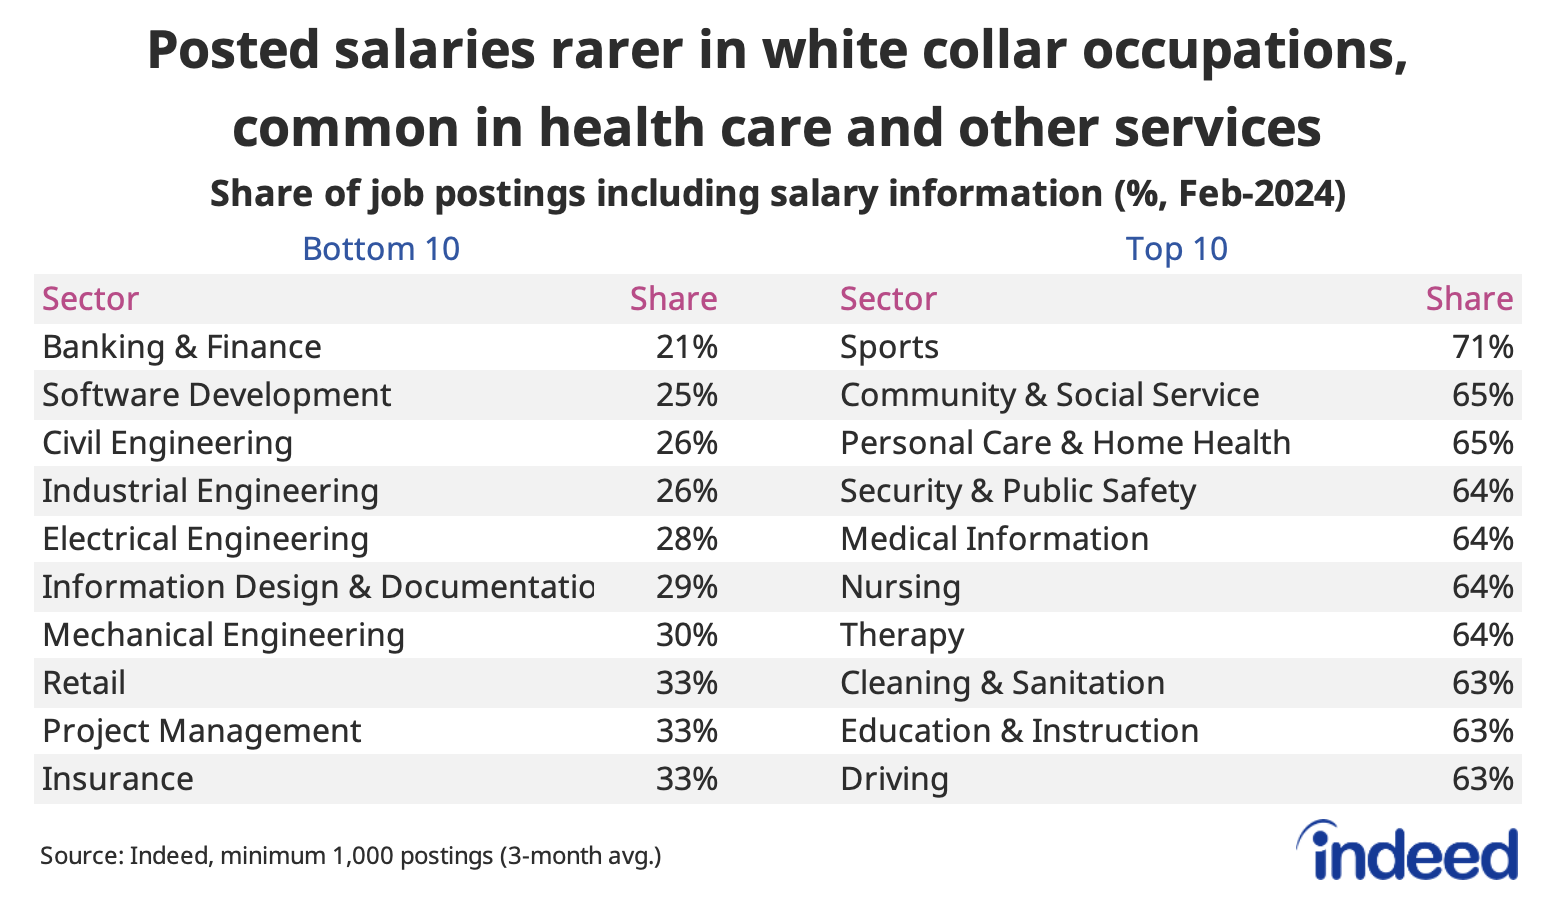
The best predictor of posted salary prevalence was related to the type of pay — hourly vs. annual — employers usually offered. Transparency was generally lowest among occupations where annual pay was more common. The share of postings in February 2024 mentioning pay was lower than the economy-wide average in 11 of the 12 occupations in which annual salaries made up a majority of posted wages (real estate the lone exception). Conversely, none of the ten sectors with the highest rates of transparency quoted more than 20% of their wages and salaries in annual terms. Employers might be more wary of posting pay in annual, rather than hourly terms, as the latter still provides some flexibility in determining overall labour costs.
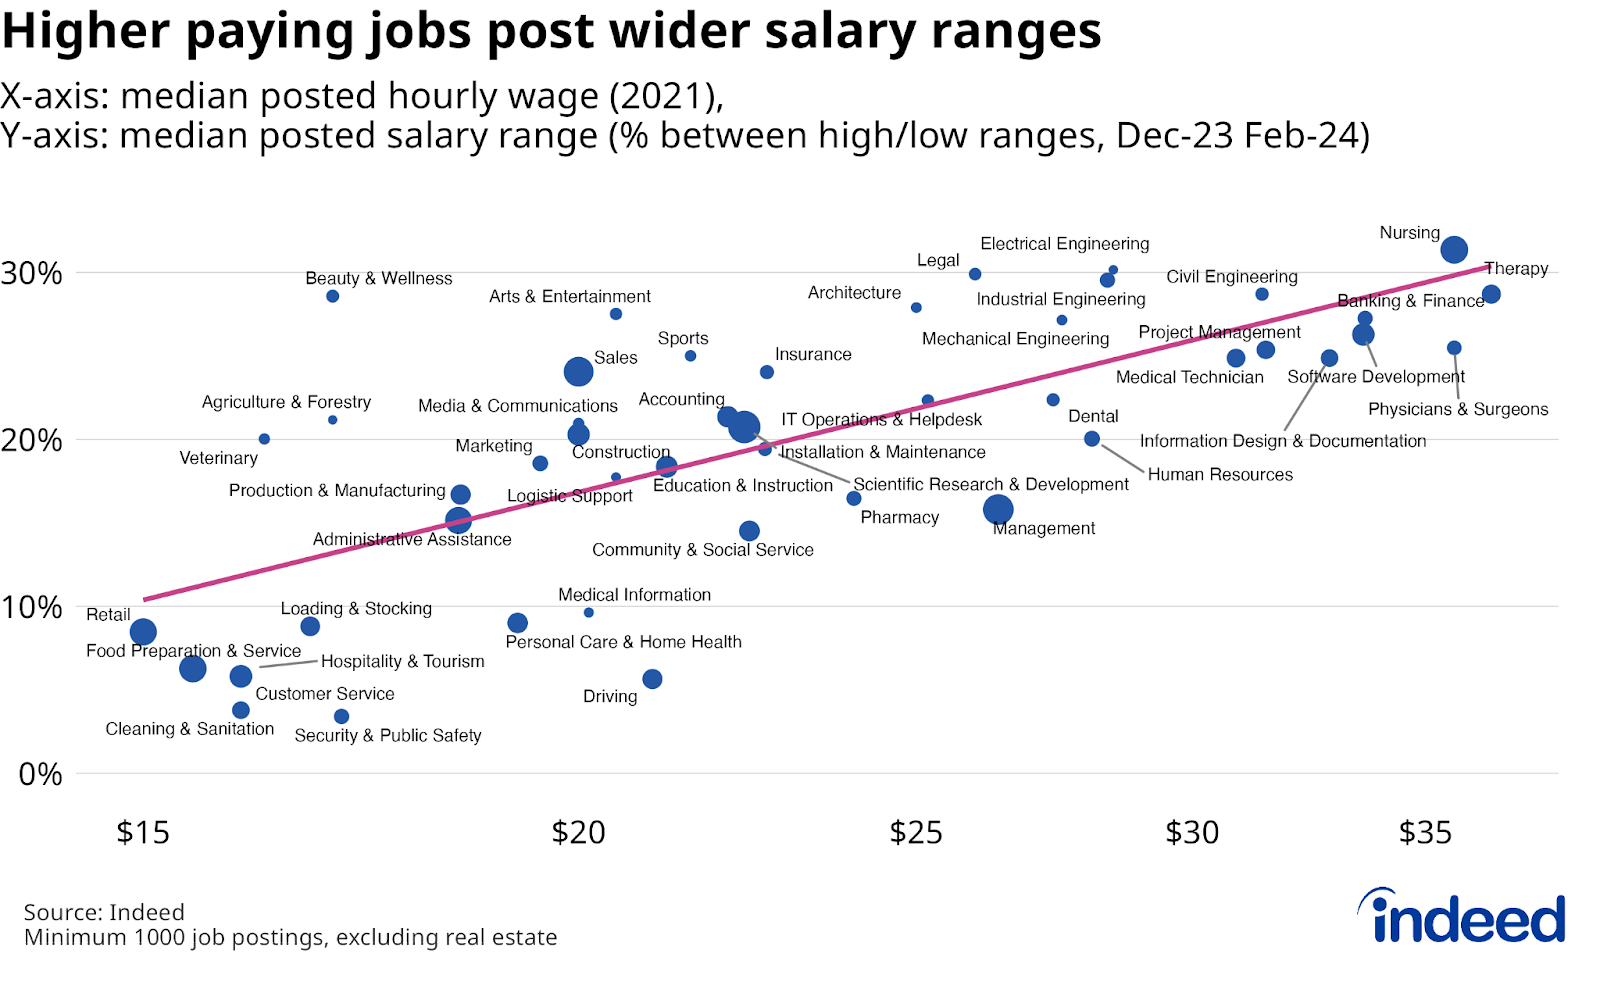
Posted wage ranges get wider further up the pay scale
Lower-paying occupations generally post narrower salary ranges than higher-paying ones. For instance, the typical posted pay range among customer service job postings is just 6%, and even less for postings in security and public safety, and cleaning and sanitation. This partly reflects minimum wage acting as a floor for offered pay among these roles.
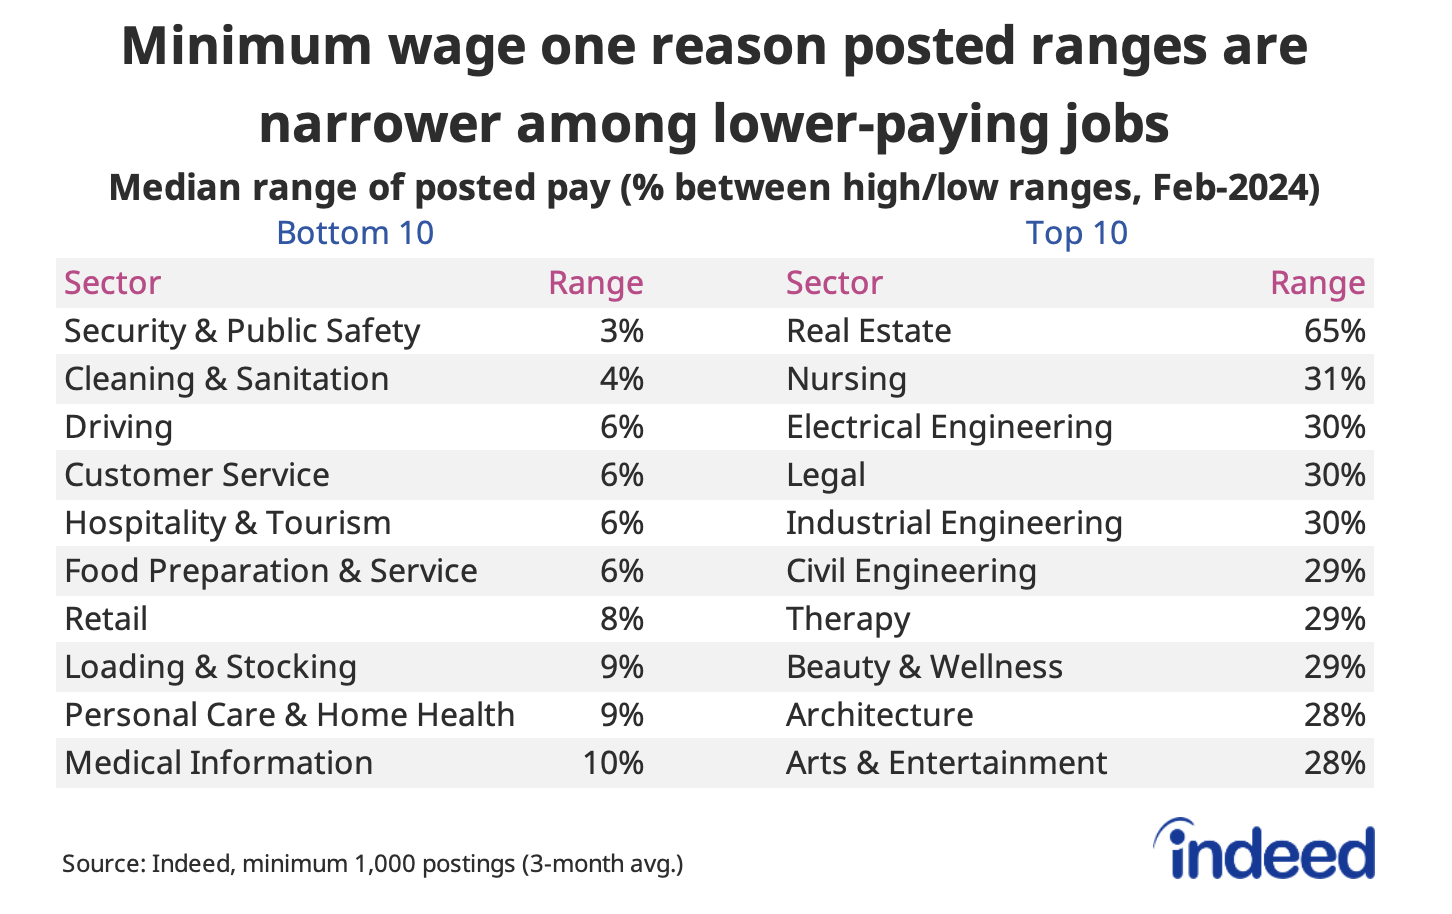
At the other end, advertised salaries for engineering-related positions — which are relatively rare to begin with — typically show wage ranges of 30% between low and high estimates. And while higher-paying health care postings like in nursing and therapy frequently mention pay, the typical pay bands also tend to be relatively wide. Real estate jobs also share quite large pay estimates, likely reflecting their variable commission-based compensation structure. These patterns in posted wage ranges are seen in actual pay levels too. In the Labour Force Survey, occupations with higher median wages tend to have the largest hourly earning gaps between 90th and 10th percentiles.
Prevalence of posted salaries in BC jumped after new requirement came into effect in November
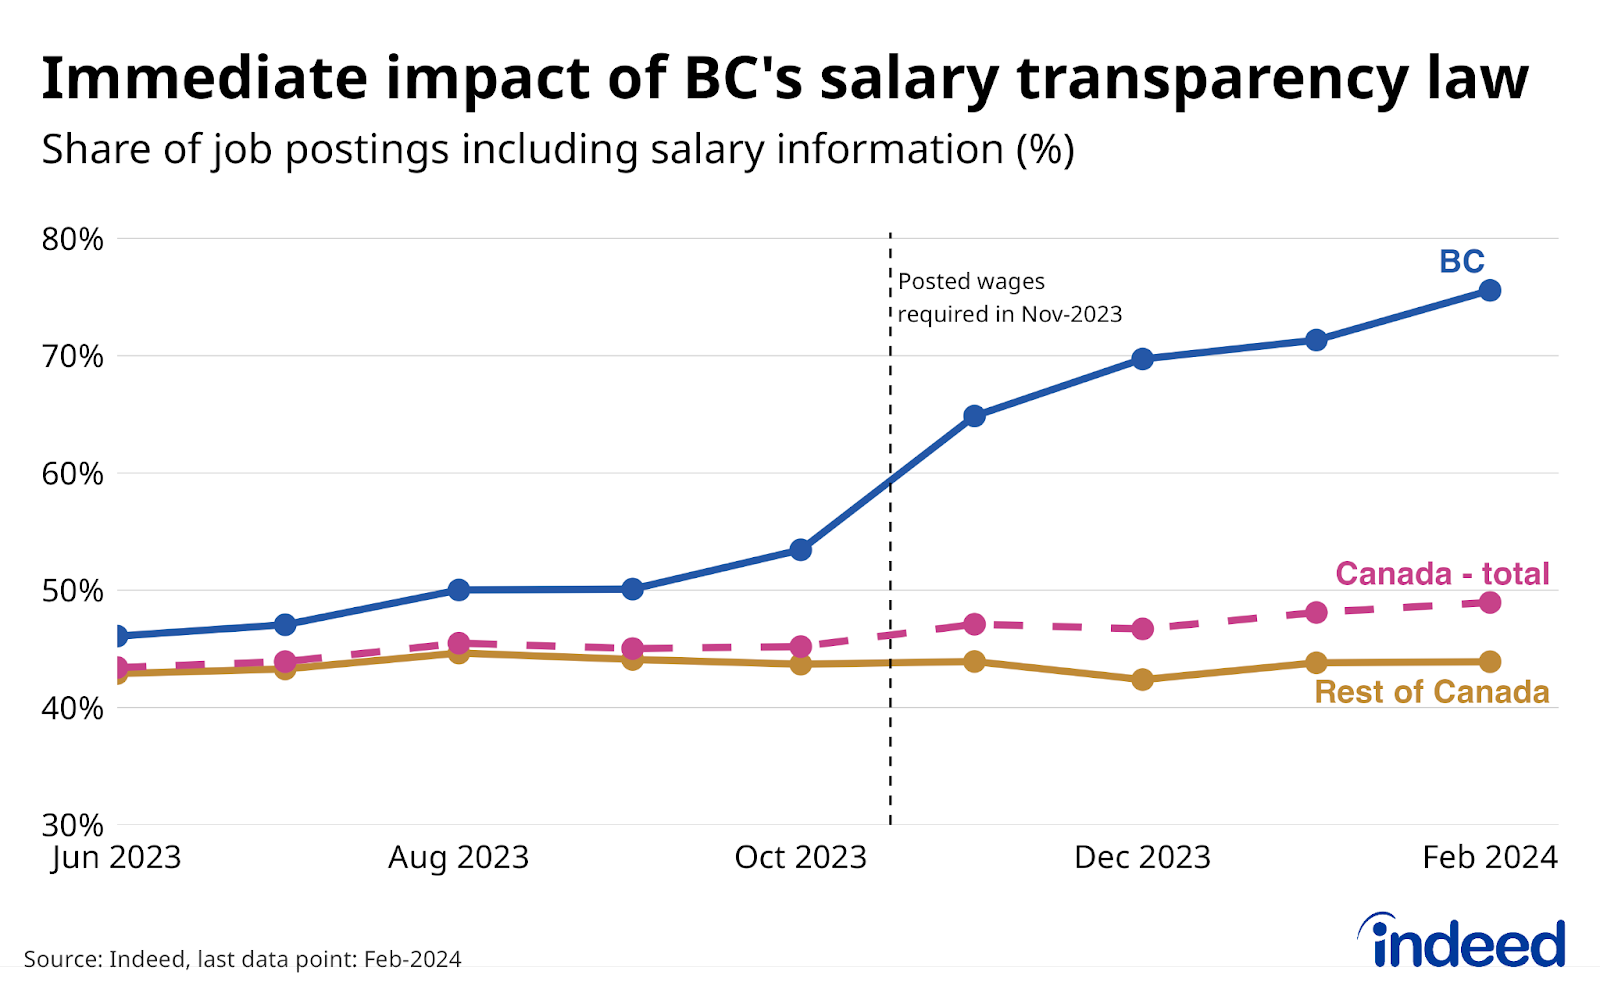
While much of the growth in salary transparency can be attributed both to changes to Indeed’s platform and evolving recruiting strategies, legislation has also played a role. In May 2023, the BC government passed the Pay Transparency Act, which among other changes, requires job postings originating after November 1, 2023, in the province to include wage and salary information.
The effects of the new requirement were immediately apparent on Indeed: the share of BC postings with salary information jumped from 49% during the third quarter of 2023 to 76% as of February 2024, a full 32 percentage points higher than the rest of Canada. Meanwhile, posted wage ranges edged wider, though a similar trend was seen in other provinces.
Jumps in posted wage frequency after November were generally largest among occupations with the fewest salaries beforehand, and thus the most room for growth. Several sectors in fields like engineering, tech, and insurance saw their posted salary shares rise more than 35 percentage points, while the share among management positions increased by 30 percentage points. Annual salary data also became more frequent, both reflecting the types of occupations adding the most new salaries and a shift within these fields to increasingly quote pay in yearly terms.
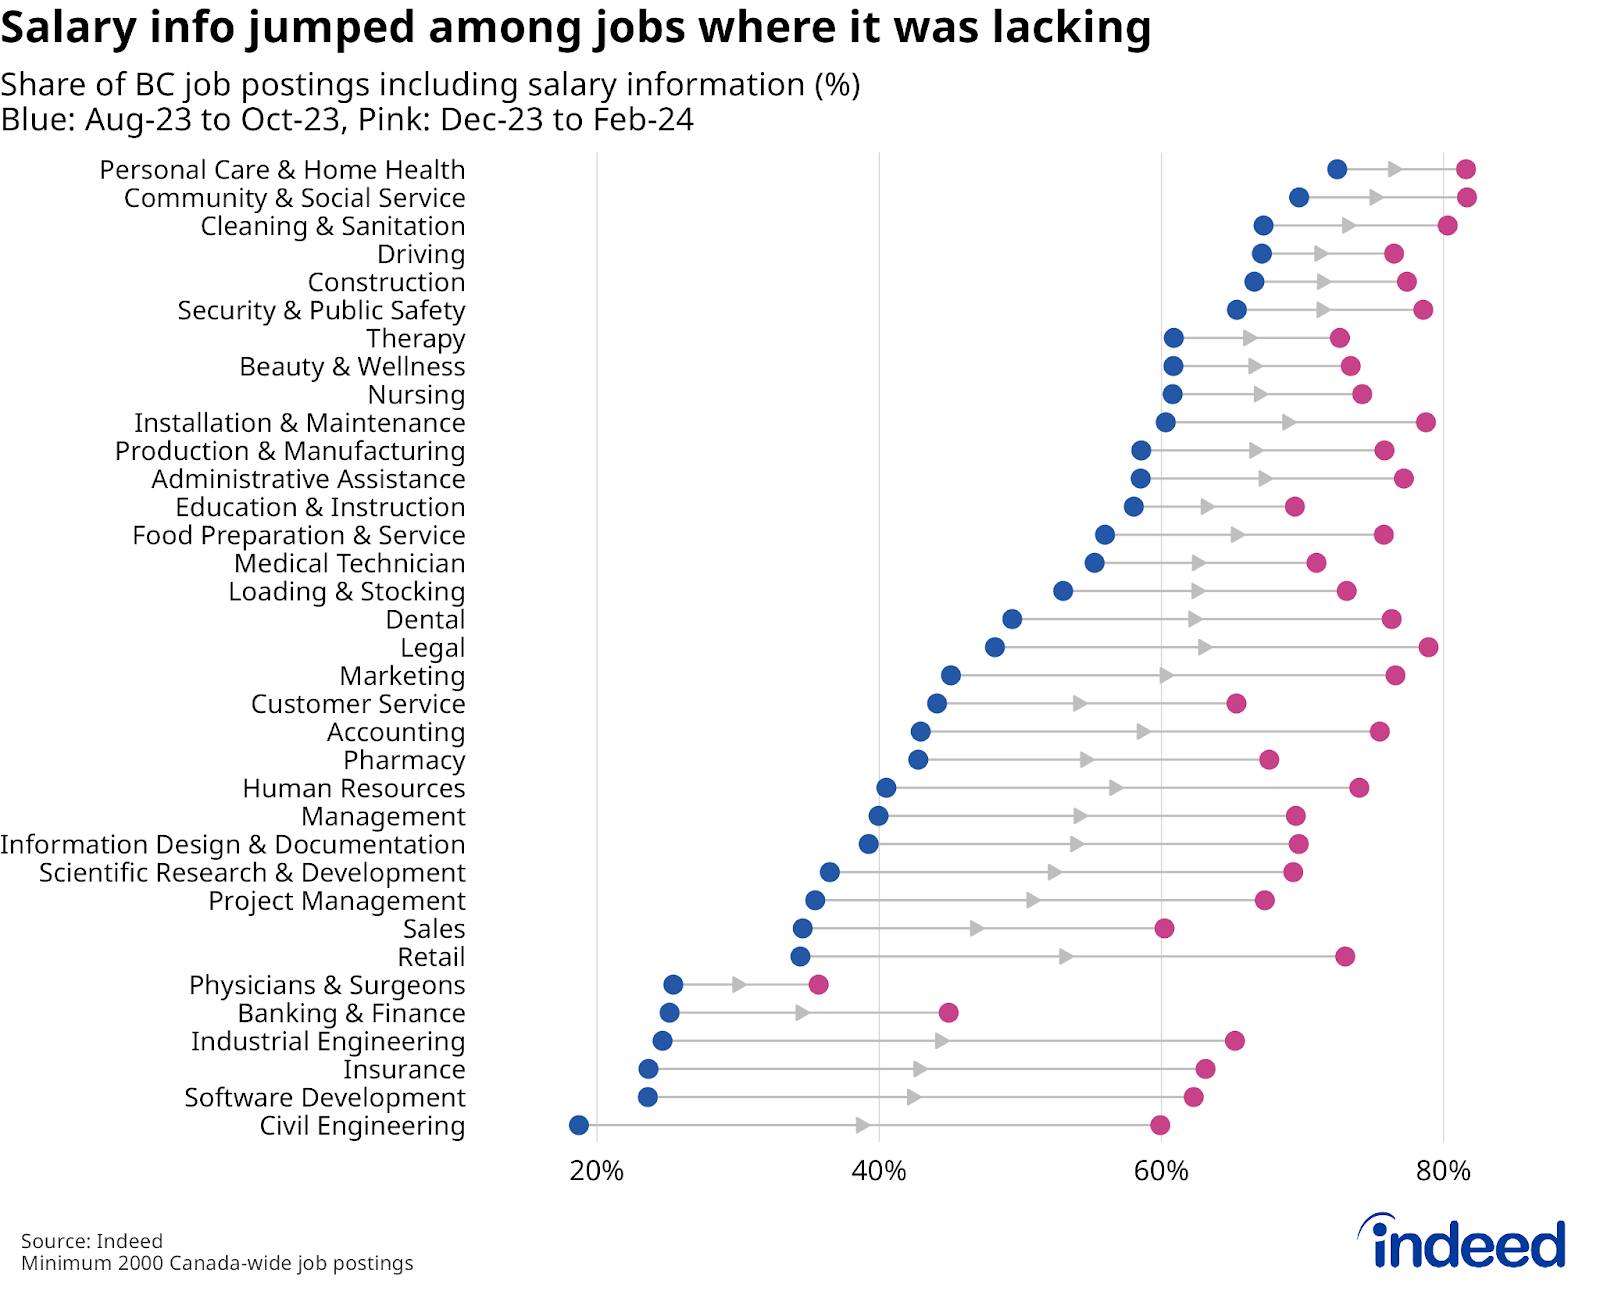
On the flip side, sectors where posted wages were already common, including in health care, cleaning and sanitation, and construction, didn’t shift as much. As of February 2024, no more than 90% of postings in any single occupation analyzed included salary data — a sign that there is still room to grow and that some employers are not yet fully compliant with the new requirements.
Limited labour market impacts from BC’s policy change so far
BC’s new posted salary requirement could affect the labour market in several ways. First, it might change the wage levels employers are advertising to potential candidates. However, it is difficult to assess the impact. Employers compelled to start including pay information might differ from the ones that already were posting wages, while broader economic trends are already influencing wage growth.
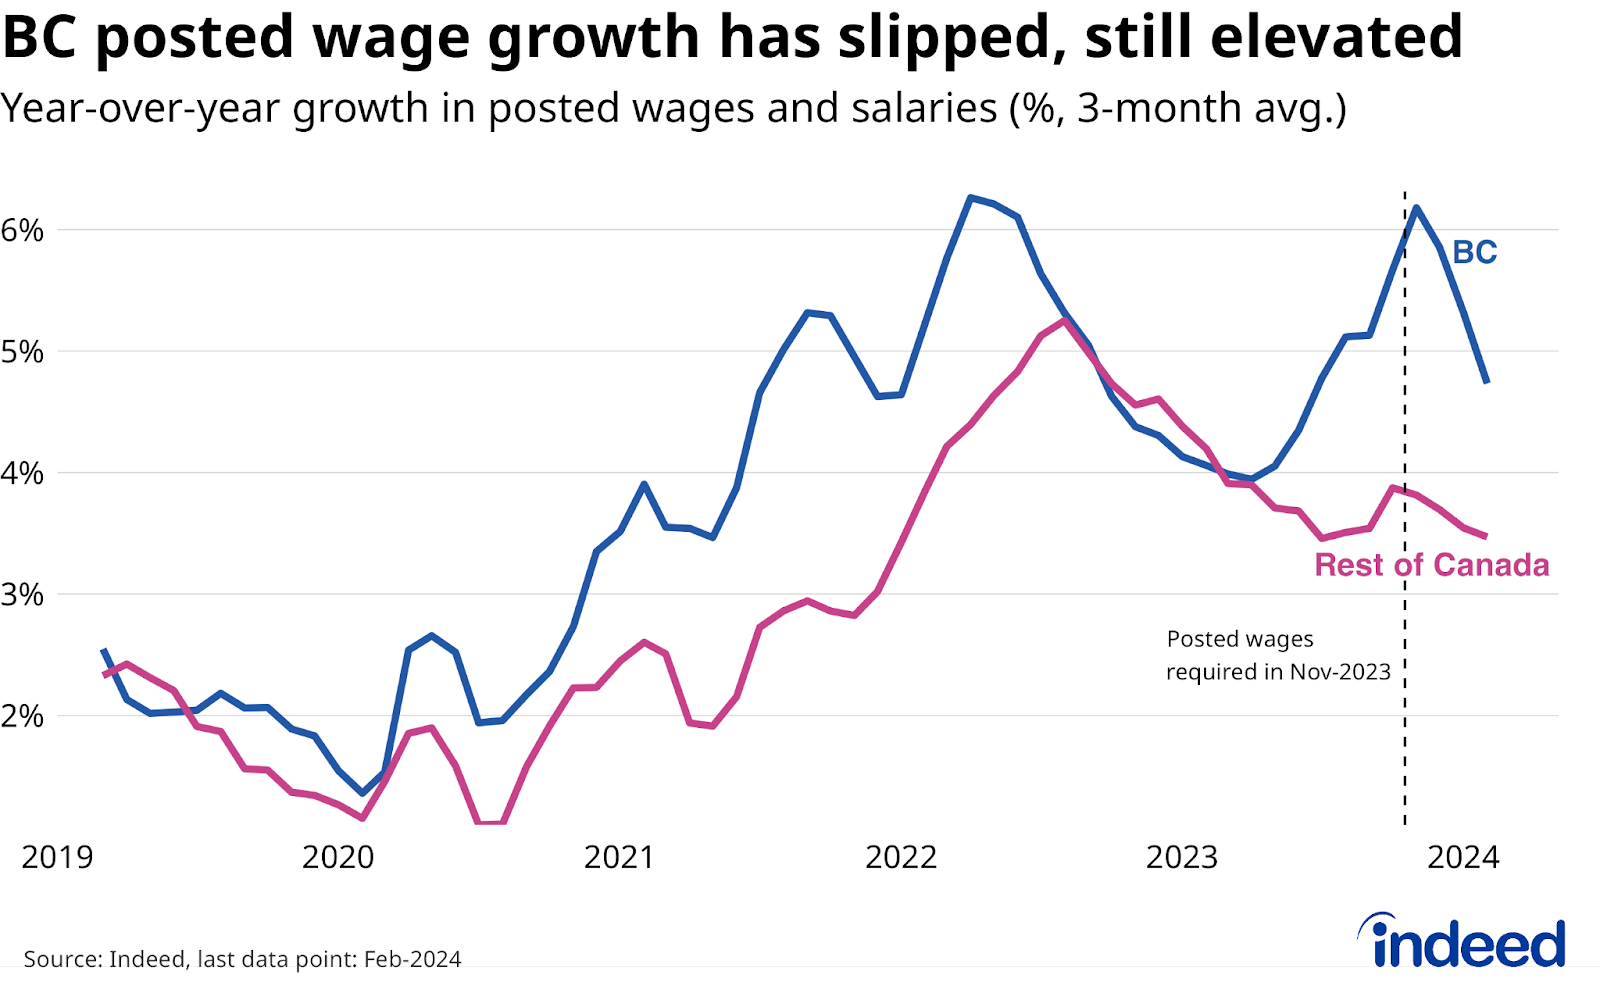
Overall, after adjusting for composition effects, posted wage growth on Indeed job postings in BC has slipped recently, from a rapid 5.7% year-over-year pace in October 2023 to 4.7% as of February 2024. By comparison, the pace in the rest of Canada eased from 3.9% to 3.5% over the same period. With posted wage growth both higher and more volatile in BC than the rest of Canada since 2021, it’s unclear how much the new law contributed to the recent deceleration.
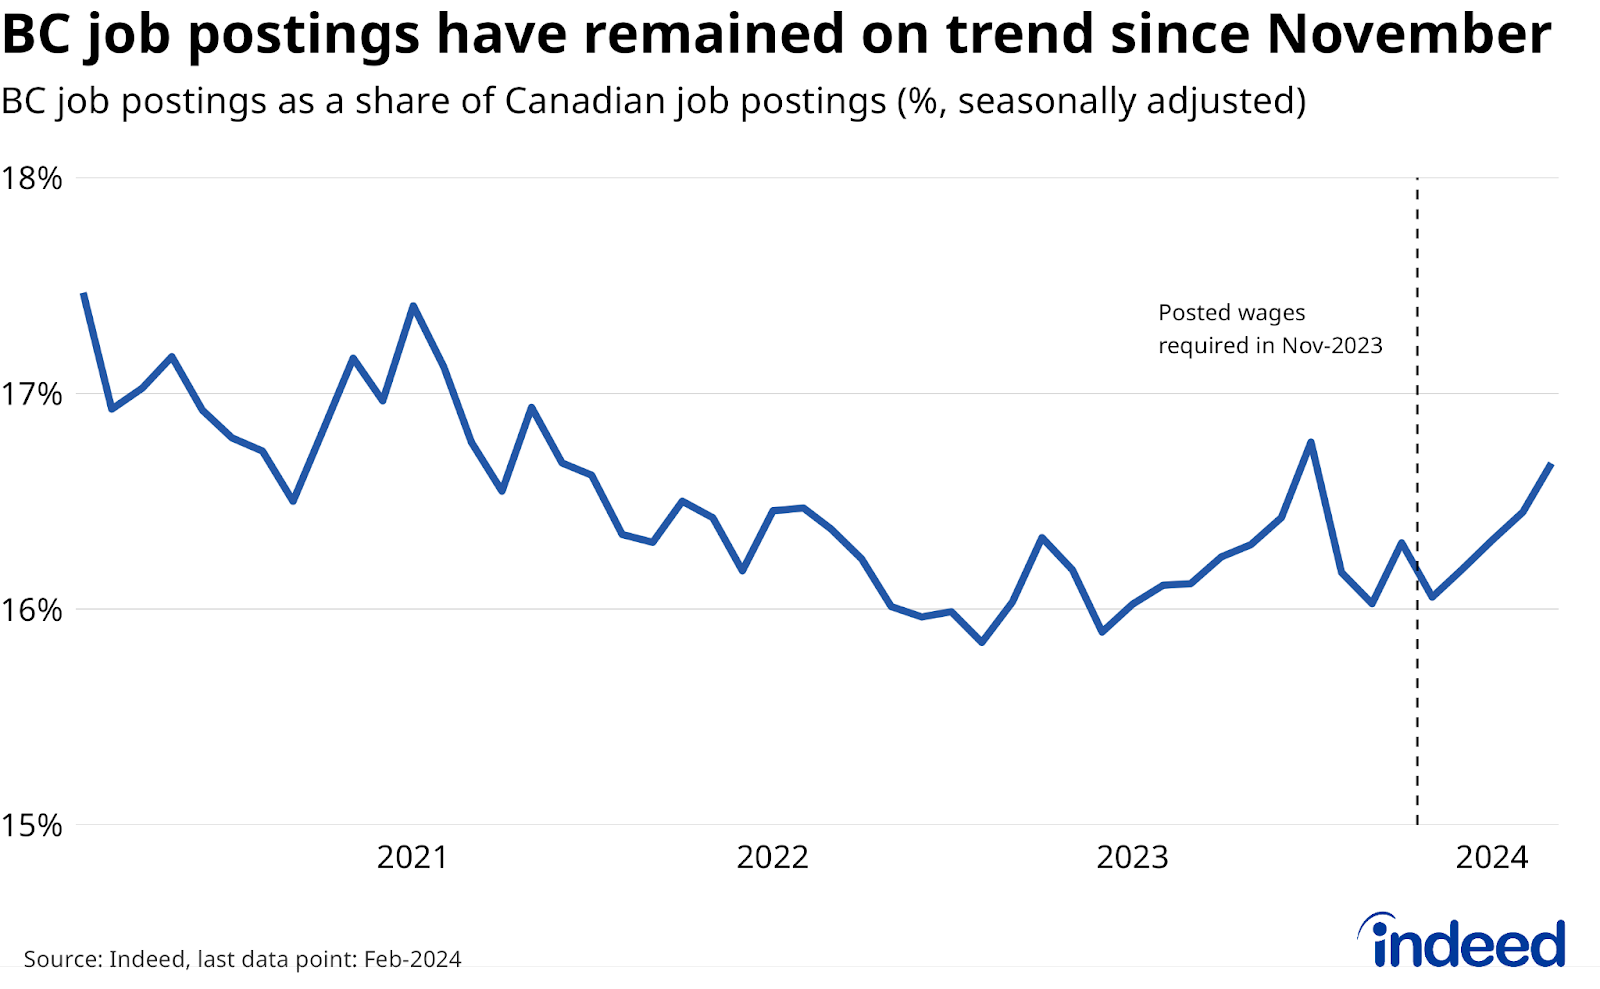
Another potential impact could be on recruitment activity more broadly. Some employers might hold off on posting a new job ad if they expect to pay higher wages, since candidates now have greater information about wage levels across the market. However, at least at the province-wide level, BC job postings haven’t lagged the rest of Canada in recent months. Instead, BC’s share of total Canadian job postings on Indeed ticked up between October 2023 and February 2024, standing slightly higher than it did a year earlier.
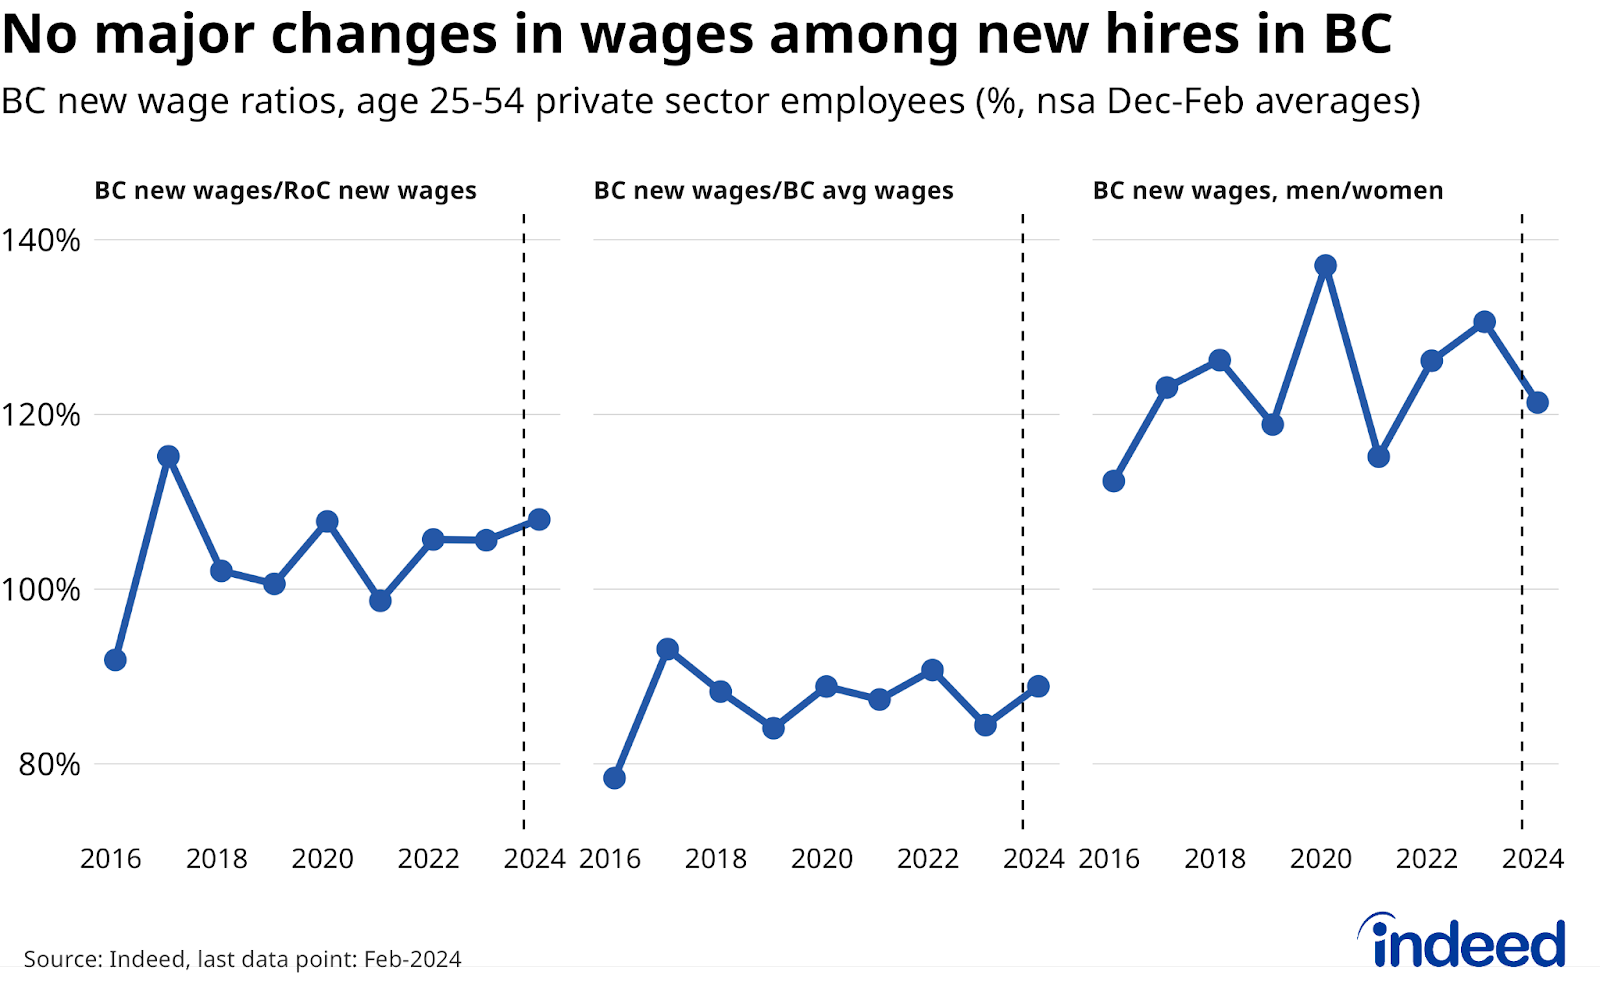
Finally, there’s the question of whether the jump in posted salary transparency has impacted the actual wages of new hires. So far there’s little indication of a substantial change, at least compared to the typically volatile nature of the data. According to the Labour Force Survey, between December 2023 and February 2024, wages of newly hired core-age (25-54-year-old) private sector workers in BC have evolved similarly compared to wages among BC workers more broadly, as well as compared to newly hired workers in the rest of Canada. There was also little change in the gender wage gap among new hires in BC.
It could be too soon to detect the broader labour market effects from the jump in frequency of posted salaries in BC. Posted salary transparency laws have had more notable impacts elsewhere. In Colorado, advertised salaries for jobs in the state rose in the wake of new local laws, while wages of new hires rose in Slovakia when a posted salary mandate came into effect. Greater salary information available to job seekers could improve the functioning of the labour market in several ways. Whether these effects appear in BC, where a substantial share of job postings already provided pay information before the policy, will have important implications for both the province’s labour market, and the rest of Canada too.
Methodology
Pay information is extracted from postings published on Indeed.com. We calculate the posted salary share of Canadian job postings by dividing the number of unique job postings containing salary information in a given month, with the total number of Canadian job postings over the same period. Median posted wage ranges exclude job postings with open-ended ranges (i.e. wages that indicate pay “up to” or “starting from”). All point estimates of posted salary shares and ranges for individual occupations represent 3-month moving averages.
To track the posted wage growth, we calculate the median posted wage for a given month, job title, region, and salary type (hourly, monthly, or annual), and then calculate year-on-year wage growth for each job title-region-salary type combination, generating a monthly distribution. Our monthly measure of wage growth for the country is the median of that distribution. More information about the data and methodology is available in a research paper by Pawel Adrjan and Reamonn Lydon, Wage growth in Europe: evidence from job ads, published in the Central Bank of Ireland’s Economic Letter series.
Wages of recent hires in the Labour Force Survey (LFS) reflect Indeed calculations using LFS public use micro-data, focusing on core-age private sector employees with job tenure of 1 month or less.