
Key Points:
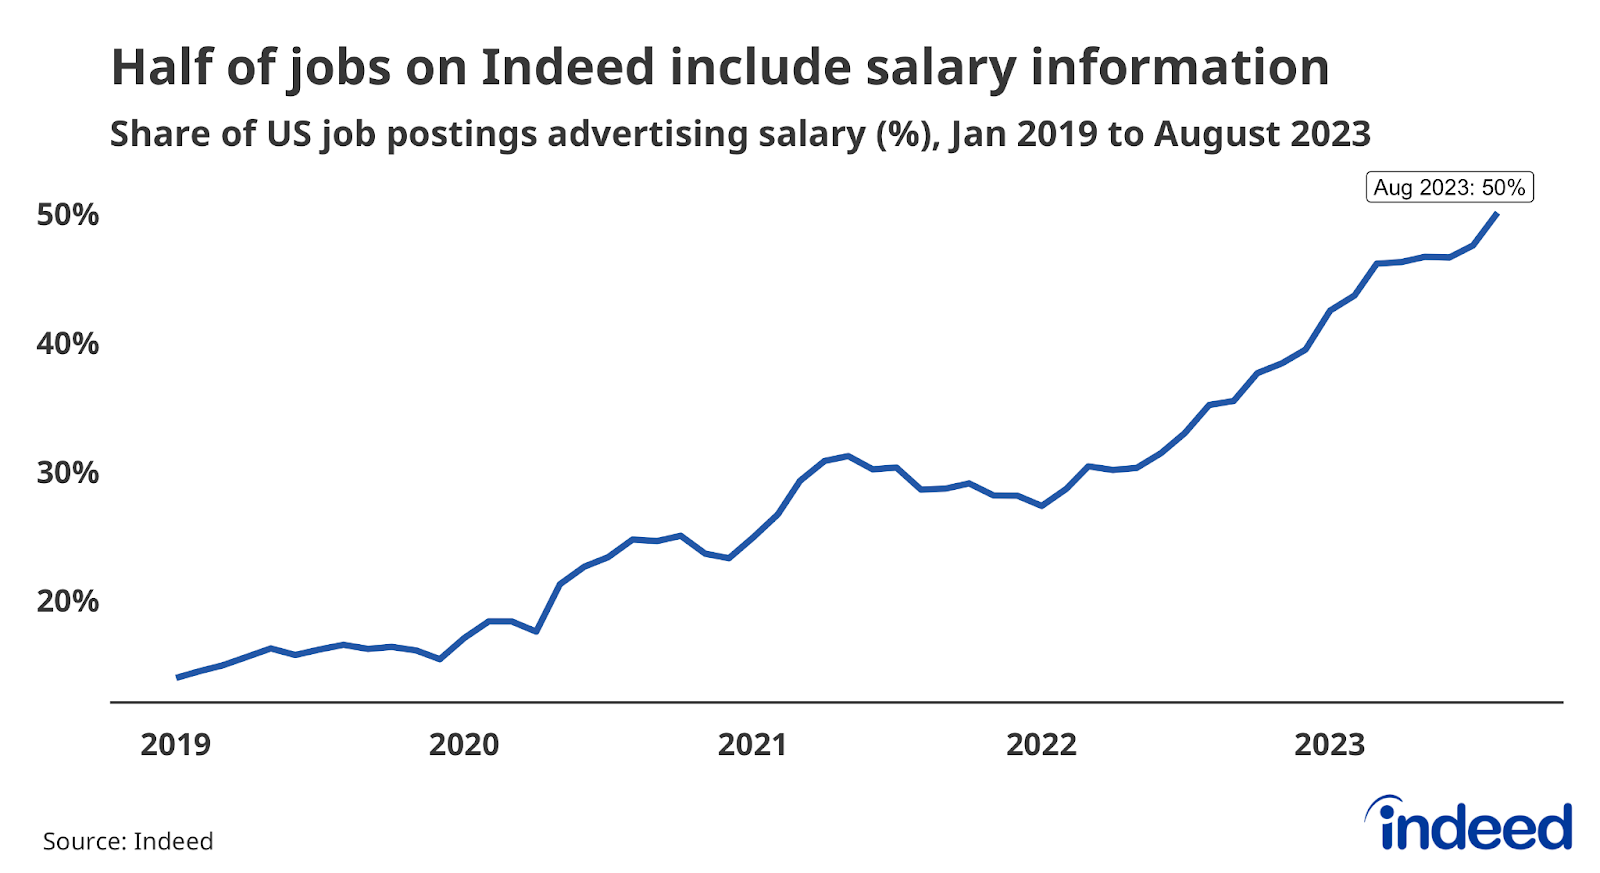
- In August, half of US job postings on Indeed advertised at least some employer-provided salary information, the highest share yet recorded by Indeed.
- In New York State, 61% of job postings featured some level of pay transparency in August, almost double from a year prior (31%) and the third-highest such jump of any state over the same period.
- New York’s pay transparency rate remains below other regulated states, suggesting transparency is likely to continue to expand once new regulations take effect on September 17.
- Metros in both California and Washington have seen larger pay transparency increases than the New York City metro area over the past year.
Providing pay information in job postings can be a way for employers to build more trust with their employees, attract new workers, and may potentially help close gender and racial pay gaps. These and other perceived benefits, paired with growing public support, have motivated salary disclosure laws in several states and a rise in pay transparency in recent years.
As of August 2023, half of US job listings on Indeed advertised some form of salary information. Mentions of salary in job postings began rising in early 2020 and then accelerated in 2022 due to regulations and a resilient US labor market. Overall, the share of postings with pay transparency has nearly tripled from its February 2020 level of 18% and is likely to continue growing in the coming months.
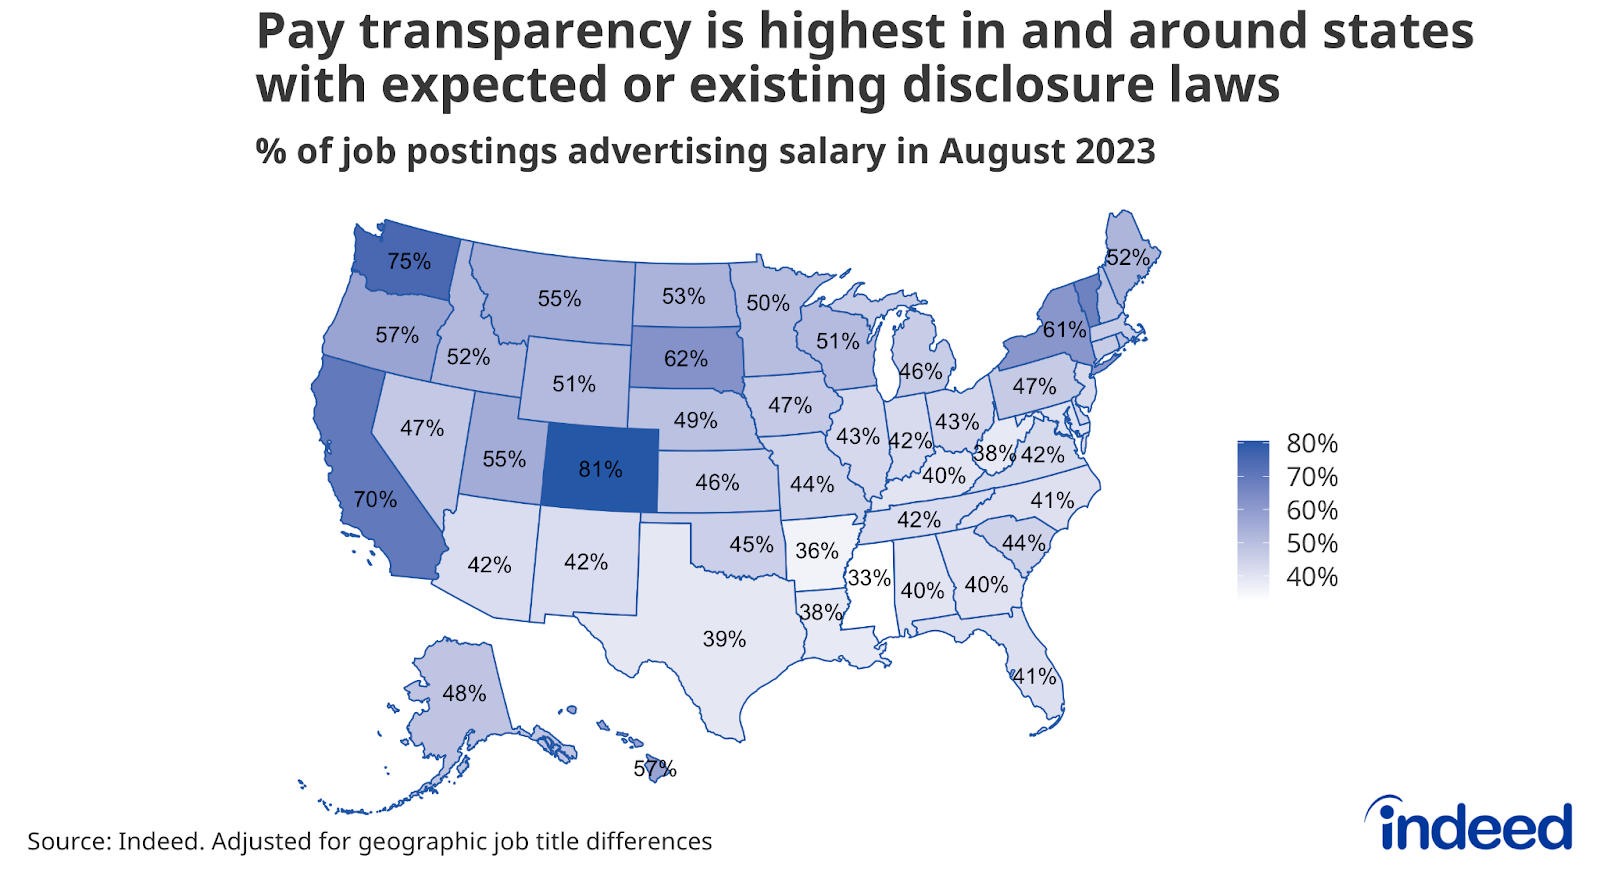
While salary transparency rates are rising overall, that growth is not occurring evenly across state lines and geographic regions. In general, employers in the West provide pay details in postings at the highest rate, while employers in the South are less likely to advertise salary upfront. In August 2023, Mississippi recorded the lowest transparency level, with only 33% of job listings advertising pay. Colorado held the title of most-salary-transparent state, with 81% of postings featuring salary data. This is perhaps unsurprising since Colorado’s pay disclosure laws have been in effect since January 2021—the longest of any state with similar laws already in place.
Despite significant growth, pay transparency in New York has more room to advance
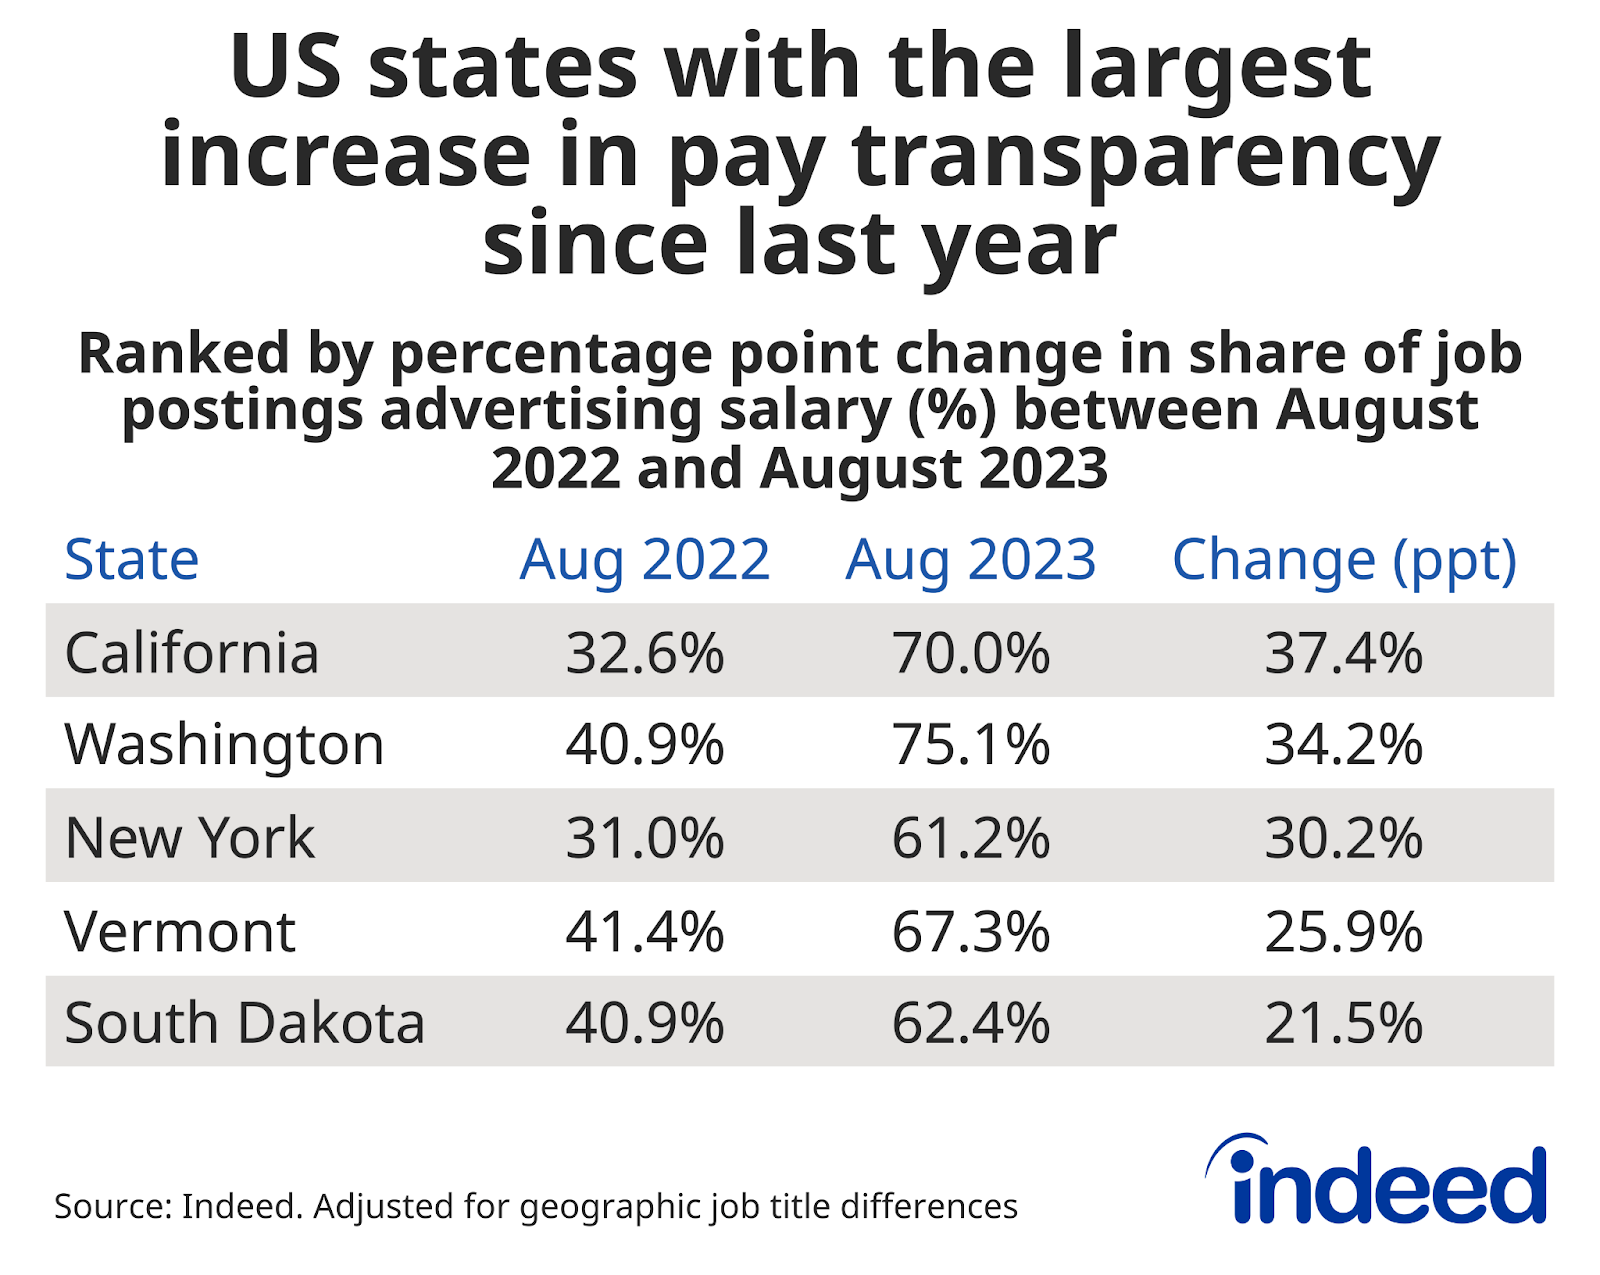
Despite geographic differences, the share of jobs advertising pay increased in every US state over the past year (August 2022–August 2023). This growth was fairly broad-based, with transparency shares jumping by 10 percentage points or more in 35 of the 50 states. Of these, five states recorded increases of 20+ percentage points in one year, including California (+37 ppts), Washington (+34), New York (+30), Vermont (+26), and South Dakota (+22).
But despite recording the third-largest increase in pay transparency over the past year, New York’s transparency rates are still well below levels in other regulated states (Colorado, California, Washington). This suggests there is still room for more growth once statewide disclosure requirements go into effect on September 17.
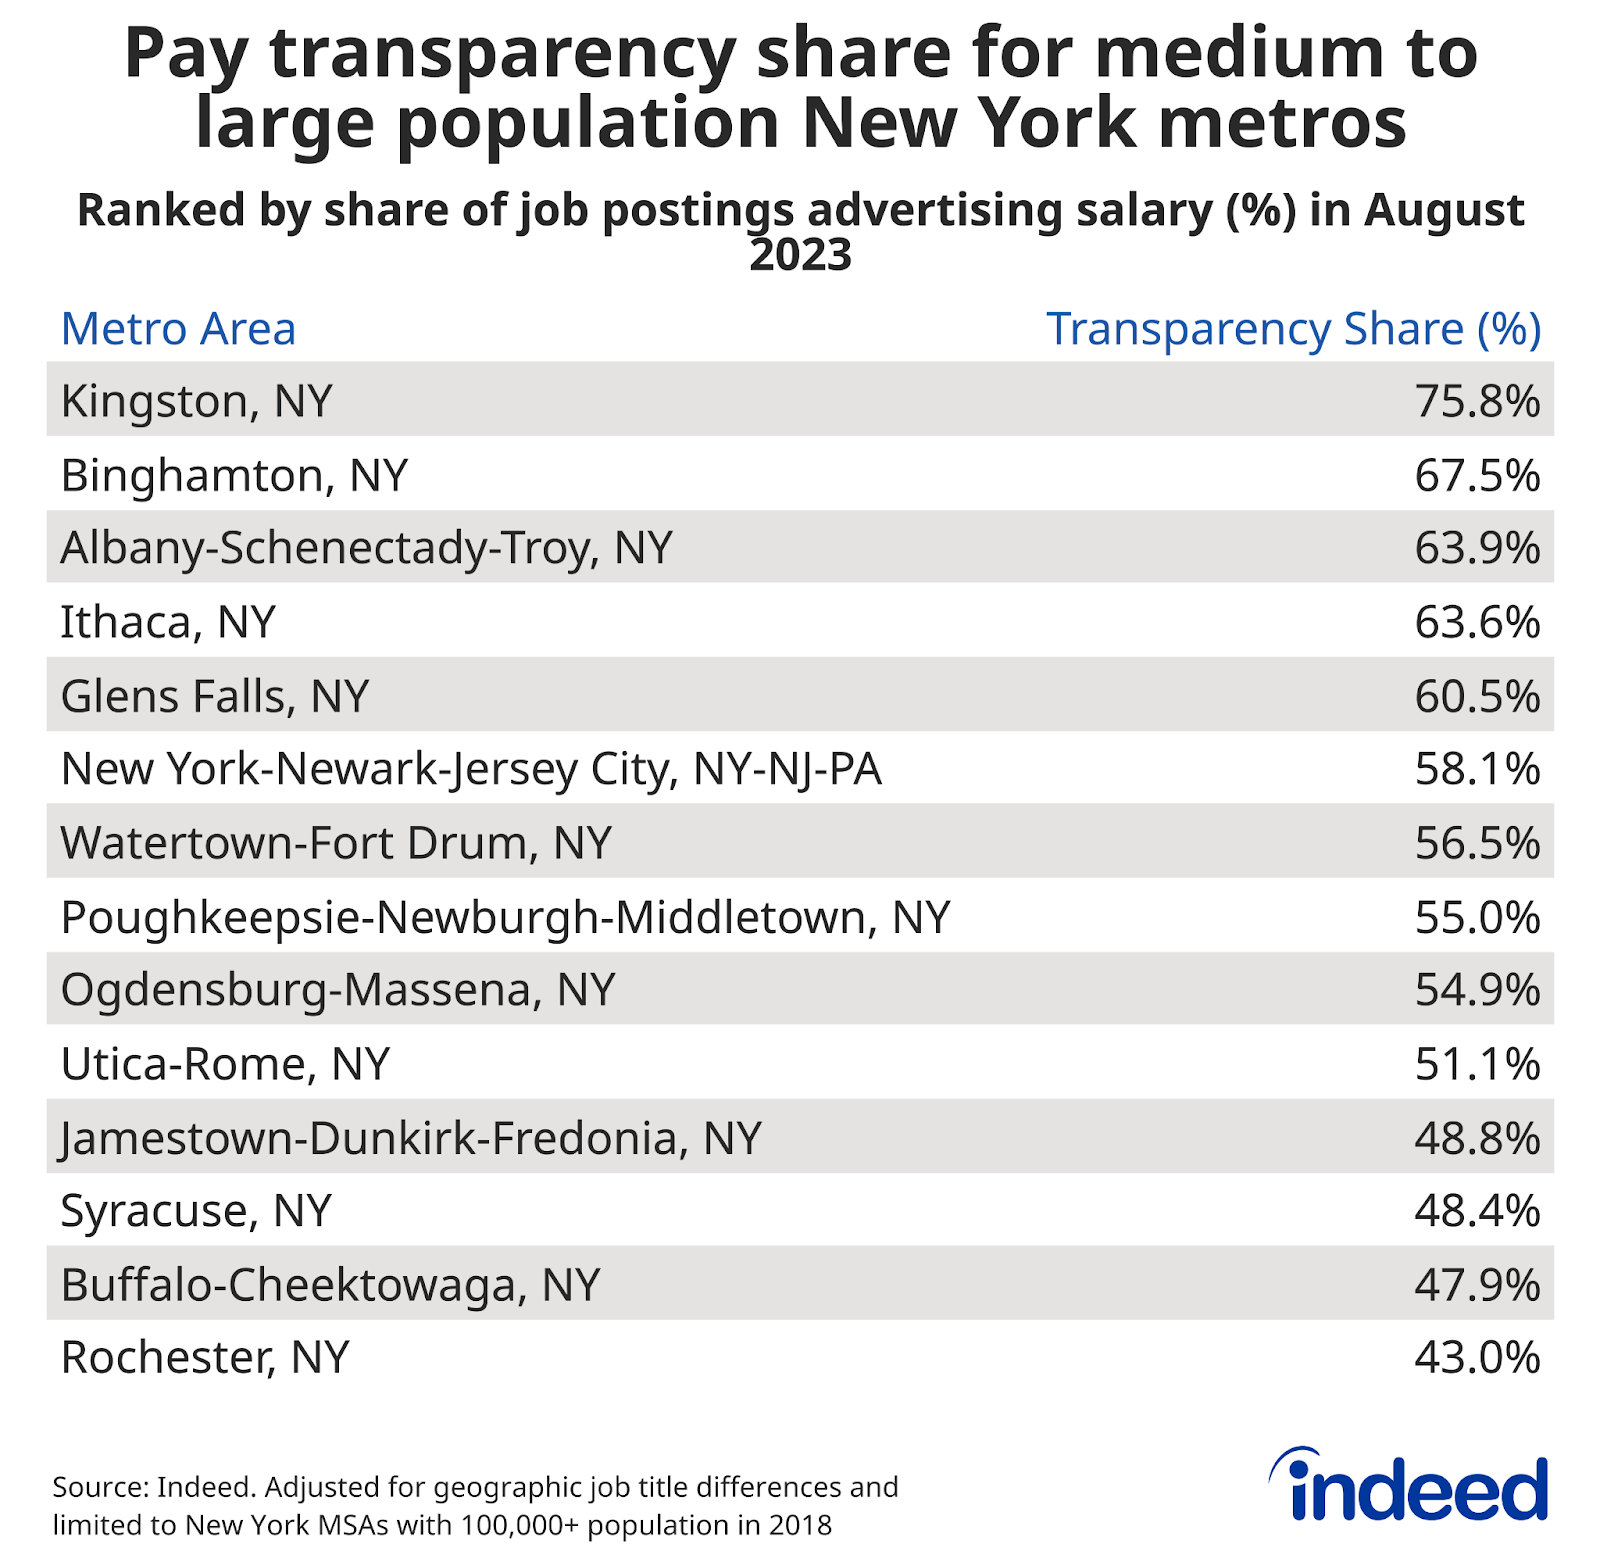
But the same state-state variation seen in national data is echoed in data from metro areas within the state of New York itself, evidence that statewide regulations are likely to drive local pay transparency levels higher. Among New York-state metropolitan areas analyzed (those with a metro population of 100,000 or higher), Kingston and Binghamton topped the list for the most transparent at 76% and 68%, respectively. The least transparent metros included Rochester (43%) and Buffalo (48%). Given the relatively low transparency in some metros across the state, and the prospect of impending regulation, we can expect to see some noticeable jumps in pay transparency in the coming months.
Interestingly, the New York City (NYC) metro has a noticeably lower share (58%) than some of its California counterparts (like San Jose at 73%). While some of this could be a difference in the way employers have reacted to the law, or differences in employer exemptions*, it is also likely a result of the fact that the wider NYC metro area crosses state lines into New Jersey and Pennsylvania. Neither of those two states are subject to pay transparency laws, and jobs posted in those non-regulated areas may be pulling down the headline share for the metro overall.
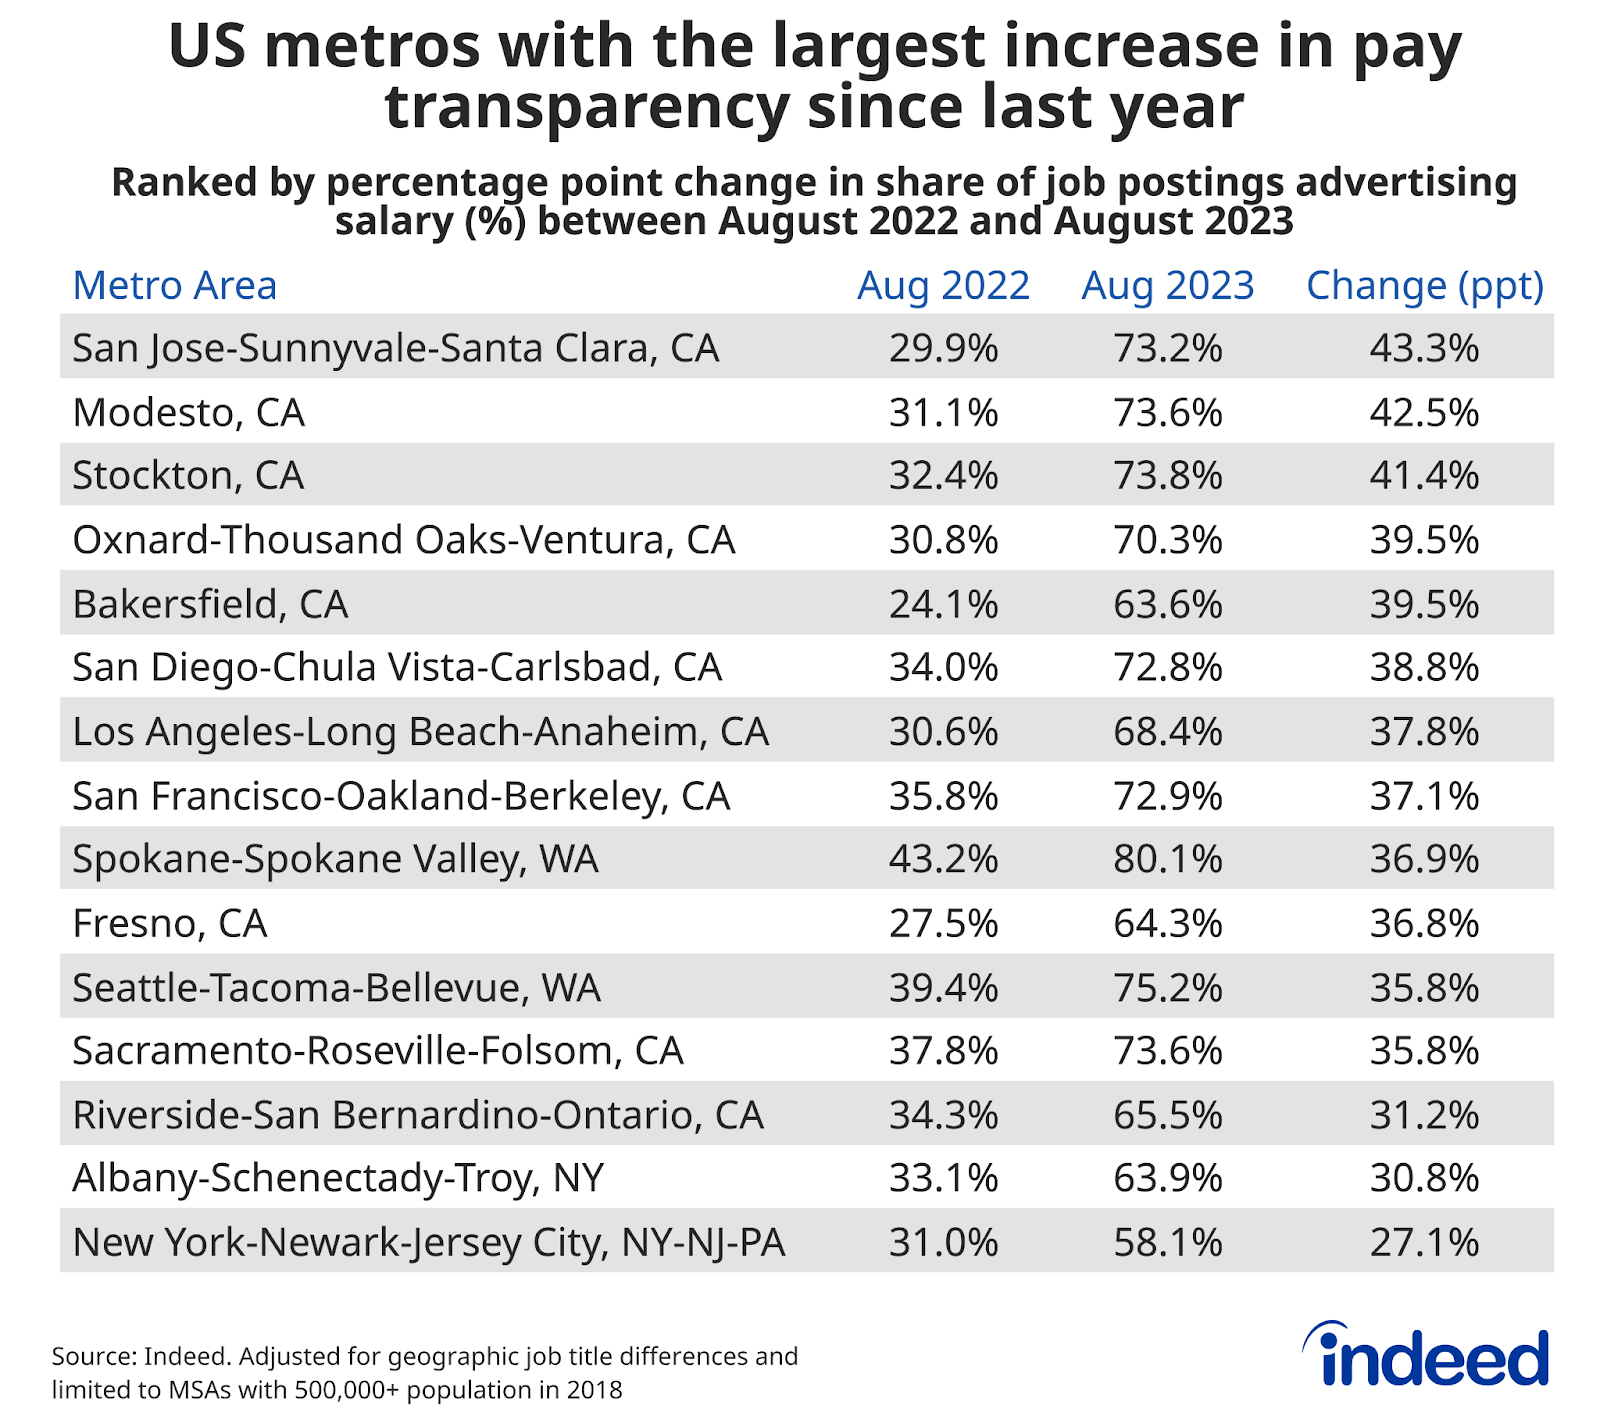
Pay transparency rates have grown the most in metros subject to pay disclosure laws
Over the past year, metros in areas with regulations that recently took effect have experienced the fastest growth in transparency. Eleven of the fifteen metro areas with the largest growth in transparency are in California, with San Jose leading the way with a 43 percentage point share increase over the last year. The New York City metro area narrowly made the top 15 list after growing from a share of 31% to 58% between August 2022 and 2023.
Conclusion
Pay transparency laws and tight labor market conditions are influencing higher rates of salary advertising in US job postings on Indeed, reaching a high of 50% of all jobs in August 2023. In the coming months, it is likely that we will see that upward trend continue as New York’s statewide disclosure laws go into effect. What remains to be seen is what role the softening labor market plays beyond that. Will employers remove salary information as it becomes easier to find workers, or is pay transparency here to stay?
Methodology
We calculate pay transparency share in US job postings by dividing the number of unique job postings with a salary into a total count of unique advertisements in a given month. Pay information is extracted from postings published on Indeed.com. Salaries advertised as being paid daily or weekly are omitted from the analysis.
Metropolitan area (MSA) data is filtered based on population in 2018. MSA data is presented as a weighted share to control for regional differences in job composition. We consider an MSA fully covered under the law if it falls into a state or city with an active regulation. Additionally, we consider an MSA covered if it overlaps state lines and falls in a state with pay transparency laws. *Pay transparency may measure below 100% in areas with regulation due in part to exemptions for employers with fewer than a set number of employees, or employers of temporary help or contractors. For instance, employers with fewer than 15 employees are not required to comply with the California and Washington regulations. Additionally, some legislation, like that in New York City, provides exemptions for temporary help firms. Finally, employers may choose not to include clear salary information despite the regulations.