
Key Points:
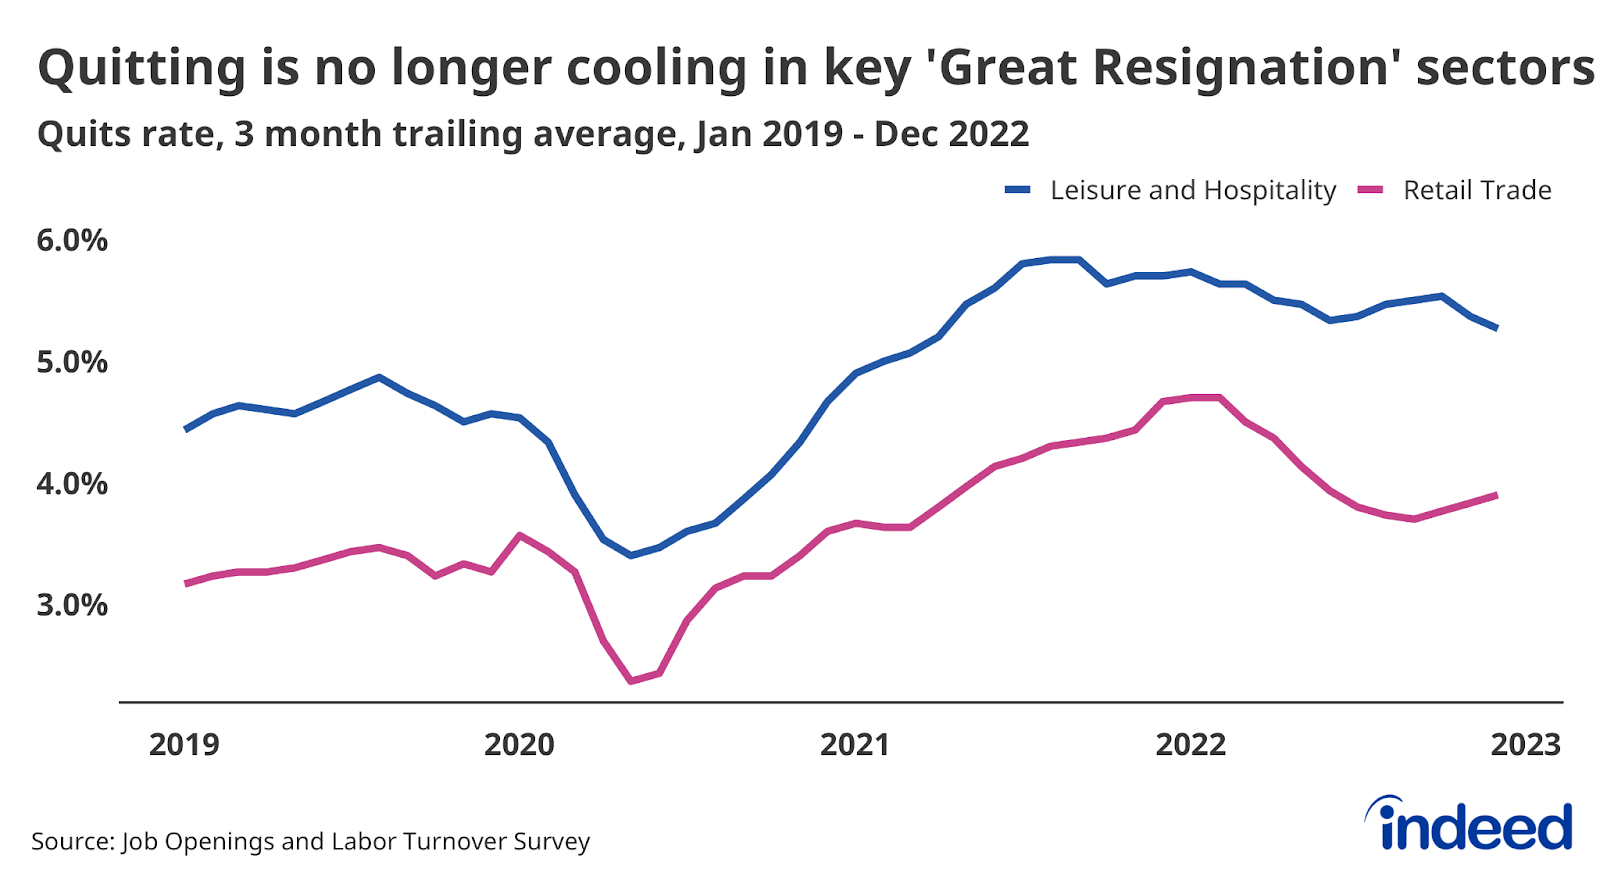
- The Great Resignation isn’t over yet, as quitting remains elevated, particularly in low-wage, high-churn sectors such as Leisure and Hospitality and Retail Trade.
- The US labor market remains hot with elevated demand for workers and relatively low levels of joblessness, leading to strong nominal wage gains for workers.
- Announced layoffs in the tech and media industries are grabbing headlines, but layoffs remain low. In fact, total monthly layoffs are still about 25% below their pre-pandemic average.
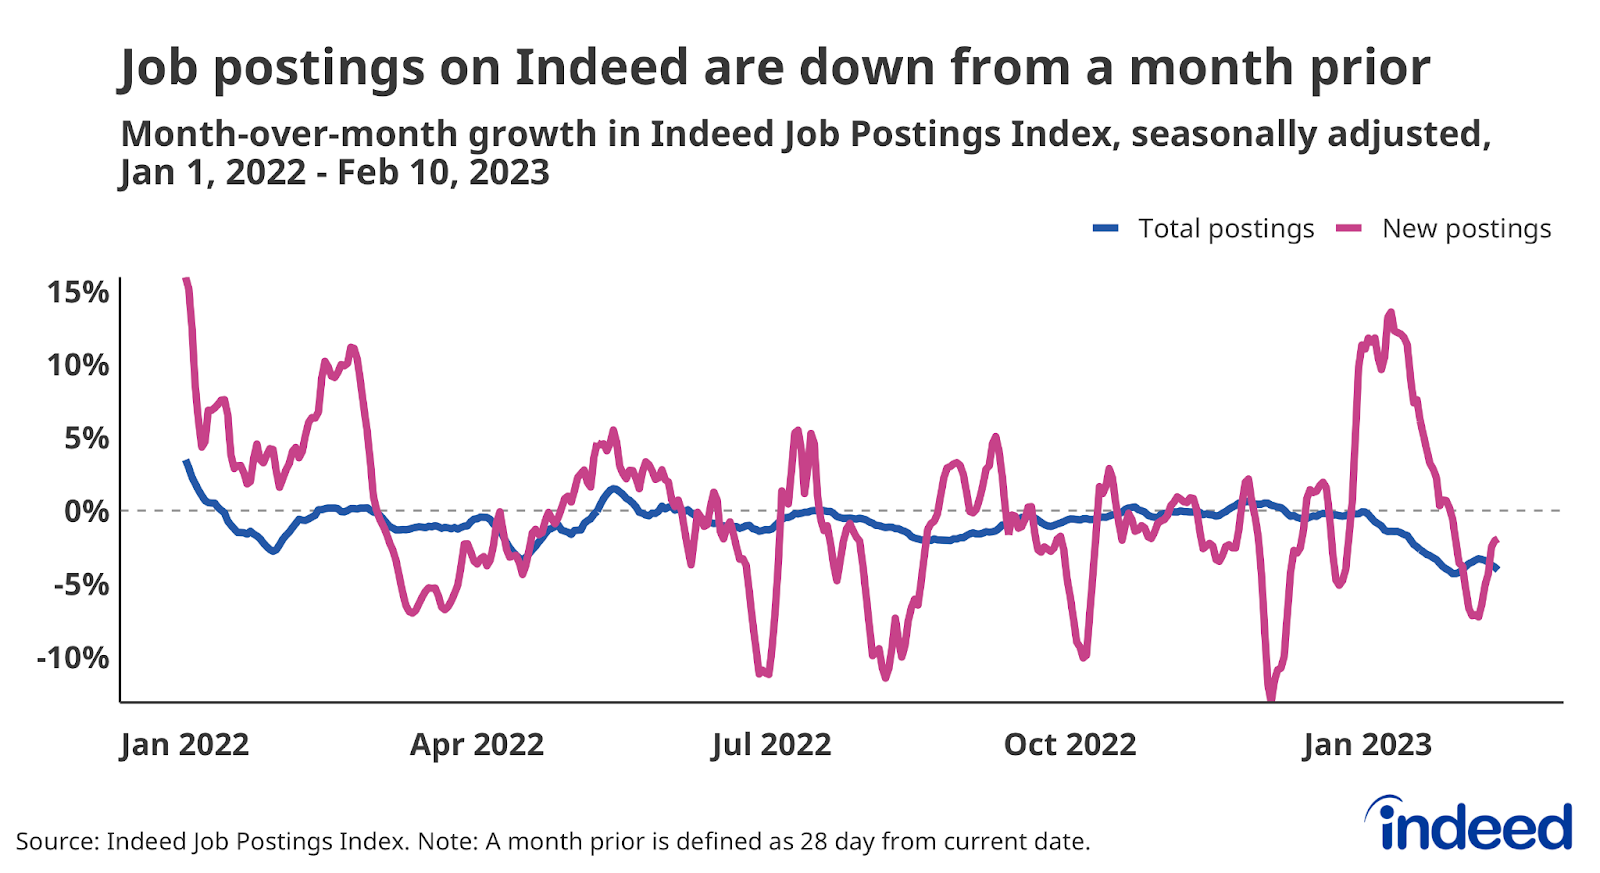
- The Indeed Job Postings Index shows that while job postings remain elevated, they are moderating, with total postings down about 4% from a month prior as of February 10, 2023.
- While nominal wage gains remain strong, it has declined recently. However, any descent toward pre-pandemic levels may take some time.
Spotlight: the ‘Great Resignation’ isn’t over yet
Whoever said ‘quitters never prosper’ never saw the US labor market of 2021. As the US economy sprinted out of the gate in the spring of 2021, workers started quitting their jobs at rates not seen in several decades. This surge in voluntary resignations resulted from workers embracing new jobs and higher wages. The rise in quitting was most noticeable in low-wage, in-person sectors that saw big increases in demand for new workers.
After rising for much of 2021, the quits rate in these sectors and the overall labor market started to decline. This moderation suggested demand for new hires was declining and workers switching jobs would likely see smaller wage gains. Recently, quits have stopped their descent and have leveled off. This is particularly true in two poster child industries for the Great Resignation: Leisure and Hospitality and Retail Trade.
One consequence of continued churn is higher wage growth for a longer time. If competition for new hires doesn’t moderate more, employers will need to attract workers through higher wages, more generous benefits, or more flexible work arrangements. Workers in sectors where demand stays stong will be able to retain more of their bargaining power. However, a longer-lived ‘Great Resignation’ may further diminish the chances of a soft landing.
Labor Market Overview
The US labor market remains hot. Employment continues to grow at a brisk pace and joblessnes is low despite a large and rapid rise in interest rates and slowing economic growth. Some sectors are going through difficult periods, but demand to hire new workers remains robust and layoffs are low. While wage growth has cooled, it remains elevated compared to pre-pandemic rates. In short, the labor market is stubbornly strong. This resilience might waver in the face of even tighter monetary policy or an unforeseen shock to the global economy, but the labor market is unlikely to weaken rapidly in the months ahead.
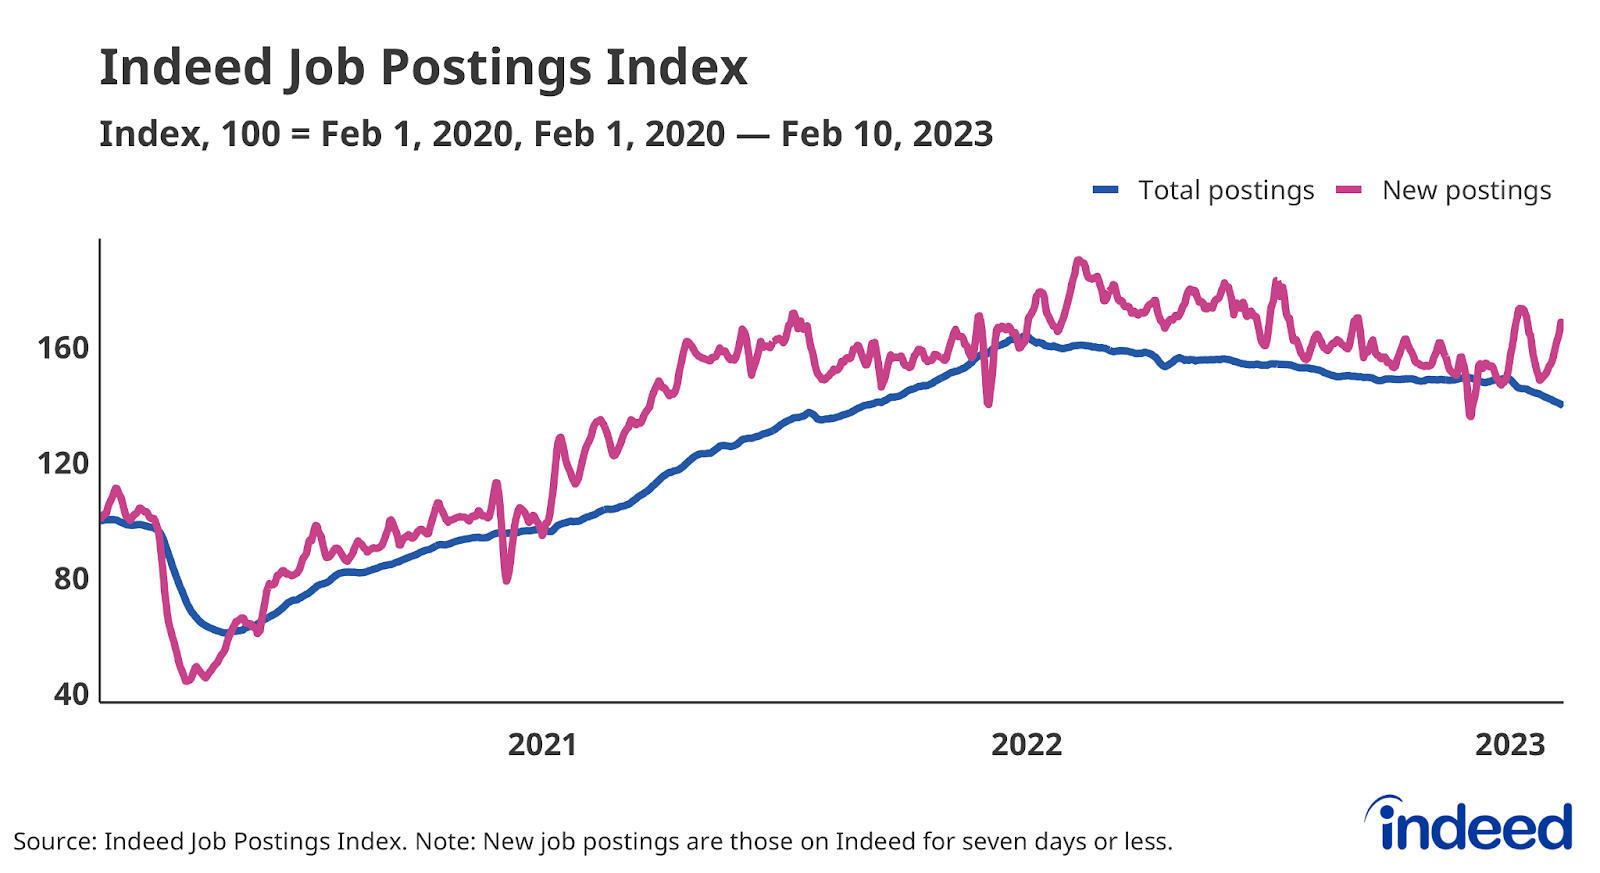
Employer demand for workers remains strong, even if it is fading. According to government data, job openings peaked in March 2022. Yet they still outnumbered unemployed workers and the overall labor force as of the end of December. More timely data, such as Indeed’s Job Postings Index, indicate that employers’ hiring appetites have faded so far in 2023. Total job postings are down 4.1% over the past month as of February 10 while new postings, defined as those on Indeed for seven days or less, are down 1.9% over the same time period. However, both series are still well above their level just prior to the COVID-19 pandemic.
People have returned to work
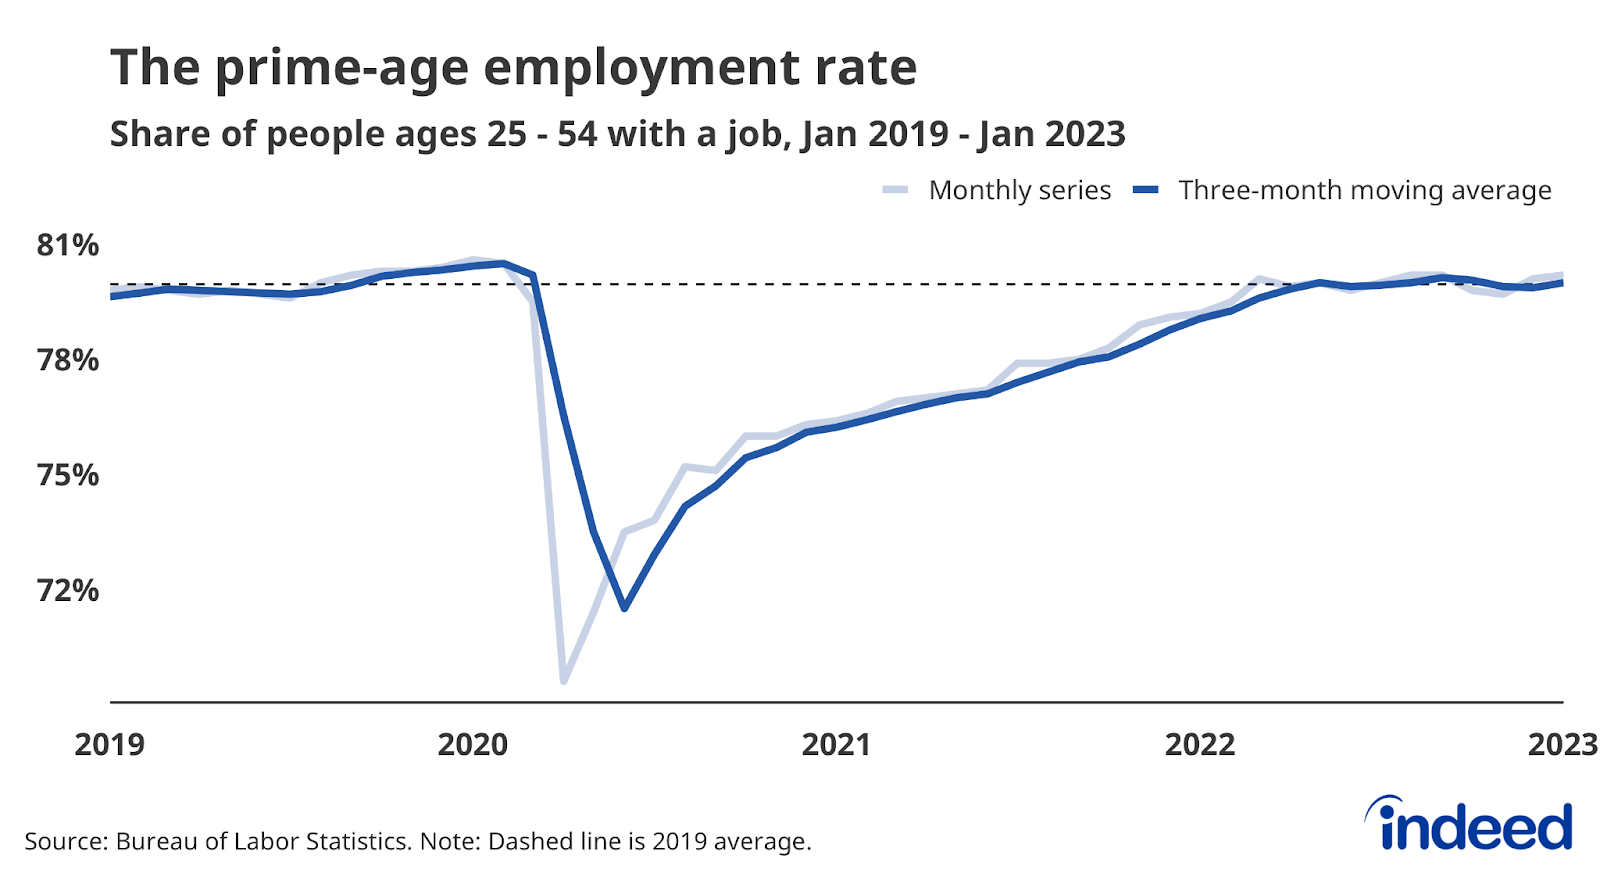
Strong demand has led to robust hiring and more workers finding jobs. Despite concerns about the short-term responsiveness of labor supply, employment rates for core demographic groups are now back to healthy levels. Consider the employment-to-population ratio for workers ages 25 to 54, a good measure of the health of the labor market. This ratio is now slightly above its average level in 2019 and close to its February 2020 peak.
The employment rate for all workers is further from its pre-pandemic rate, due in large part to a lagging recovery for older workers. Many people continue to ‘unretire,’ but the recent decline in this trend and a rise in workers entering retirement suggests we shouldn’t expect older Americans to be a significant source of employment moving forward.
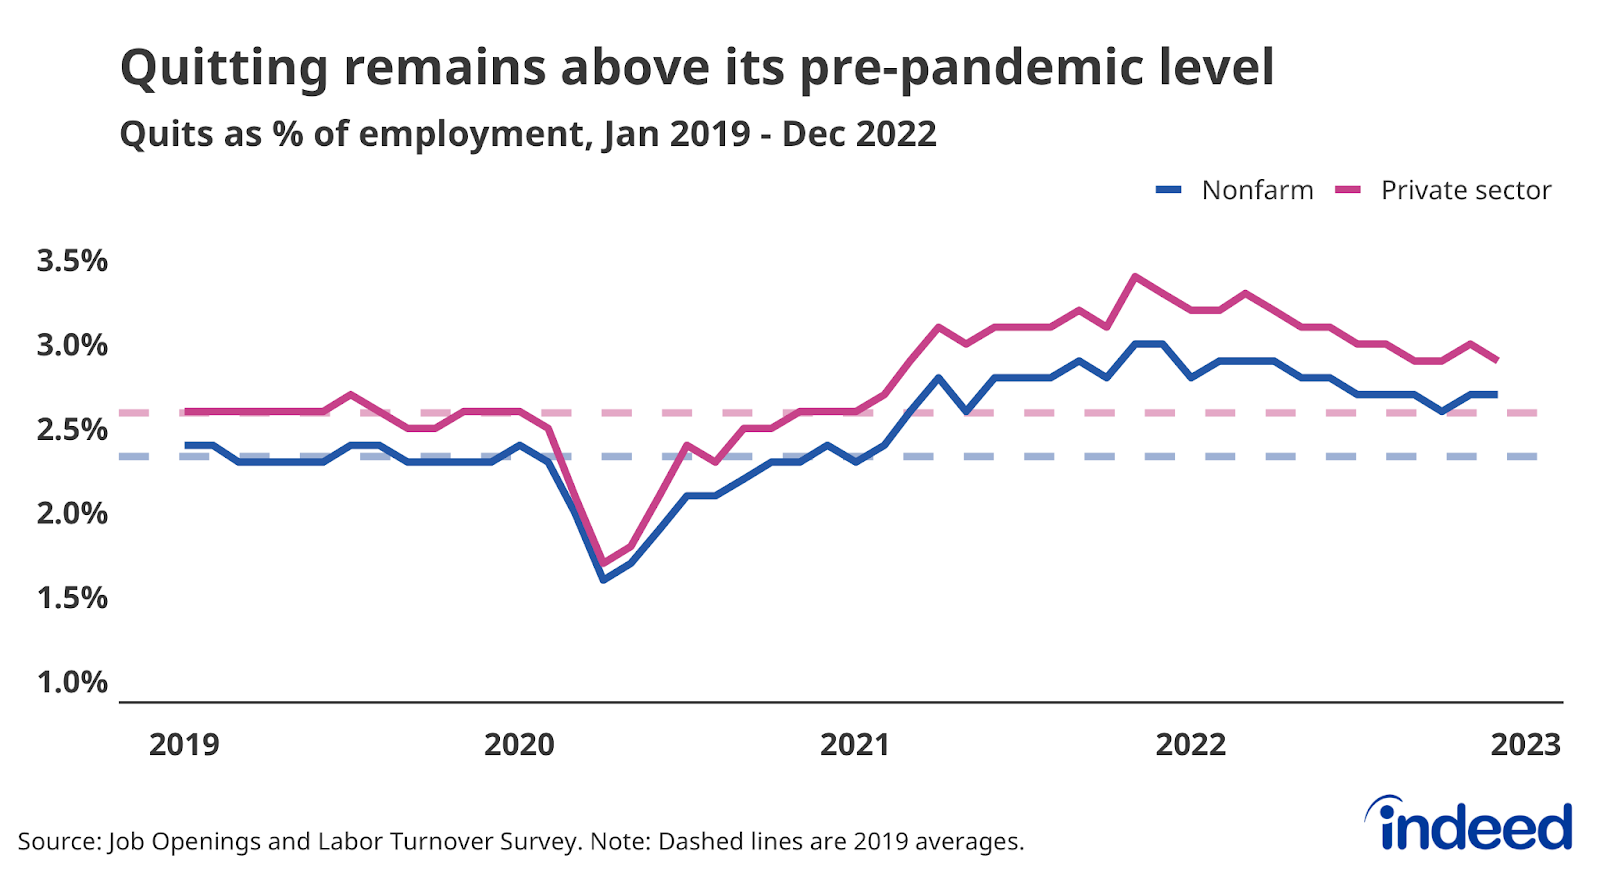
Quitting is still elevated, as layoffs remain low
While cooling somewhat last year, the job quitting rate is still 16% above the pre-pandemic norm as employed workers continue to find new work at elevated rates. As noted above, the decline in quitting in high-churn sectors, namely Leisure and Hospitality and Retail Trade, has petered out. Continued elevated rates of quitting would support wage growth as workers quitting their old jobs and finding new ones is a major source of wage gains.
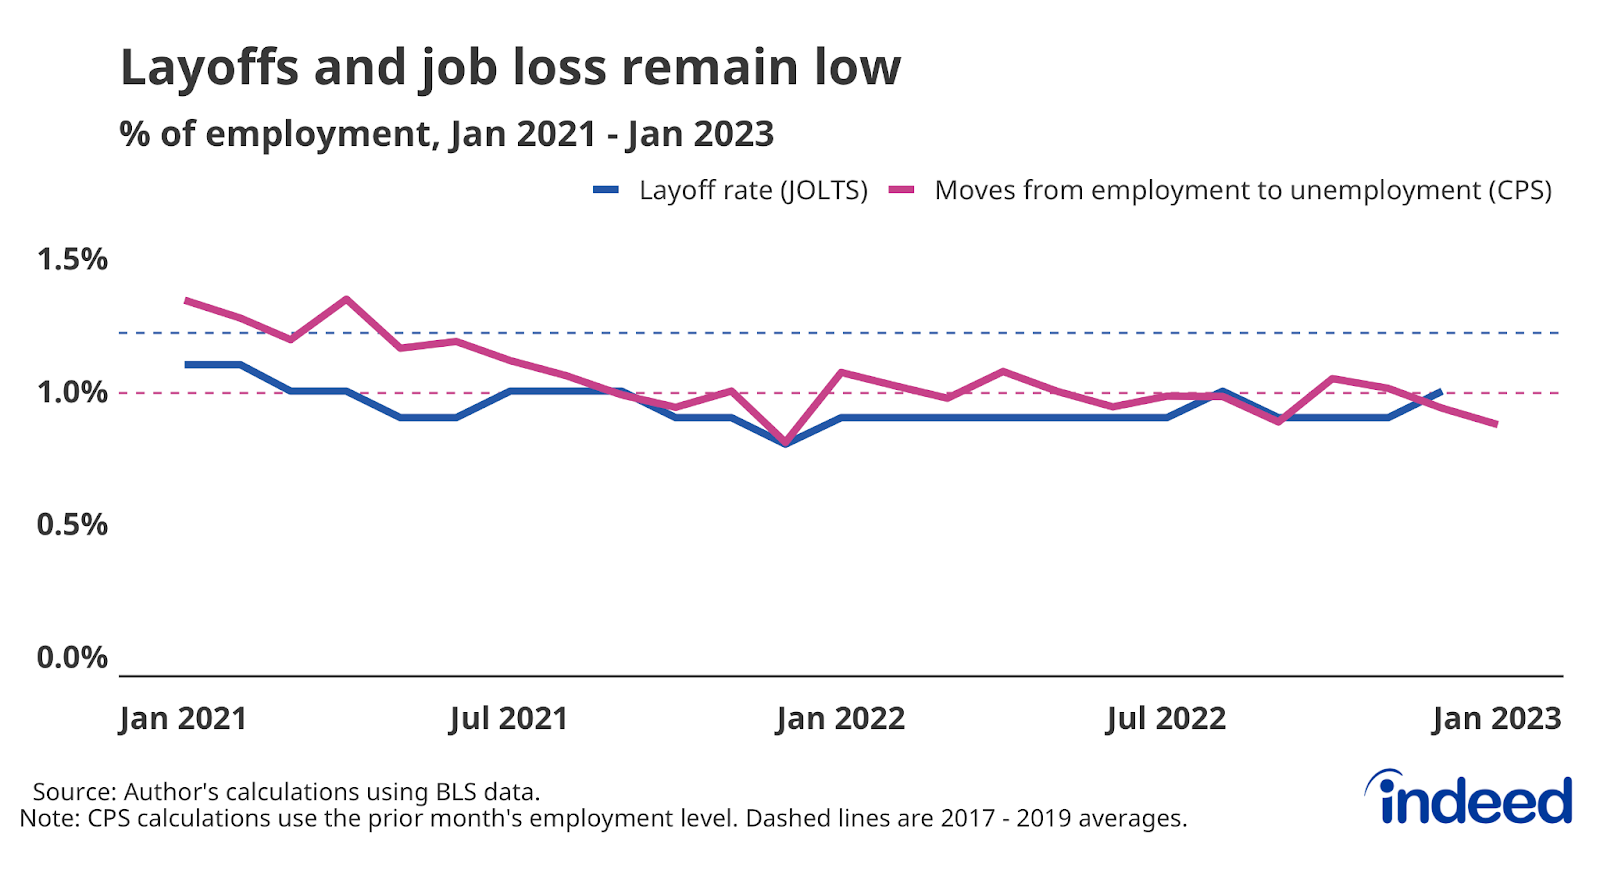
Workers are voluntarily leaving their jobs at high rates, but employers seem reluctant to let go of their employees. The recent wave of announced layoffs in the tech sector signals a painful recalibration in that sector, but layoffs across the economy are starting from a very low level. Layoffs have averaged about 1.4 million a month from October through December. They would have to rise about 25% in order to return to their monthly average of 1.8 million in 2017 through 2019.
Furthermore, what’s happening in the tech sector isn’t necessarily a portent of the overall labor market’s future. Technology companies have a much bigger footprint in stock indexes than they do in the labor market, in which they employ less than 2% of workers.
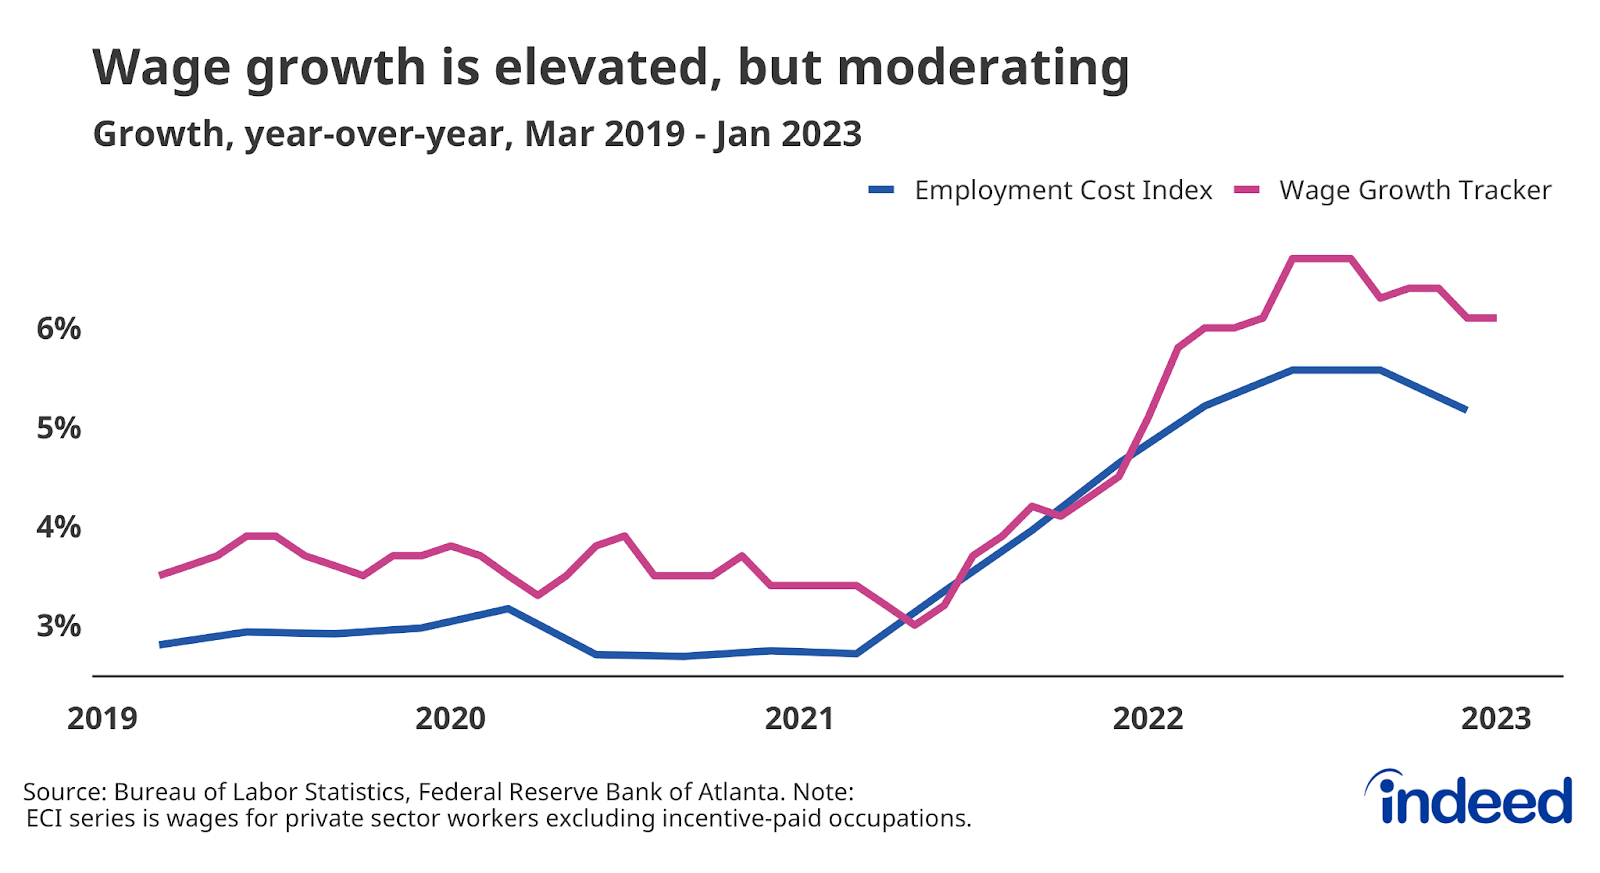
Wage growth remains strong
Strong competition for new hires across multiple sectors pushed wage growth up between 5% and 6% on an annual basis, a faster growth rate than at any point over the past 20 years. This is what economists call nominal wage growth — pay gains before taking inflation into account. However, rising prices are eating away at those gains and causing many employees to lose ground when it comes to actual purchasing power.
Several measures of wage growth show that wages have started to slow down. However, the rate of this deceleration is unclear, and wage growth is still well above its slower circa-2019 pace.
The US labor market has plenty of opportunities for workers, while also presenting challenges to employers. However, the current situation will surely change. We will continue to monitor these trends and track others as the labor market evolves.
Methodology
Data on seasonally adjusted Indeed job postings are an index of the number of seasonally adjusted job postings on a given day, using a seven-day trailing average. February 1, 2020, is our pre-pandemic baseline, so the index is set to 100 on that day. We seasonally adjust each series based on historical patterns in 2017, 2018, and 2019. We adopted this methodology in January 2021. Data for several dates in 2021 and 2022 are missing and were interpolated. Non-seasonally adjusted data are calculated in a similar manner except that the data are not adjusted to historical patterns.
The number of job postings on Indeed.com, whether related to paid or unpaid job solicitations, is not indicative of potential revenue or earnings of Indeed, which comprises a significant percentage of the HR Technology segment of its parent company, Recruit Holdings Co., Ltd. Job posting numbers are provided for information purposes only and should not be viewed as an indicator of performance of Indeed or Recruit. Please refer to the Recruit Holdings investor relations website and regulatory filings in Japan for more detailed information on revenue generation by Recruit’s HR Technology segment.