
Key Points:
- The chances of a soft landing in the labor market may be fading, but the current state of the Retail Trade sector is a good example of how this could happen: Hires and quits slow as layoffs stay low.
- The US labor market remains hot with strong demand and relatively low levels of joblessness, leading to strong wage gains for workers.
- Job postings on Indeed were 48.5% above their pre-pandemic baseline as of September 23, signaling robust hiring intentions. New job postings also indicate a strong appetite for new hires, coming in at 57.8% above their Feb 1, 2020 level.
- The high level of competition for hires is the main source of strong wage growth, although the gains for many have been wiped out by inflation.
- Workers are still quitting their jobs at rates above those seen before the pandemic, but layoffs remain near two-decade lows.
Spotlight: Employment growth is slowing in retail trade, but layoffs remain low
Job growth has continued to power ahead this year, despite expectations that it was bound to substantially decline. Although overall employment is growing at a more moderate rate than it was last year, the pace is still rapid. Over the past three months, payrolls have increased by an average of 378,000 jobs a month. That’s more than double the monthly average in 2019 when the unemployment rate was roughly the level it is now.
This level of growth is not what the Federal Reserve would like to see as it tries to push inflation down through rising interest rates. The question remains as to what is the best way to curb inflation while also ensuring the job market remains steady and unemployment stays low.
Job gains will cool eventually, but the question is how will that cooldown manifest itself? The Federal Reserve has recently abandoned the idea of a “softish” landing and projects a rising unemployment rate rise moving forward. Central bankers now don’t believe new jobs could be added at a slower rate without a large rise in the rate of job loss. But the recent trends in the retail sector provide a case study of exactly that happening.
Spending on retail goods has slowed as high inflation crimps household budgets and people return to pre-COVID habits and consume more services. The result has been a slowdown in employment growth in the retail sector, officially known as Retail Trade.
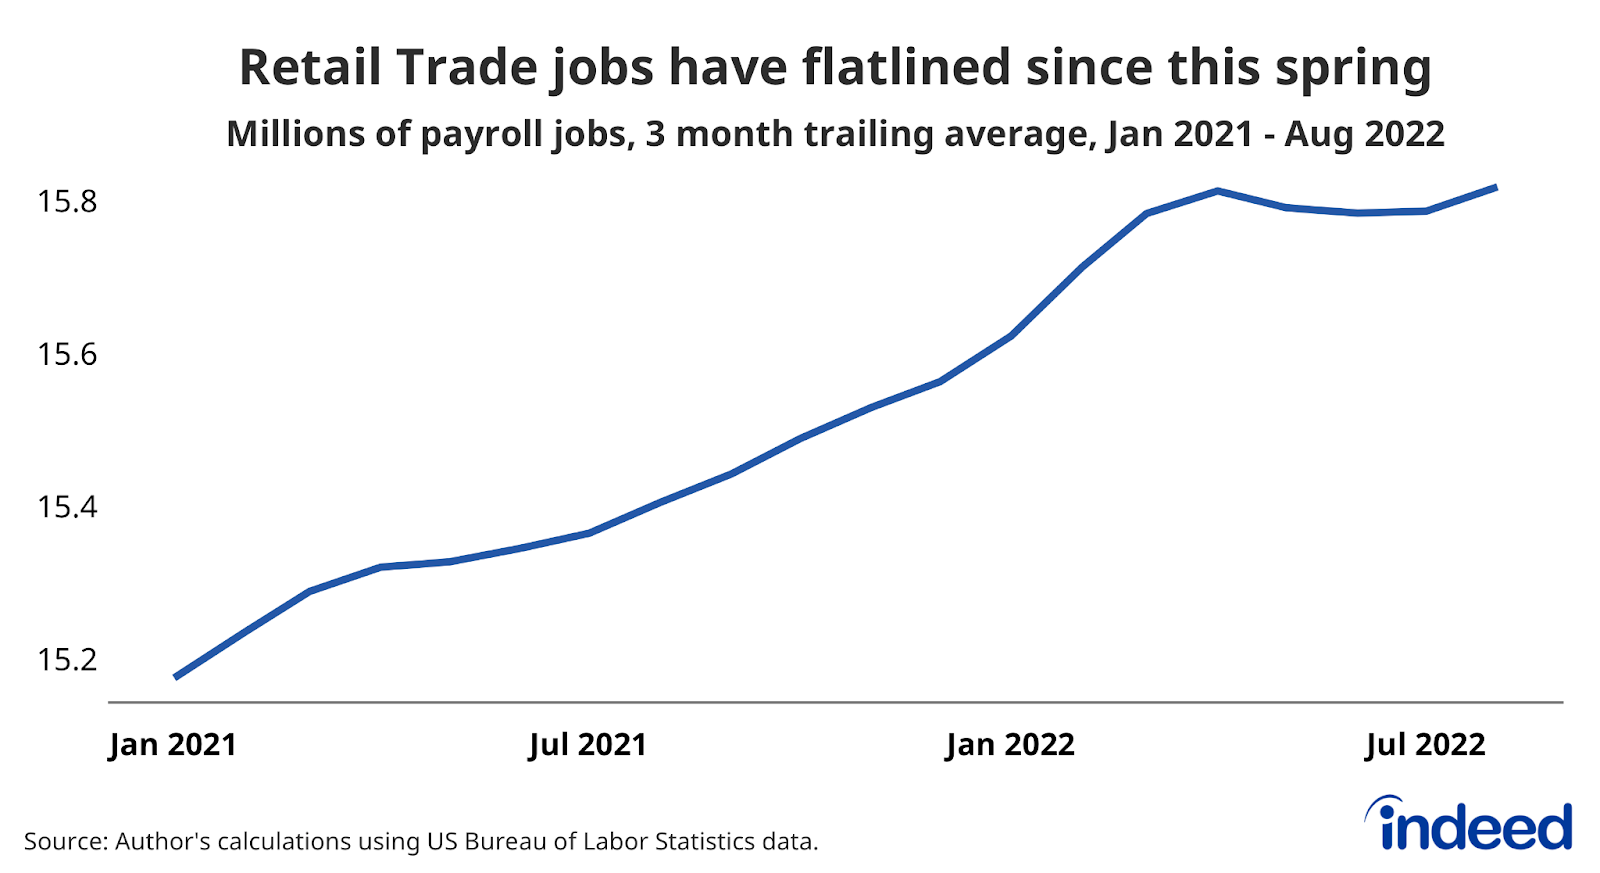
Yet, layoffs haven’t spiked in these industries. In fact, the layoff and discharges rate for Retail Trade was slightly lower in July 2022 (0.9%) than it was a year prior in July 2021 (1%). The slowdown in employment has come primarily from a slowdown in hiring. The hires rate in the sector declined from an average of 6% in the first quarter to 5% in July. And importantly, the quits rate has cooled quite a bit in Retail Trade as well, dropping from 4.5% to 3.7% over the same time period.
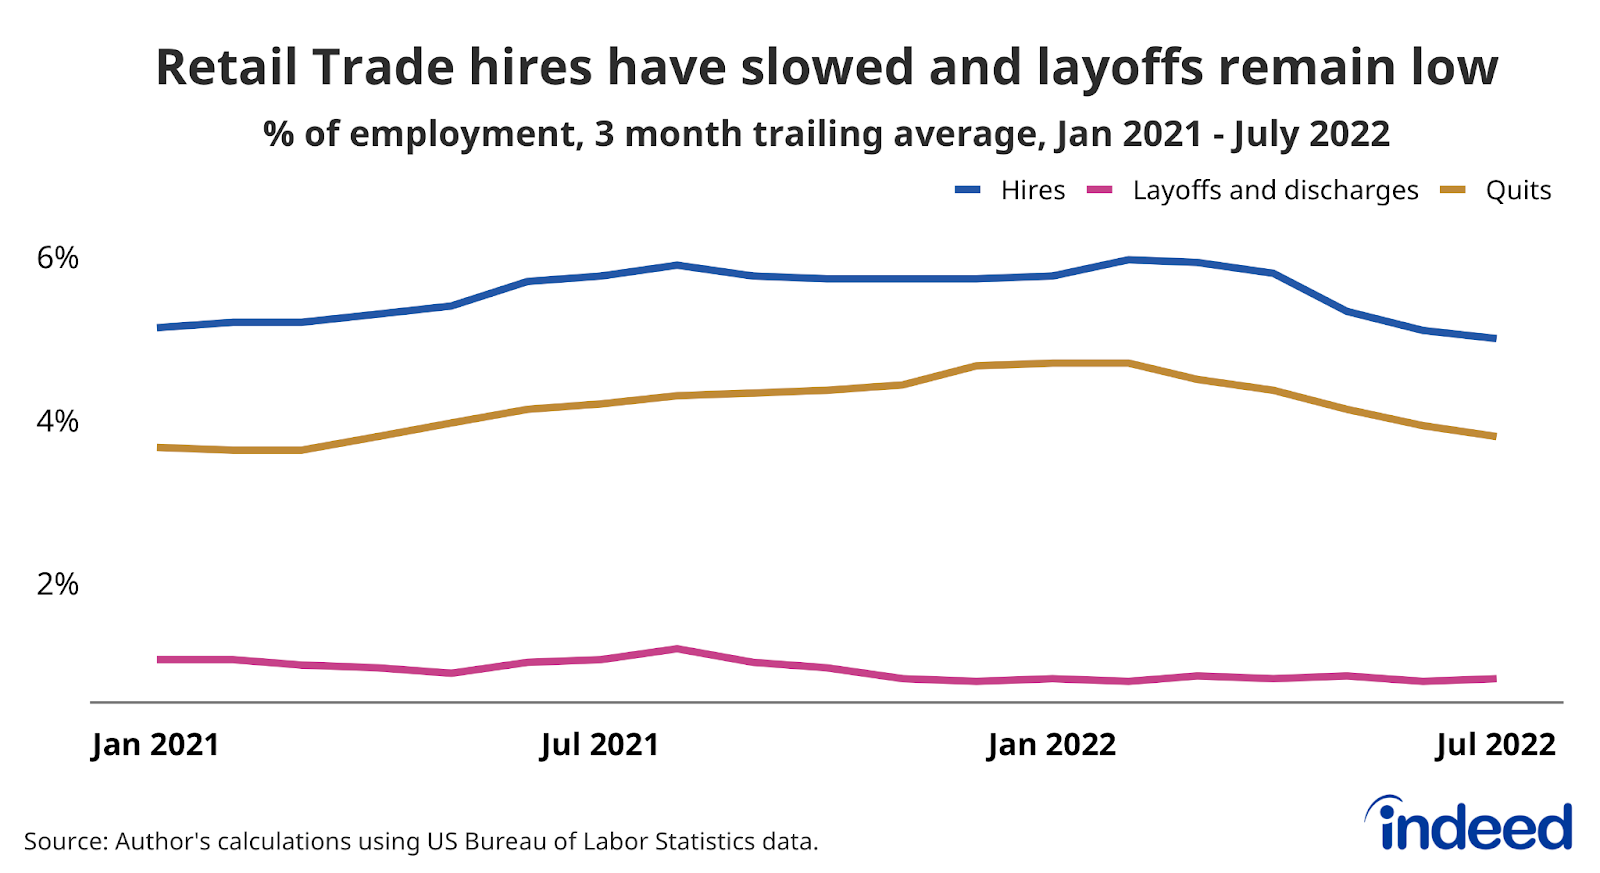
The combination of lower hires and fewer quits points toward a pullback in demand for workers in Retail Trade. This is showing up primarily as less job switching and fewer employers poaching already employed workers. The hiring of those out of work could remain robust while overall hires dip. In fact, the unemployment rate for retail workers is down over the past year and shows little sign of picking up recently. But the short-term outlook for retail jobs will be strongly influenced by the swiftly approaching holiday season.
A cooldown in hiring like the one happening in retail for the overall labor market would certainly fit the criteria of a “soft” landing. Whether or not such a landing will eventually happen, it’s worth documenting what such an outcome would look like.
Labor Market Overview
The US labor market remains hot. As the US economy has bounced back from the initial COVID-19 shock, demand for labor has grown much more quickly than supply. Employment has rebounded, wages are growing quickly, and joblessness is approaching pre-pandemic levels. The labor market is, however, showing some signs of normalizing, particularly as demand for workers cools. The Federal Reserve’s aggressive tightening of monetary policy risks turning this normalization into a sustained downturn.
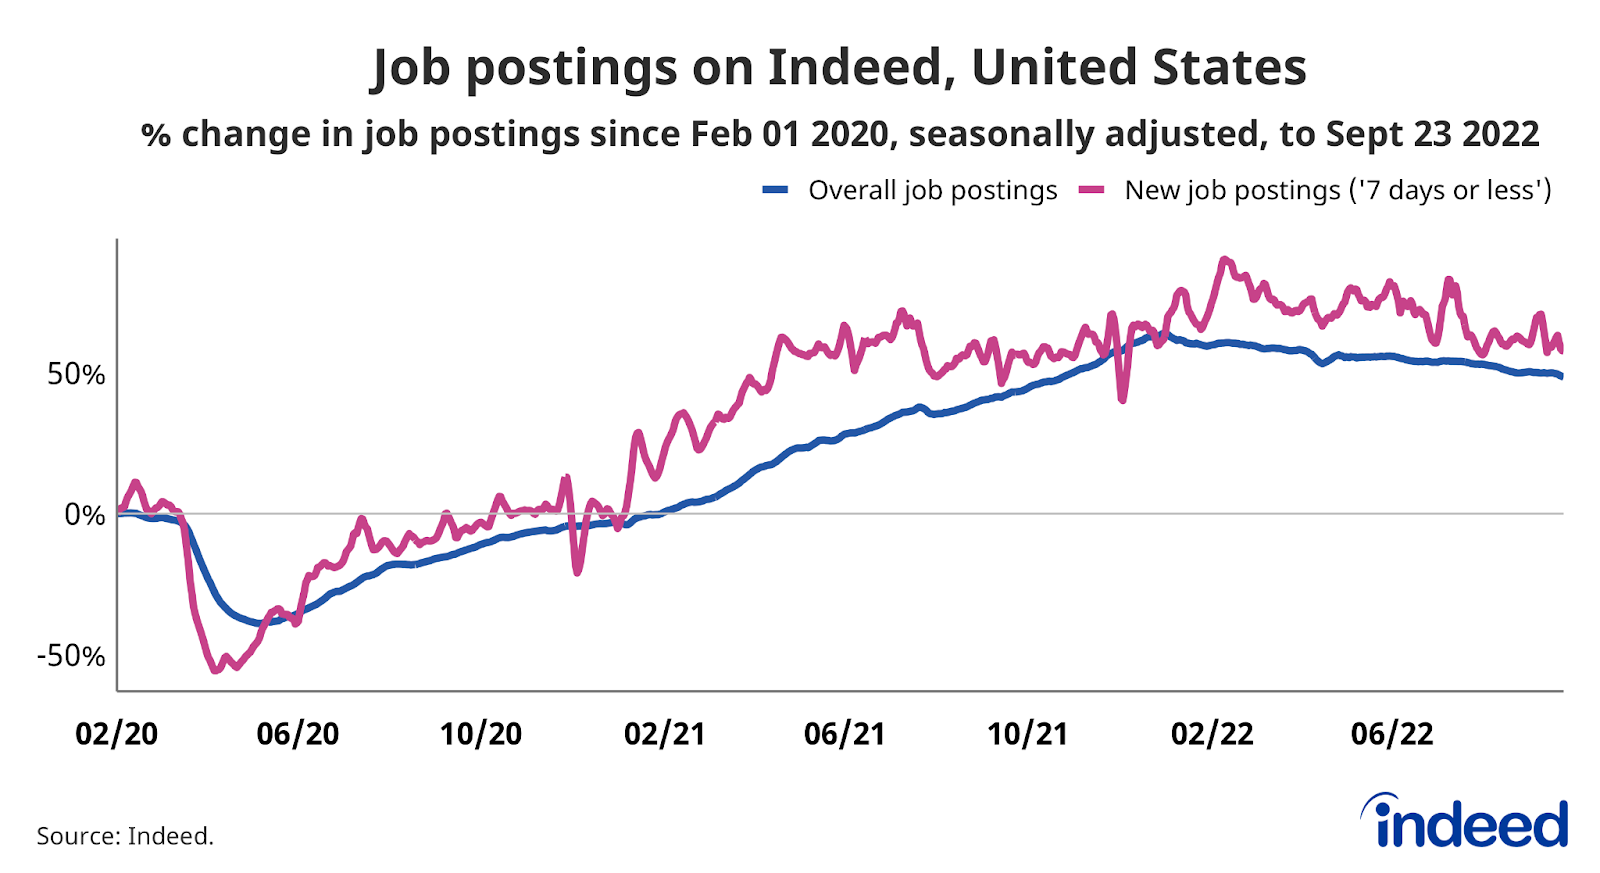
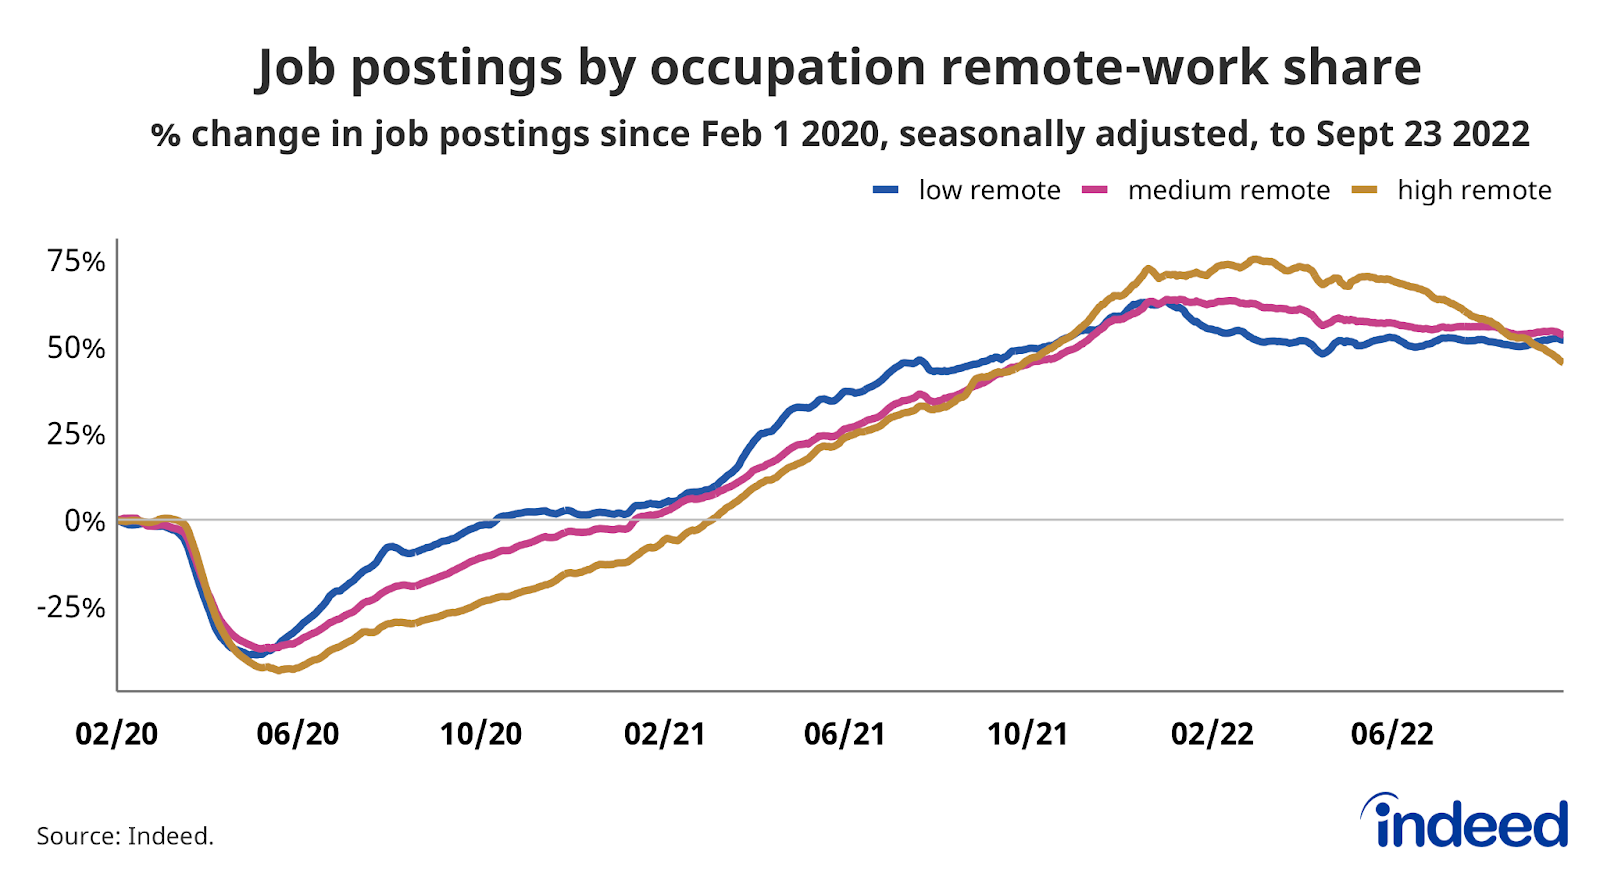
Employer demand for workers remains strong, with Indeed job postings as of September 23, 2022, 48.5% above their pre-pandemic baseline. New job postings, defined as those on Indeed for seven days or less, are also well above their pre-pandemic baseline, up 57.8%. While job posting growth has slowed, the leveling out has been relatively moderate. The recent decline in postings has been led by job sectors in which remote work is more frequently advertised, such as Software Development and Marketing.
Strong wage growth, but inflation is eating away gains
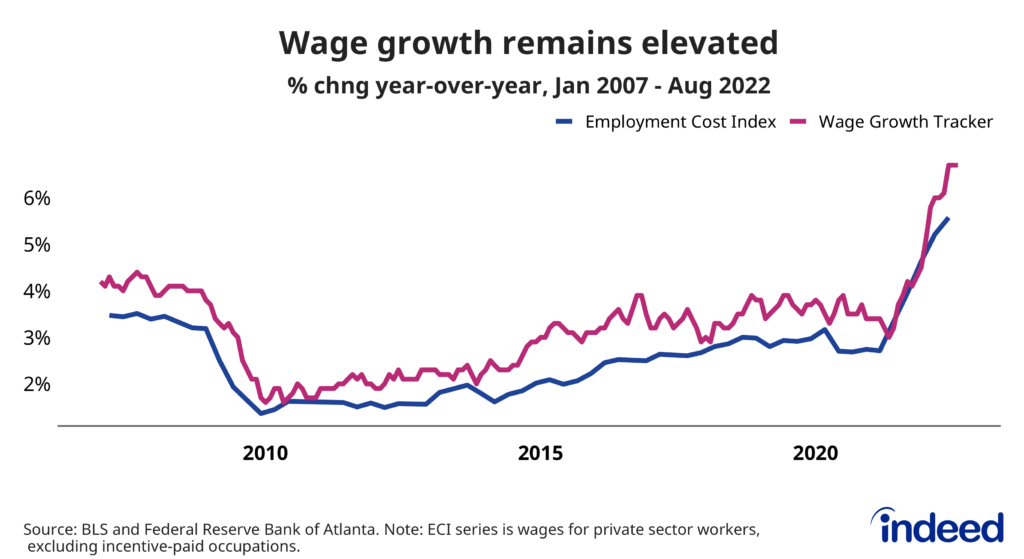
Strong demand for workers across multiple sectors has driven wages up roughly 6% on an annual basis, a higher growth rate than at any point in over the past 20 years. This is what economists call nominal wage growth — that is, pay gains before taking inflation into account. However, rising prices are eating away those gains and causing many employees to lose ground when it comes to actual purchasing power.
One of the biggest questions for the US economy is the future path of nominal wage growth. Many economists had expected that wage growth was on the precipice of declining earlier this year. Yet the most recent data from high-quality measures of wage growth show continued high levels of competition for hires. Wages appear to have more momentum than previously thought. Even if wages start to cool down soon, they have a ways to go before they return to their slower pace circa 2019.
People are returning to work
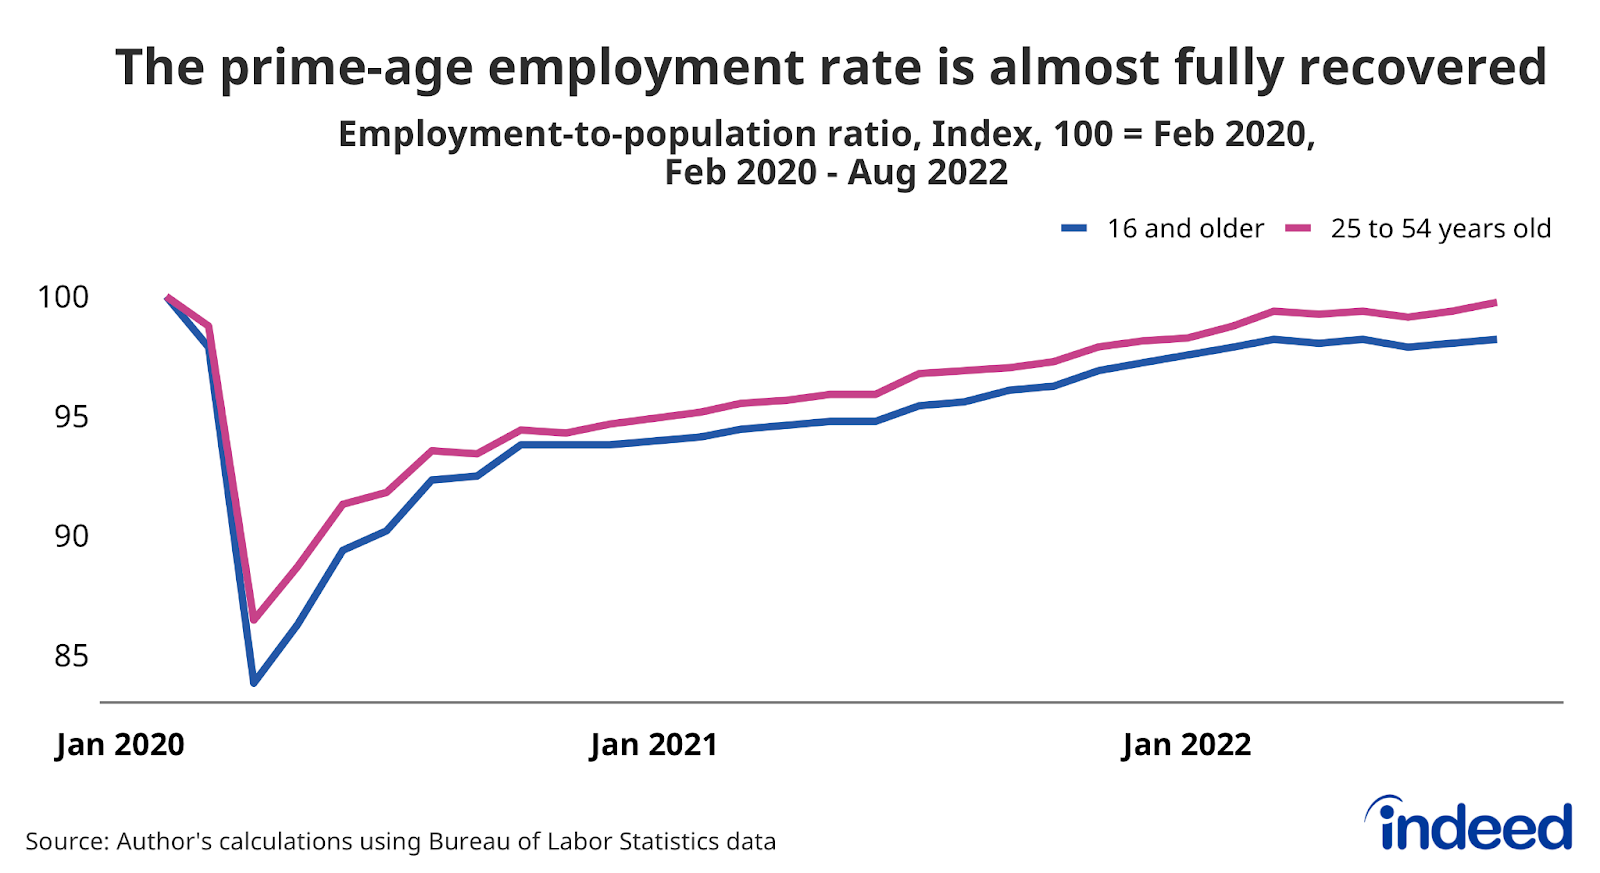
Labor supply has not grown as swiftly as demand, but people are returning to work. After slowing down for a few months, the labor force participation rate and the employment-to-population ratio rose briskly in August. If this turn heralds a return to consistent increases for these metrics, several key indicators will return to pre-pandemic levels. Consider the employment-to-population ratio for workers ages 25 to 54, a good measure of the health of the labor market. As of August, this ratio stands only 0.2 percentage points below its February 2020 level, a level consistent with a healthy labor market. This is in addition to total payroll jobs which have already returned to pre-pandemic levels.
The employment rate for all workers is further from its pre-pandemic rate, due in large part to a lagging recovery for older workers. Many people continue to ‘unretire,’ but the recent stagnation in this trend and rise in workers entering retirement suggests we shouldn’t expect older Americans to be a significant source of employment moving forward.
Quitting is still elevated, but fading as layoffs remain low
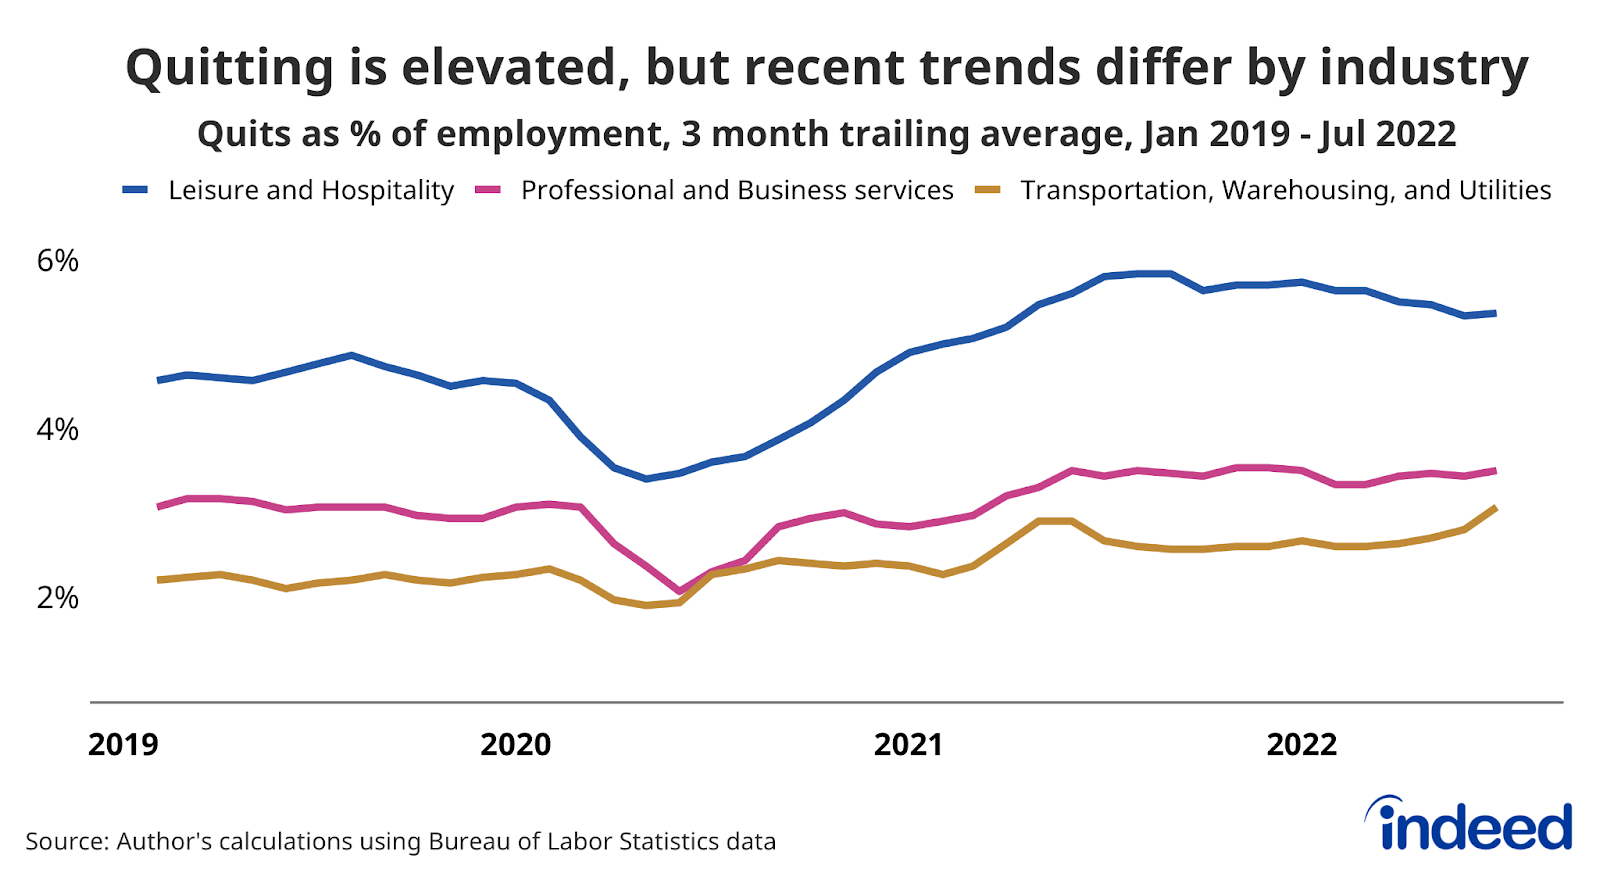
Employed workers are also finding new work, as the rate of job quitting is still almost 20% above the pre-pandemic norm. While quitting is still elevated, it has cooled down slightly in recent months. Notably, quitting has fallen in sectors that saw large rises in 2021, namely Leisure and Hospitality and Retail Trade. Quits rates have held steady at elevated rates in sectors such as Professional and Business Services and may be rising in Transportation, Warehousing, and Utilities.
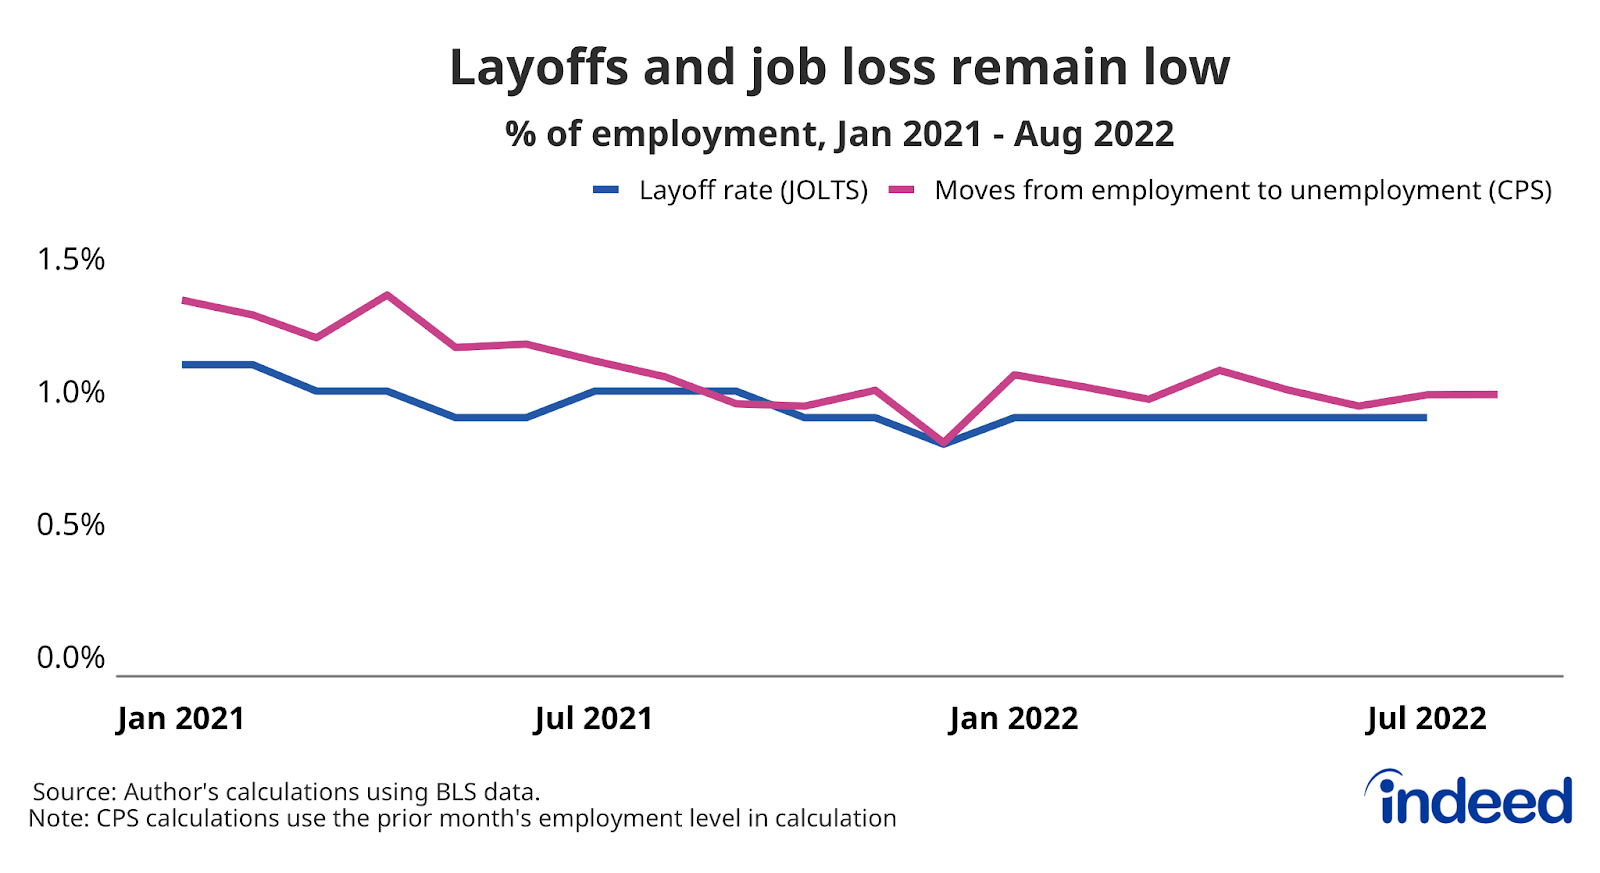
Workers are leaving their old jobs voluntarily at high rates, but employers seem loath to let go of the employees they do have. Despite headlines about increased layoffs and a headfake from weekly unemployment insurance claims data, key measures of layoffs continue to show suppressed levels of involuntary job loss.
The US labor market has been offering plenty of opportunities for workers while presenting some challenges to employers. However, the present situation undoubtedly will change. We will continue to monitor these trends and track others as the labor market evolves.
Methodology
Data on seasonally adjusted Indeed job postings are the percentage change in seasonally adjusted job postings since February 1, 2020, using a seven-day trailing average. February 1, 2020, is our pre-pandemic baseline. We seasonally adjust each series based on historical patterns in 2017, 2018, and 2019. We adopted this methodology in January 2021. Data for several dates in 2021 and 2022 are missing and were interpolated. Non-seasonally adjusted data are calculated in a similar manner except that the data are not adjusted to historical patterns.
The number of job postings on Indeed.com, whether related to paid or unpaid job solicitations, is not indicative of potential revenue or earnings of Indeed, which comprises a significant percentage of the HR Technology segment of its parent company, Recruit Holdings Co., Ltd. Job posting numbers are provided for information purposes only and should not be viewed as an indicator of performance of Indeed or Recruit. Please refer to the Recruit Holdings investor relations website and regulatory filings in Japan for more detailed information on revenue generation by Recruit’s HR Technology segment.