Key Points:
- The US labor market was resilient in 2022, but will likely cool somewhat in 2023. What remains unclear is how much the temperature of the labor market will drop.
- A combination of weaker demand and joblessness getting closer to its sustainable minimum means hiring will likely slow this year.
- Workers are set to retain some of their post-pandemic gains, but the long-term sustainability of these wins depends on the short-term health of the labor market.
- Wage gains were leveling out as 2022 wrapped up, but it is unclear how much total compensation growth will decelerate.
The US labor market entered 2022 with considerable momentum. Despite a slowdown in economic growth and a moderation in demand for workers, jobs continued to grow briskly and wages increased at a quick pace. This year’s outlook is less rosy, with many projections showing the US economy is poised for a recession. Whether or not recession predictions prove true, the labor market is set to experience a cool down. It’s the extent of that moderation that is the largest unknown.
While there are many issues surrounding the health of the labor market in 2023, we will focus on three key topics: hiring speed, the persistence of worker bargaining power, and the pace of wage gains. Understanding how these trends will play out will help us to understand how the year ahead will shape up.
How much will hiring slow down?
Employers hired workers at a rapid pace in 2022, continuing the rapid expansion of employment that began in the spring of 2021. This pace of hiring was unsurprising given employers’ strong appetites for more employees and a relatively abundant pool of jobless workers. A slowdown in hiring can come from a combination of weaker demand and a more constrained supply of readily-hireable workers. Whether demand or supply is the dominant constraint will set the stage for much of 2023.
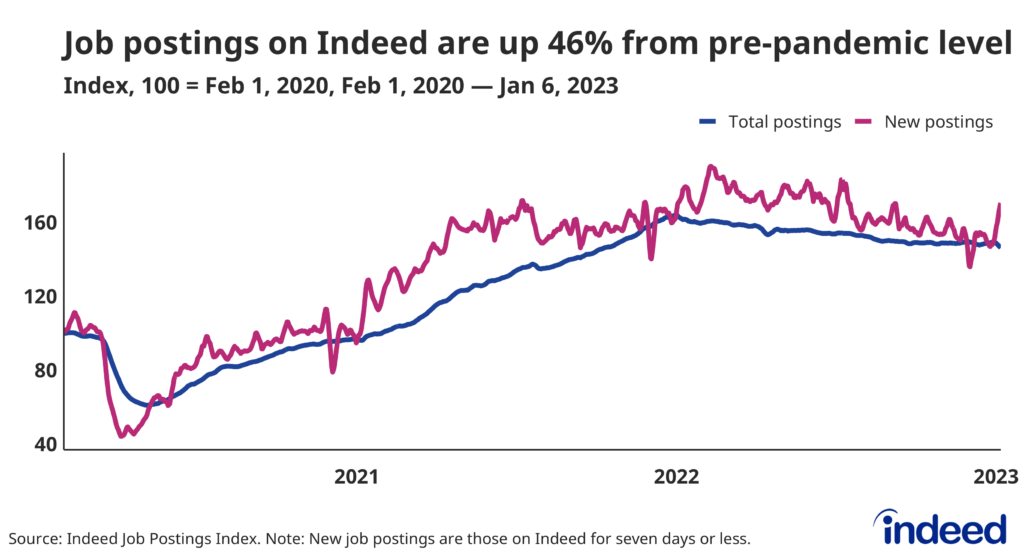
Demand for new hires was strong as 2022 wrapped up —the most recent government data shows there were 10.5 million job openings at the end of November. But while hiring remained strong, demand tempered last year, as both job openings and job postings on Indeed showed considerable decline, down 9.9% year-over-year as of January 6, 2023.
That contraction was particularly notable in occupational categories linked to the retreating tech sector, such as Software Development. On the other hand, postings remained strong in categories related to in-person categories, such as Food Preparation and Services. If this trend continues into 2023, then demand will remain robust as in-person services employ far more workers than higher-wage industries, like the technology sector, for example.
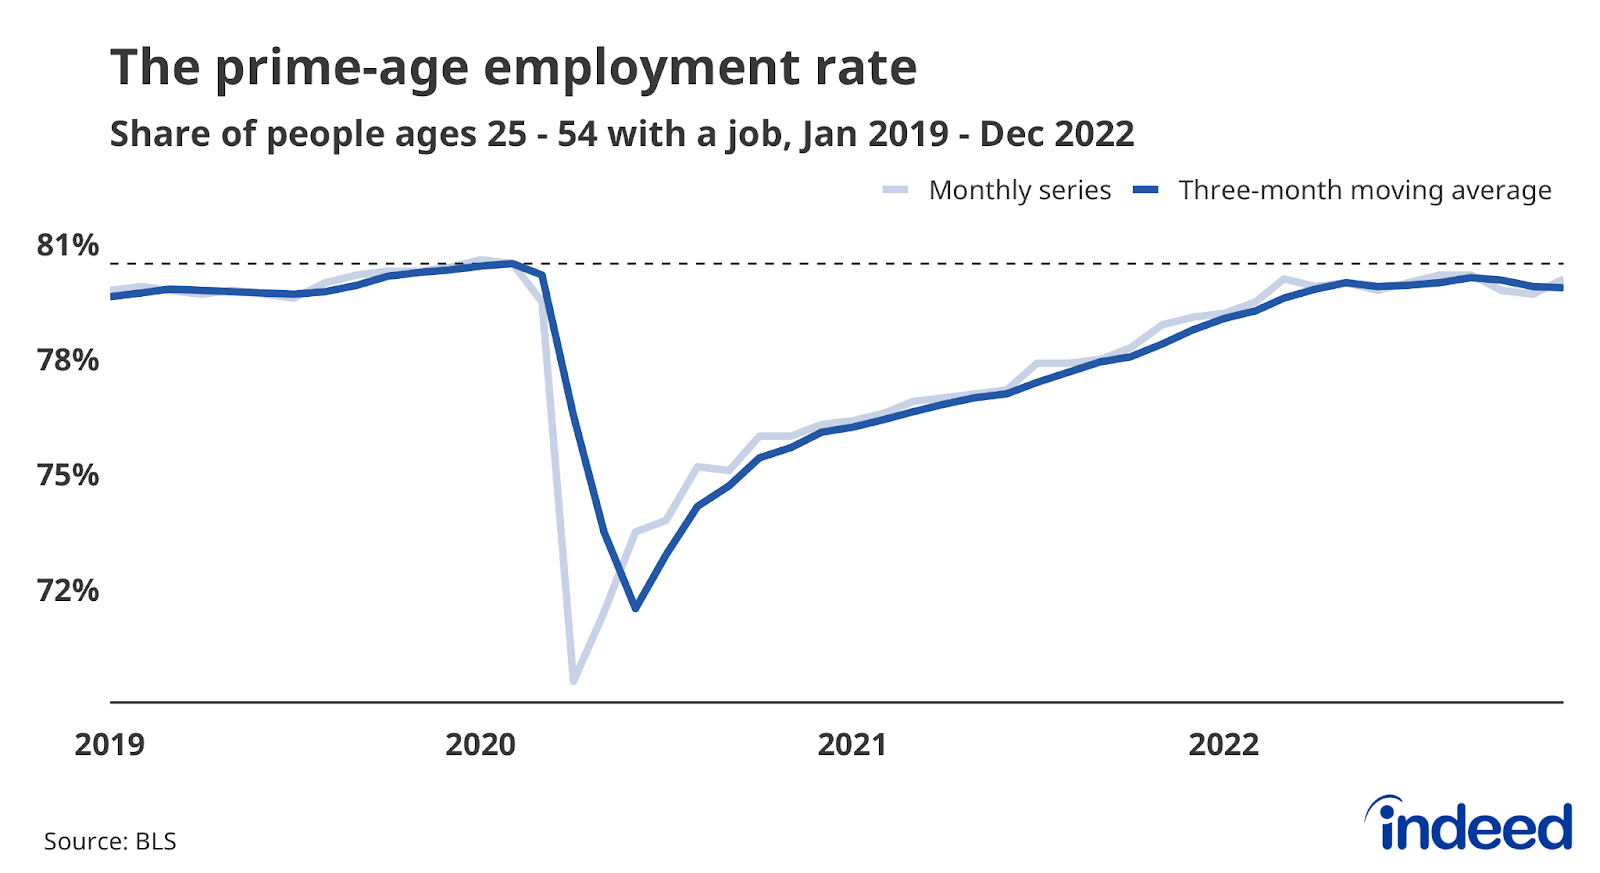
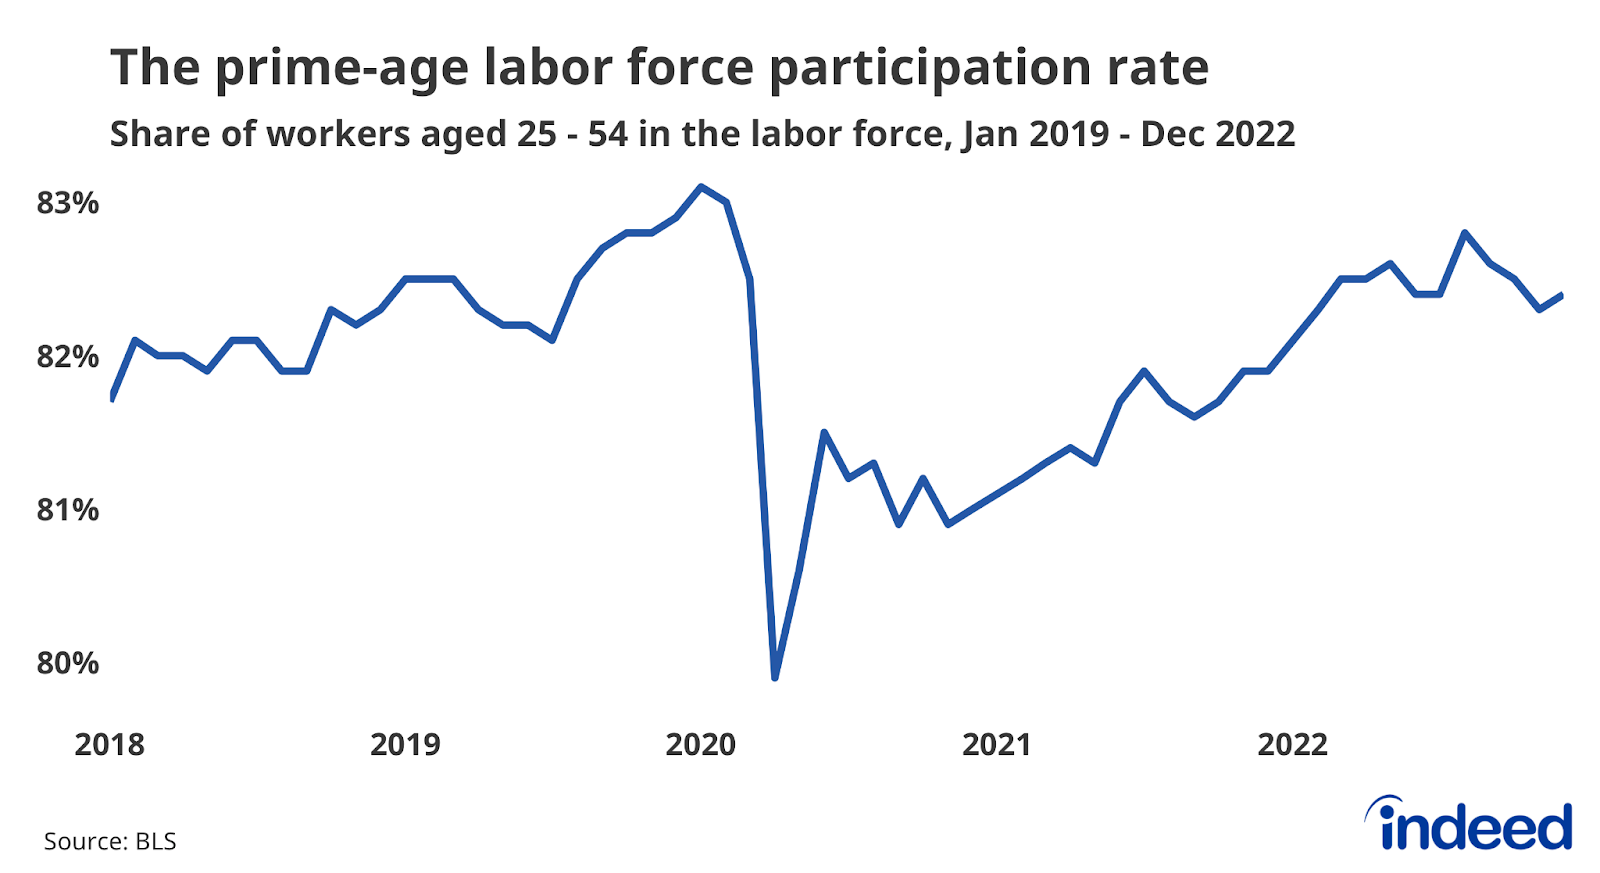
The current state of labor supply is relatively unclear, but the data shows strong demand was attracting more people into jobs for much of 2022. The labor force participation rate didn’t rise much over the year, moving just a tenth of a percentage point from 62.2% in January 2022 to 62.3% in December. A similar trend was true for workers ages 25 to 54, though this hides an important pattern—the prime-age labor force participation rate rose for most of 2022, then backslid from September to November. This series can be volatile, with months of decline followed by rebounds, something we saw in 2021. It’s very possible that 2023 will see more workers join the labor force if strong demand endures as the prime-age labor force participation rate is still 0.4 percentage points below its late 2019 average.
How much leverage will workers retain?
For large chunks of 2021 and 2022, workers had more leverage in the US labor market than they’ve had in decades. The elevated number of job opportunities and level of urgency from employers gave job seekers the ability to find new jobs, seek out higher compensation, and retain many workplace benefits. However, as the labor market begins to slow down, it is possible some of the advantages and progress made for employees in recent years may fade. While some gains may be more enduring, others may be more susceptible to fluctuations in economic conditions.
Remote work is set to endure. Though this mode of work isn’t available to everyone, its mass adoption has been, and will continue to be, transformative for many people. However, a weaker labor market could prompt some employers to shift work back into the office. If the trend reverses and many companies choose to end their experiment with remote work, less leverage for workers could mean employers take advantage of that opportunity.
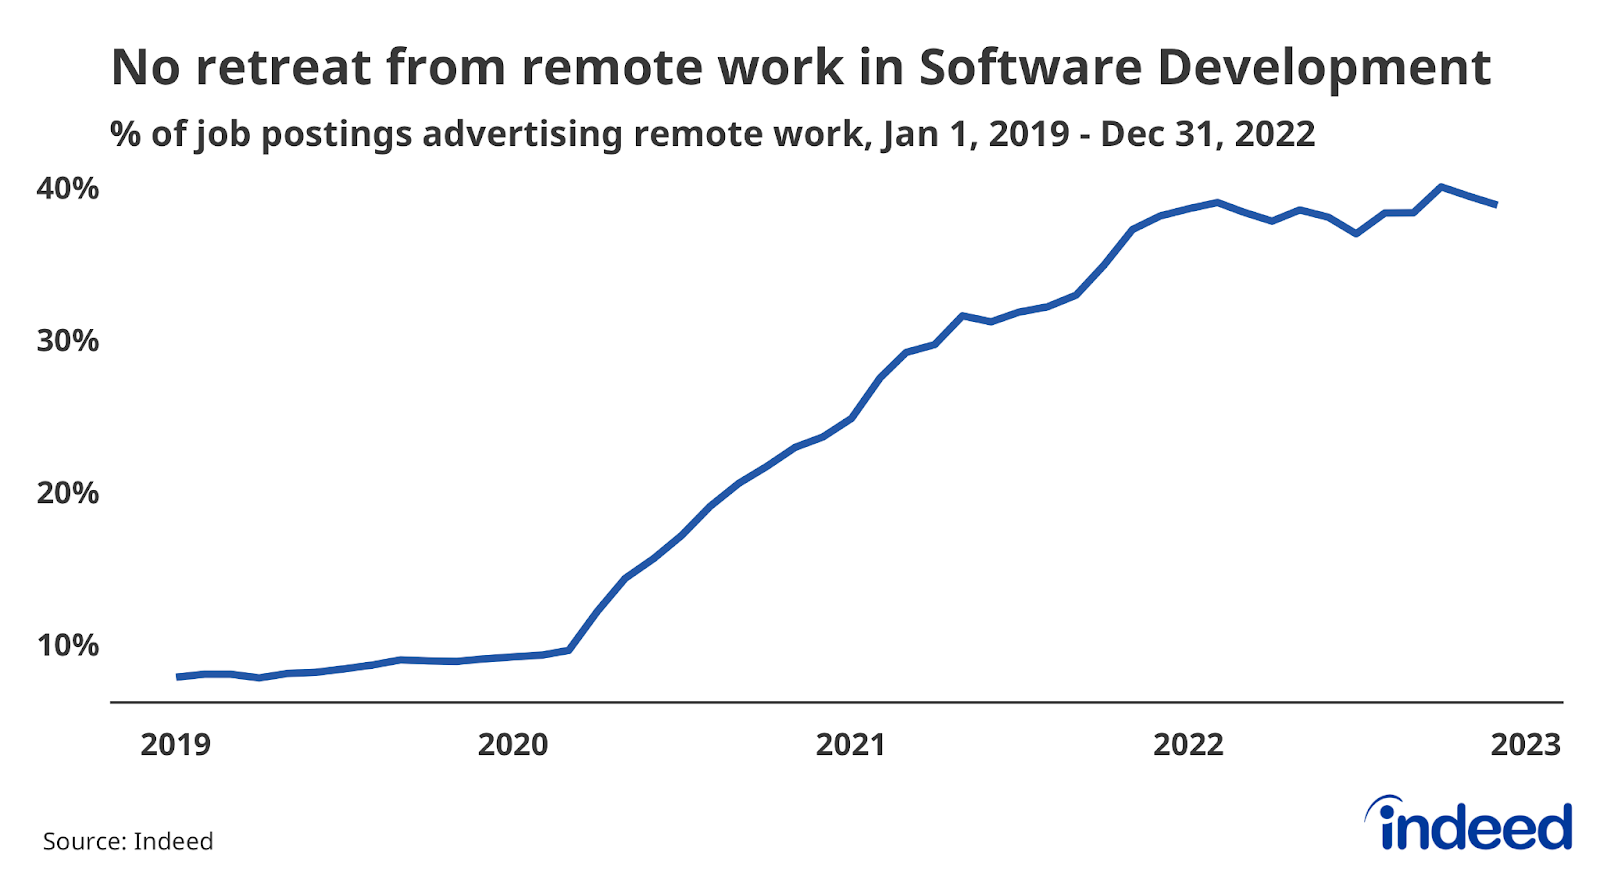
Interestingly, that doesn’t appear to have happened yet in a sector that’s experiencing pain, but still has a high usage of remote work. The share of Software Development job postings that advertise remote work has been flat for most of 2022, despite a significant pullback in the tech sector. Employers who felt as though they could use a cooler labor market to withdraw from a remote work environment would have pulled back on these postings. However, many in the Software Development market didn’t pull back. Perhaps this sector is unique, but the trend is worth watching for the future of remote work.
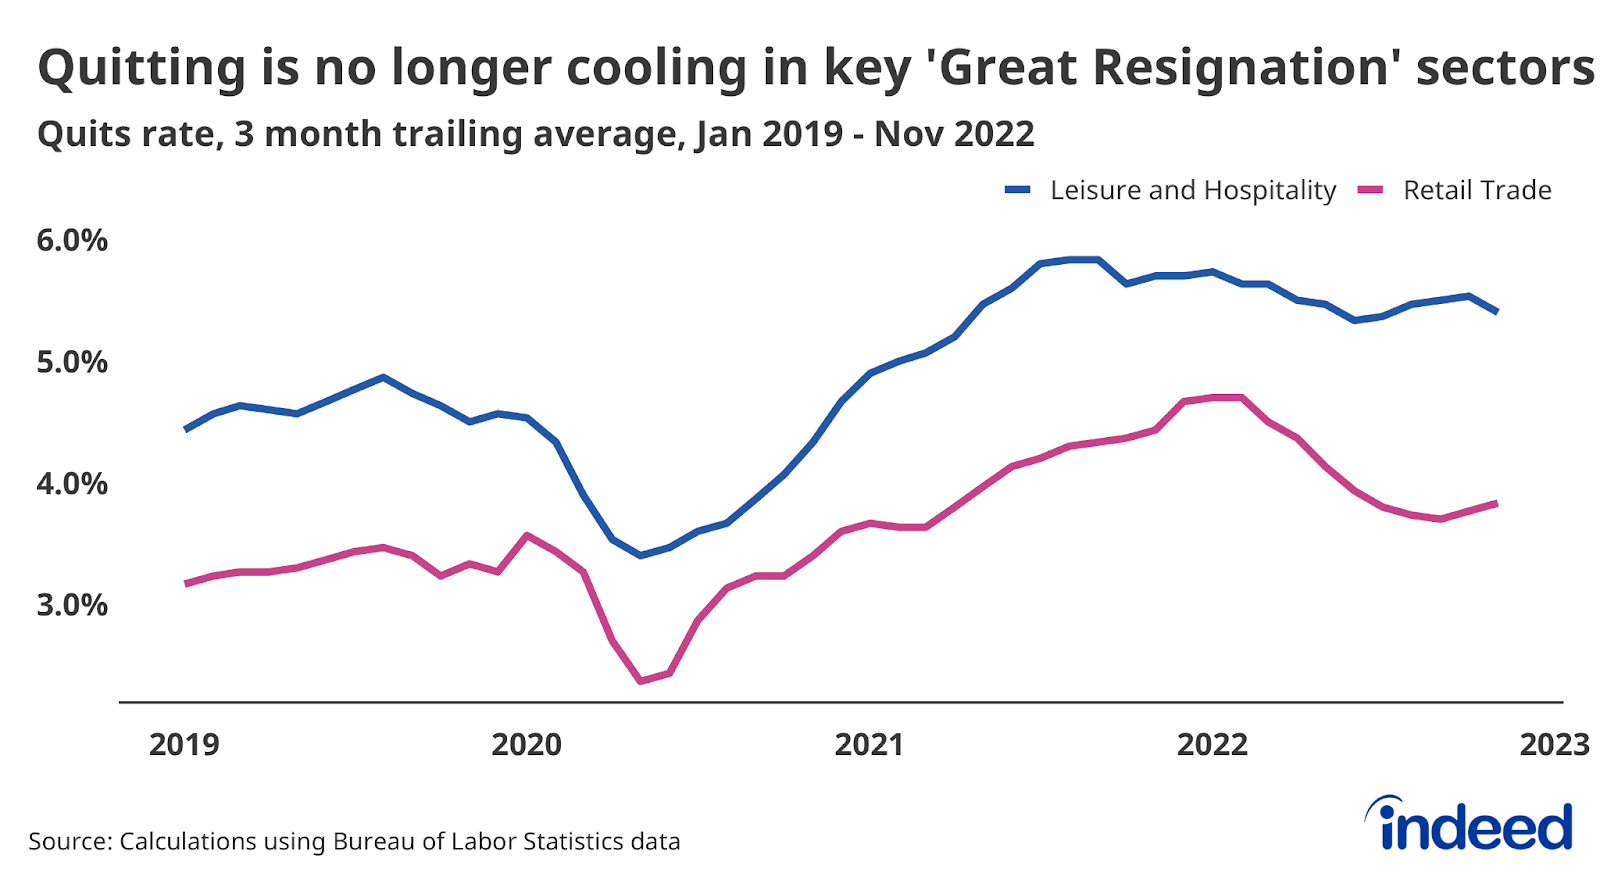
Workers who continued to show up in person also saw a variety of gains last year in large part because of increased competition for their services. The experience of the Leisure and Hospitality and Retail Trade sectors is instructive. Workers in these sectors were in high demand. Leveraging that advantage, these employees realized fast wage gains and increased access to other forms of compensation. It’s unclear how much of this leverage will endure in a slower labor market—workers in low-wage industries are often the hardest hit by downturns—but there is still good news for this group. Their ability to quit a job and move to a new one is still sending strong signals. We will keep an eye on this metric to see how powerful these workers will become in 2023.
How quickly will wages grow?
Rapid wage growth was one of the defining characteristics of the 2022 labor market. Strong competition for workers, particularly those in lower-paying jobs, resulted in a pace of pay gains that haven’t been seen in the US for quite some time. Of course, high inflation meant these strong gains were disappointing for many workers. Still, many saw their paychecks grow more quickly than prices.
With signs that inflation may be steadily ticking down in the US, the big question remains whether wage growth does the same. If wage growth is resilient as inflation moderates, then more households will see increases in their purchasing power, which could power consumer spending and overall economic growth. Such an outcome would likely be seen by the Federal Reserve as a threat to their campaign against high inflation, resulting in even more restrictive monetary policy in 2023.
For now, many signs point toward moderating, but still strong wage gains. Key wage growth indicators such as the Employment Cost Index and the Atlanta Fed’s Wage Growth Tracker show gains well above their pre-pandemic pace. For example, private sector wages and salaries grew 3% year-over-year in the third quarter of 2019 according to the ECI. The metric showed 5.3% growth in the third quarter of 2022.
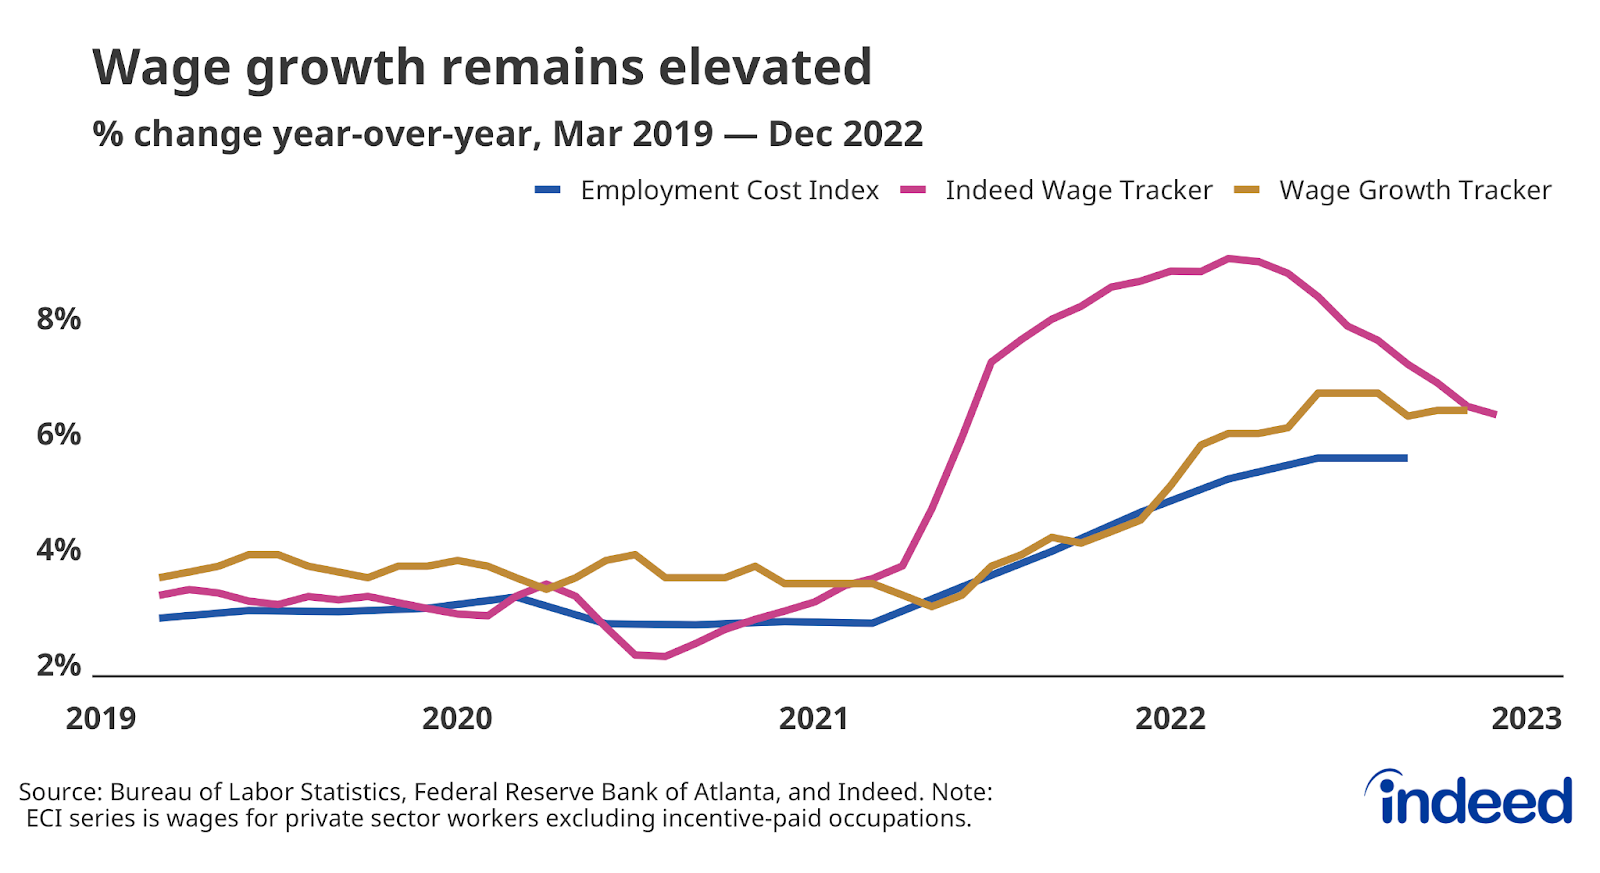
A new metric of wage growth, the Indeed Wage Tracker, also shows a cooling period which could signal further moderation. Our wage tracker examines the growth of wages and salaries advertised in job postings, an indicator of how much employers need to pay to make an immediate hire. If the pay of new hires is already slowing, then the pay of all workers is likely to follow.
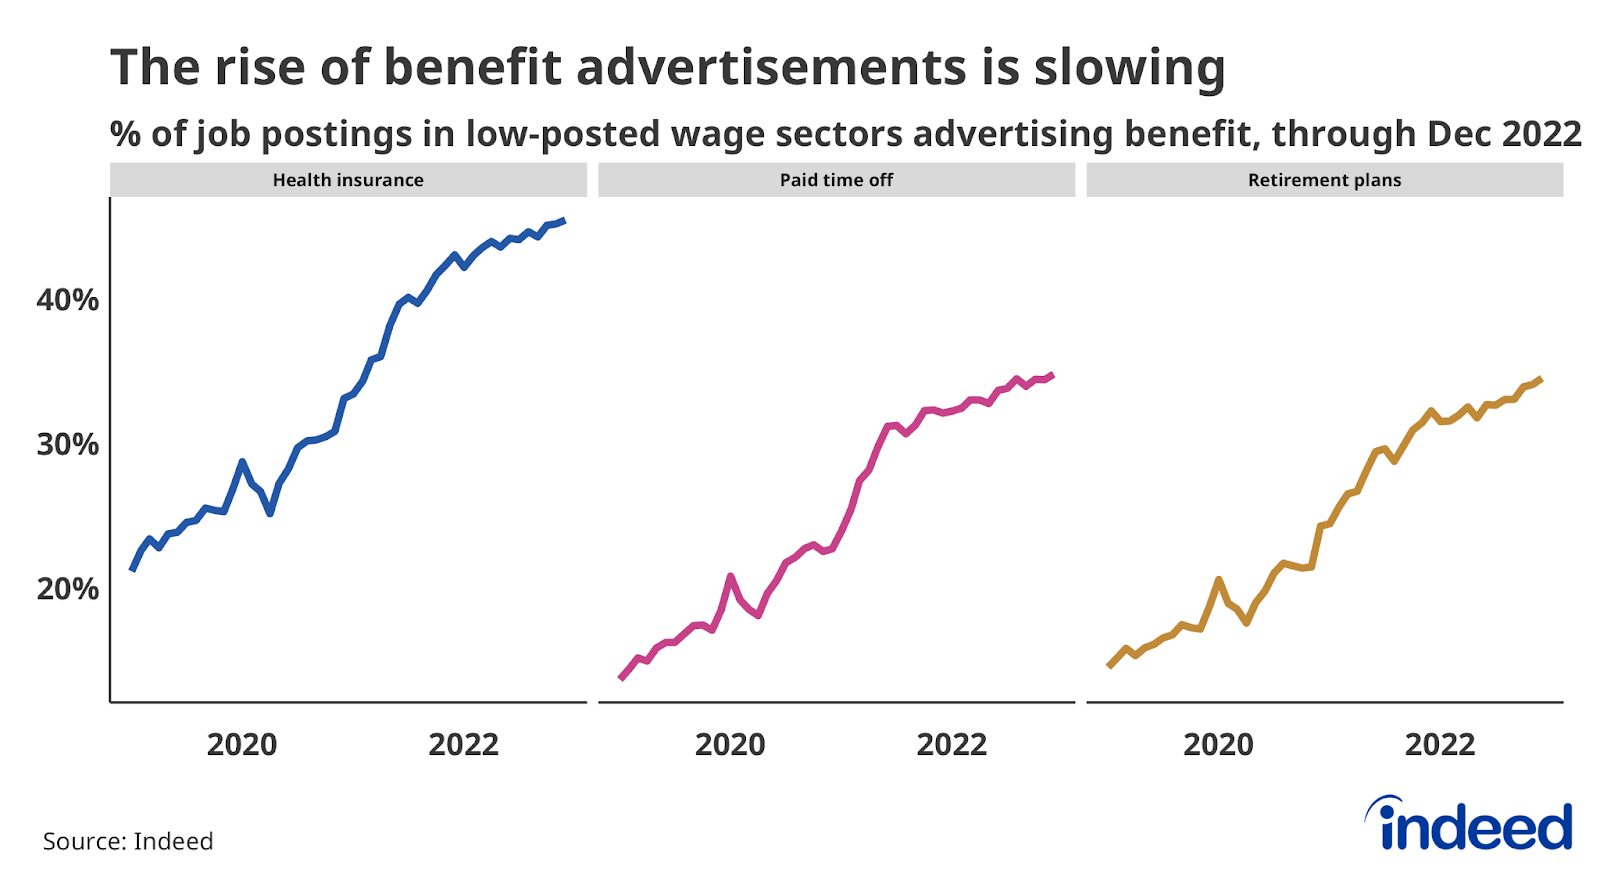
Cash may be king, but it’s not the totality of the compensation. Elevated competition for hires also led to employers advertising benefits at a higher rate than in the past, according to Indeed data. This rise was particularly pronounced for lower-wage sectors, although the increases slowed near the last half of 2022. Employers might retreat from this trend if the labor market significantly cools, so this data is worth tracking in combination with wage growth trends.
Conclusion: In like a lion, out like a lamb?
The US labor market entered this year with considerable strength. Demand for workers is strong but moderating, suggesting employers are looking to add more headcount despite recession fears. If economic growth can muddle through, avoid significant new headwinds, and maintain momentum in the face of restrictive monetary policy, then workers will retain many of the gains of recent years. That, of course, is more easily said than done. This year will pose challenges for the US economy, but hopefully the strength of the US labor market can continue to provide a solid foundation.
Methodology
Data on seasonally adjusted Indeed job postings are an index of seasonally adjusted job postings with 100 equal to the number on February 1, 2020, using a seven-day trailing average. February 1, 2020, is our pre-pandemic baseline. We seasonally adjust each series based on historical patterns in 2017, 2018, and 2019. We adopted this methodology in January 2021. Data for several dates in 2021 and 2022 are missing and were interpolated. Non-seasonally adjusted data are calculated in a similar manner except that the data are not adjusted to historical patterns.
The number of job postings on Indeed.com, whether related to paid or unpaid job solicitations, is not indicative of potential revenue or earnings of Indeed, which comprises a significant percentage of the HR Technology segment of its parent company, Recruit Holdings Co., Ltd. Job posting numbers are provided for information purposes only and should not be viewed as an indicator of performance of Indeed or Recruit. Please refer to the Recruit Holdings investor relations website and regulatory filings in Japan for more detailed information on revenue generation by Recruit’s HR Technology segment.
To calculate the average rate of wage growth for the Indeed Wage Tracker, we follow an approach similar to the Atlanta Fed US Wage Growth Tracker, but we track jobs, not individuals. We begin by calculating the median posted wage for a given country, month, job title, region and salary type (hourly, monthly or annual). Within each country, we then calculate year-on-year wage growth for each job title-region-salary type combination, generating a monthly distribution. Our monthly measure of wage growth for the country is the median of that distribution. Alternative methodologies, such as the regression-based approaches in Marinescu & Wolthoff (2020) and Haefke et al. (2013),produce similar trends.
More information about the data and methodology is available in a research paper by Pawel Adrjan and Reamonn Lydon, Wage growth in Europe: evidence from job ads, published in the Central Bank of Ireland’s Economic Letter series.
We identify job postings as open to remote work if the job title or description includes terms like “remote work,” “telecommute,” “work from home,” or similar language, or if the location is explicitly listed as remote. These postings include both permanent and temporarily remote jobs, though employers often don’t specify.
We calculate the remote share of postings on a daily basis. When reporting data on specific months we present the monthly mean of the daily series.