Key takeaways:
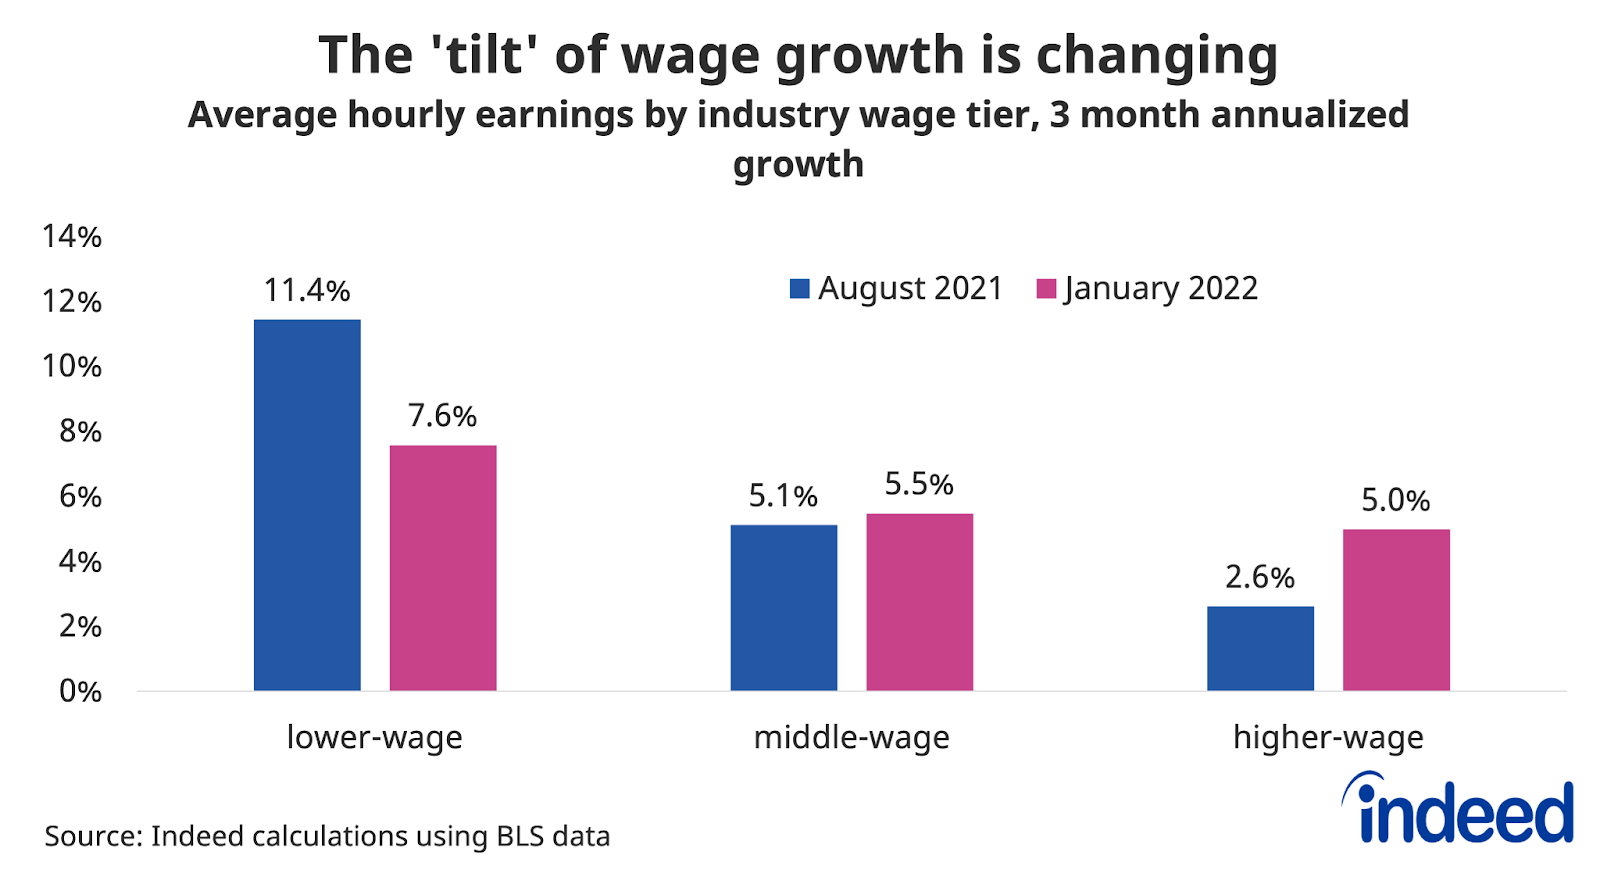
- Spotlight: Wage growth remains strong, but the origins of those gains are shifting. Wages have cooled slightly in lower-wage industries while picking up in higher-wage industries.
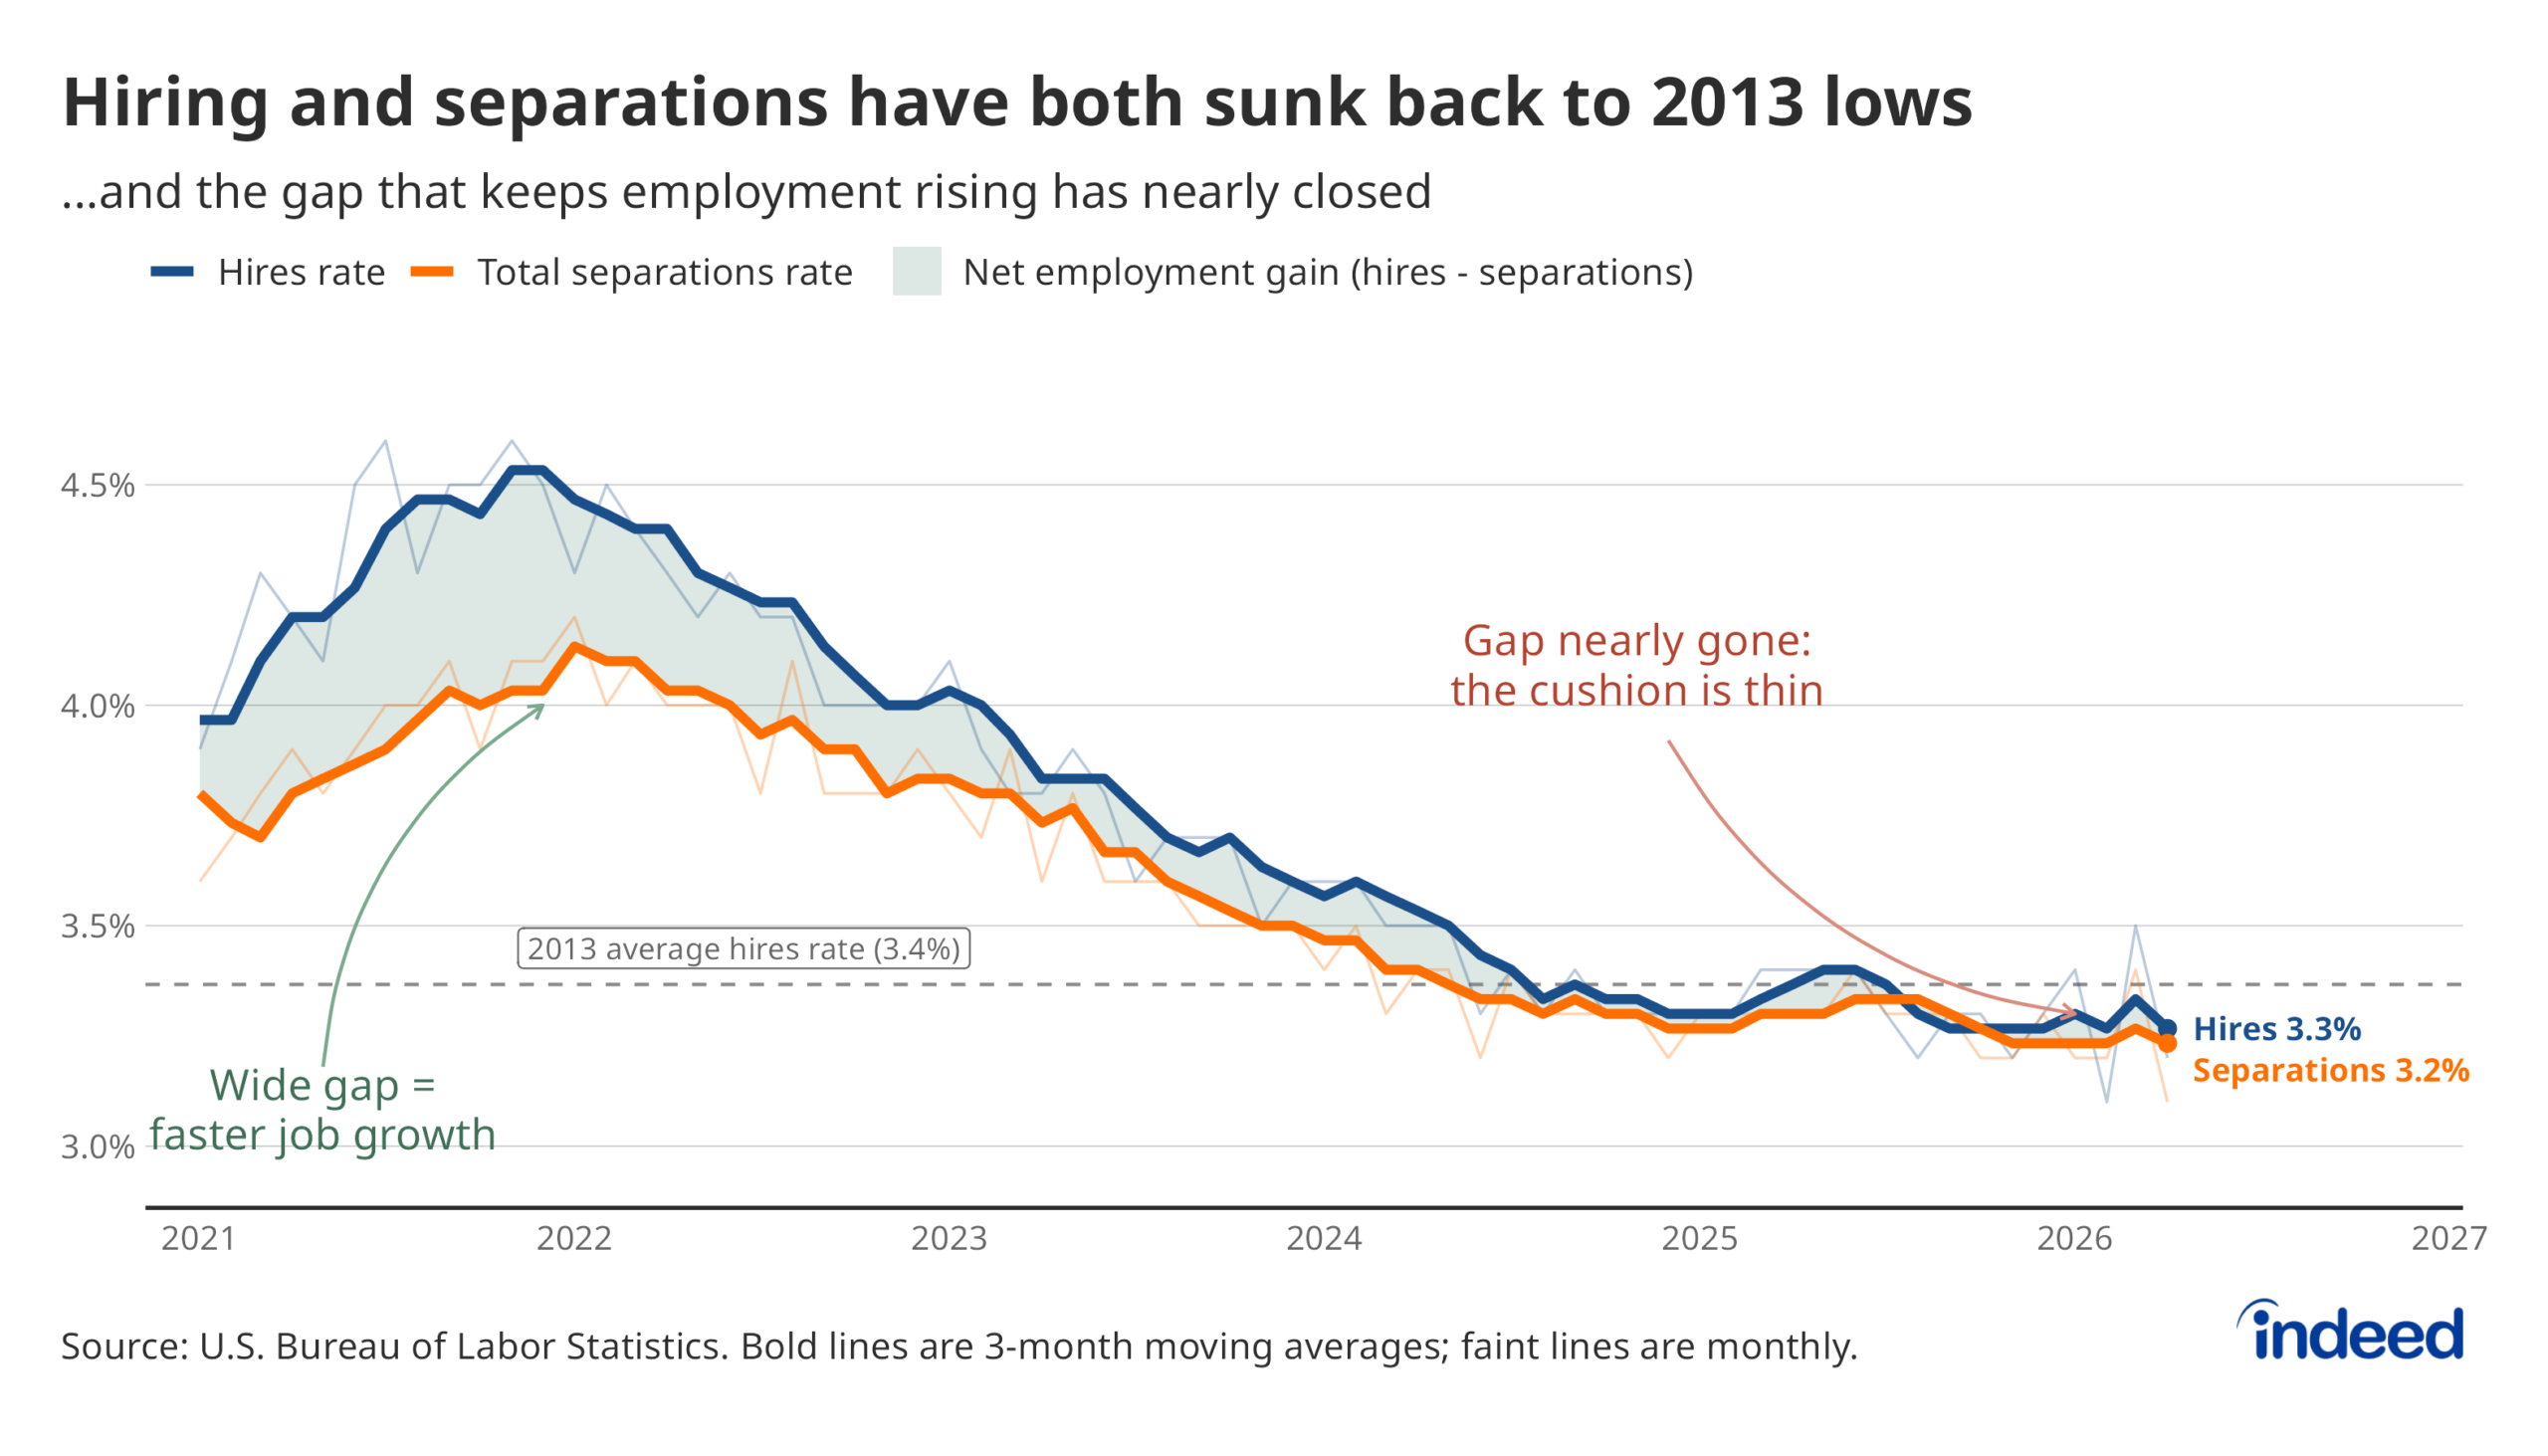
- The US labor market remains hot as demand for workers has outstripped the willingness of many workers to take those jobs.
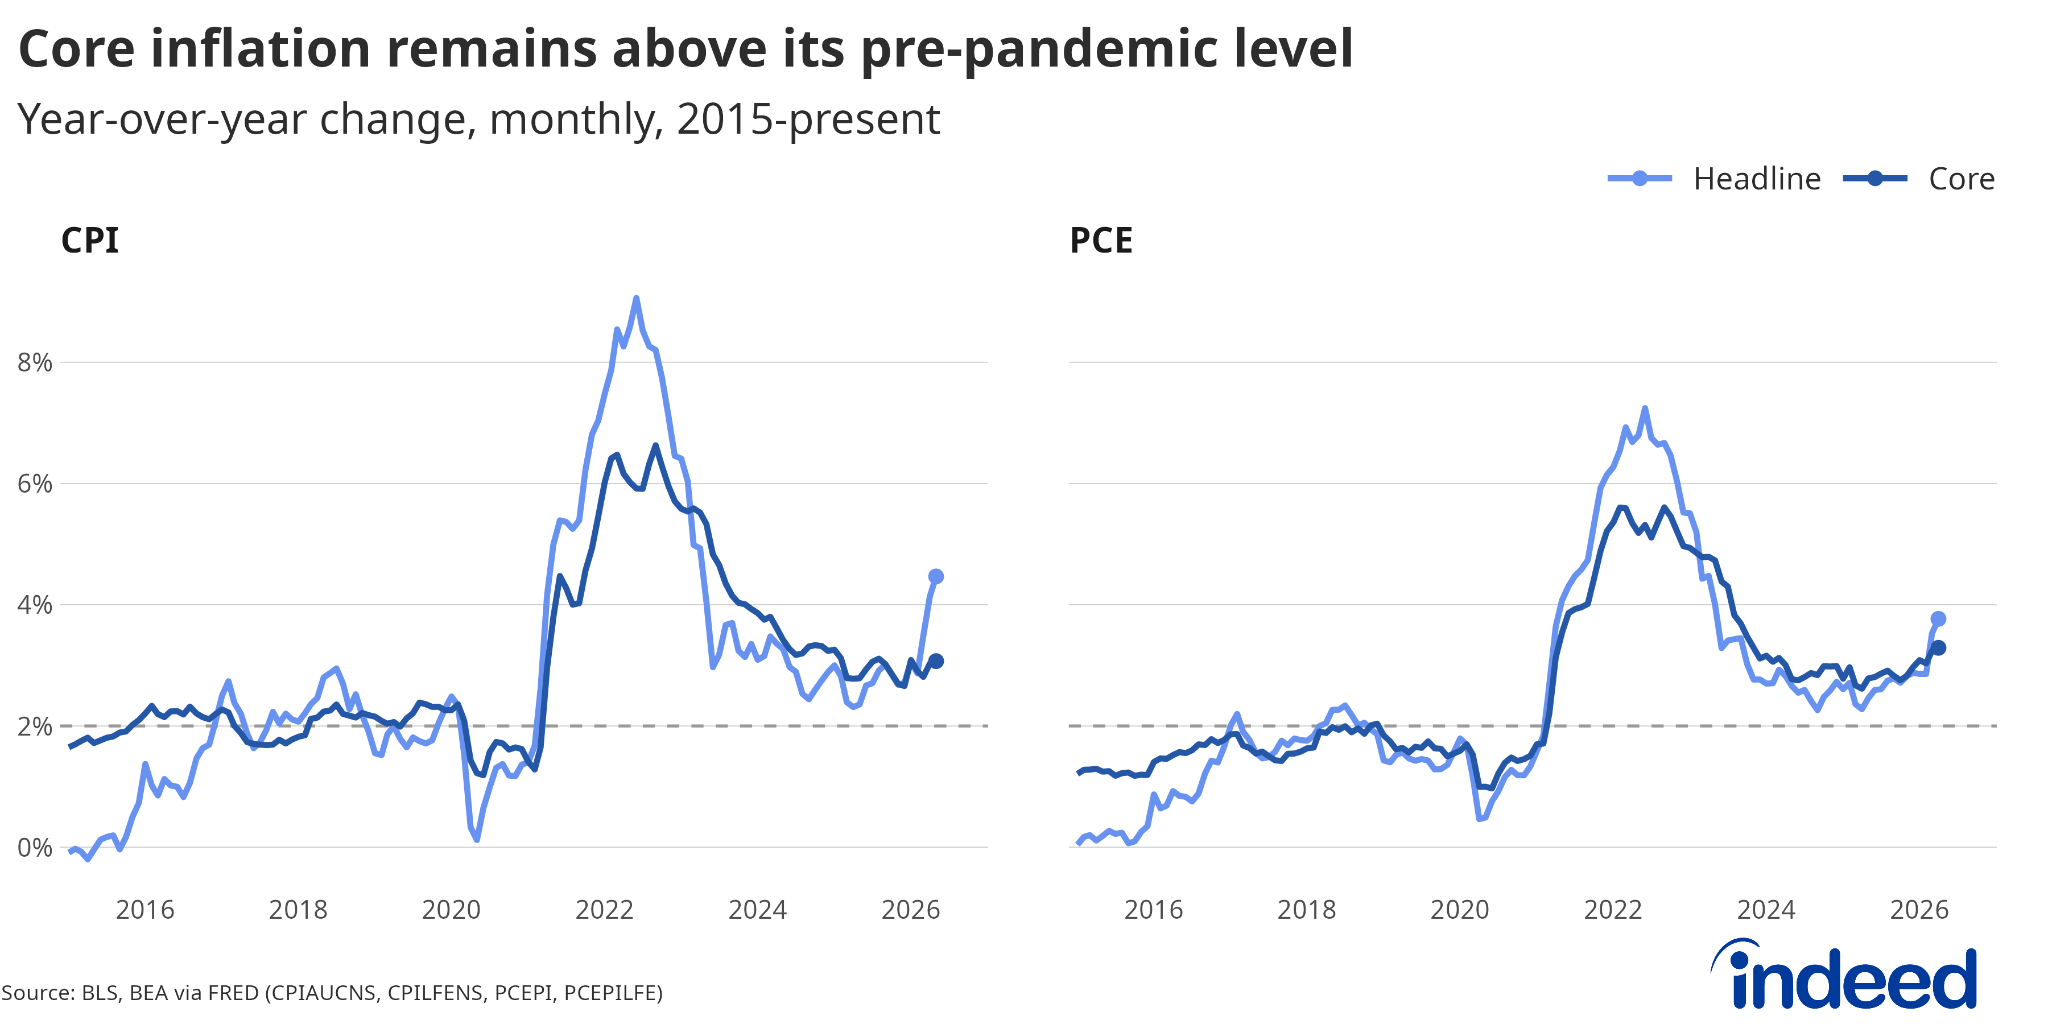
- This imbalance is the root cause of the current strong wage growth, albeit gains that have been diluted by high levels of inflation.
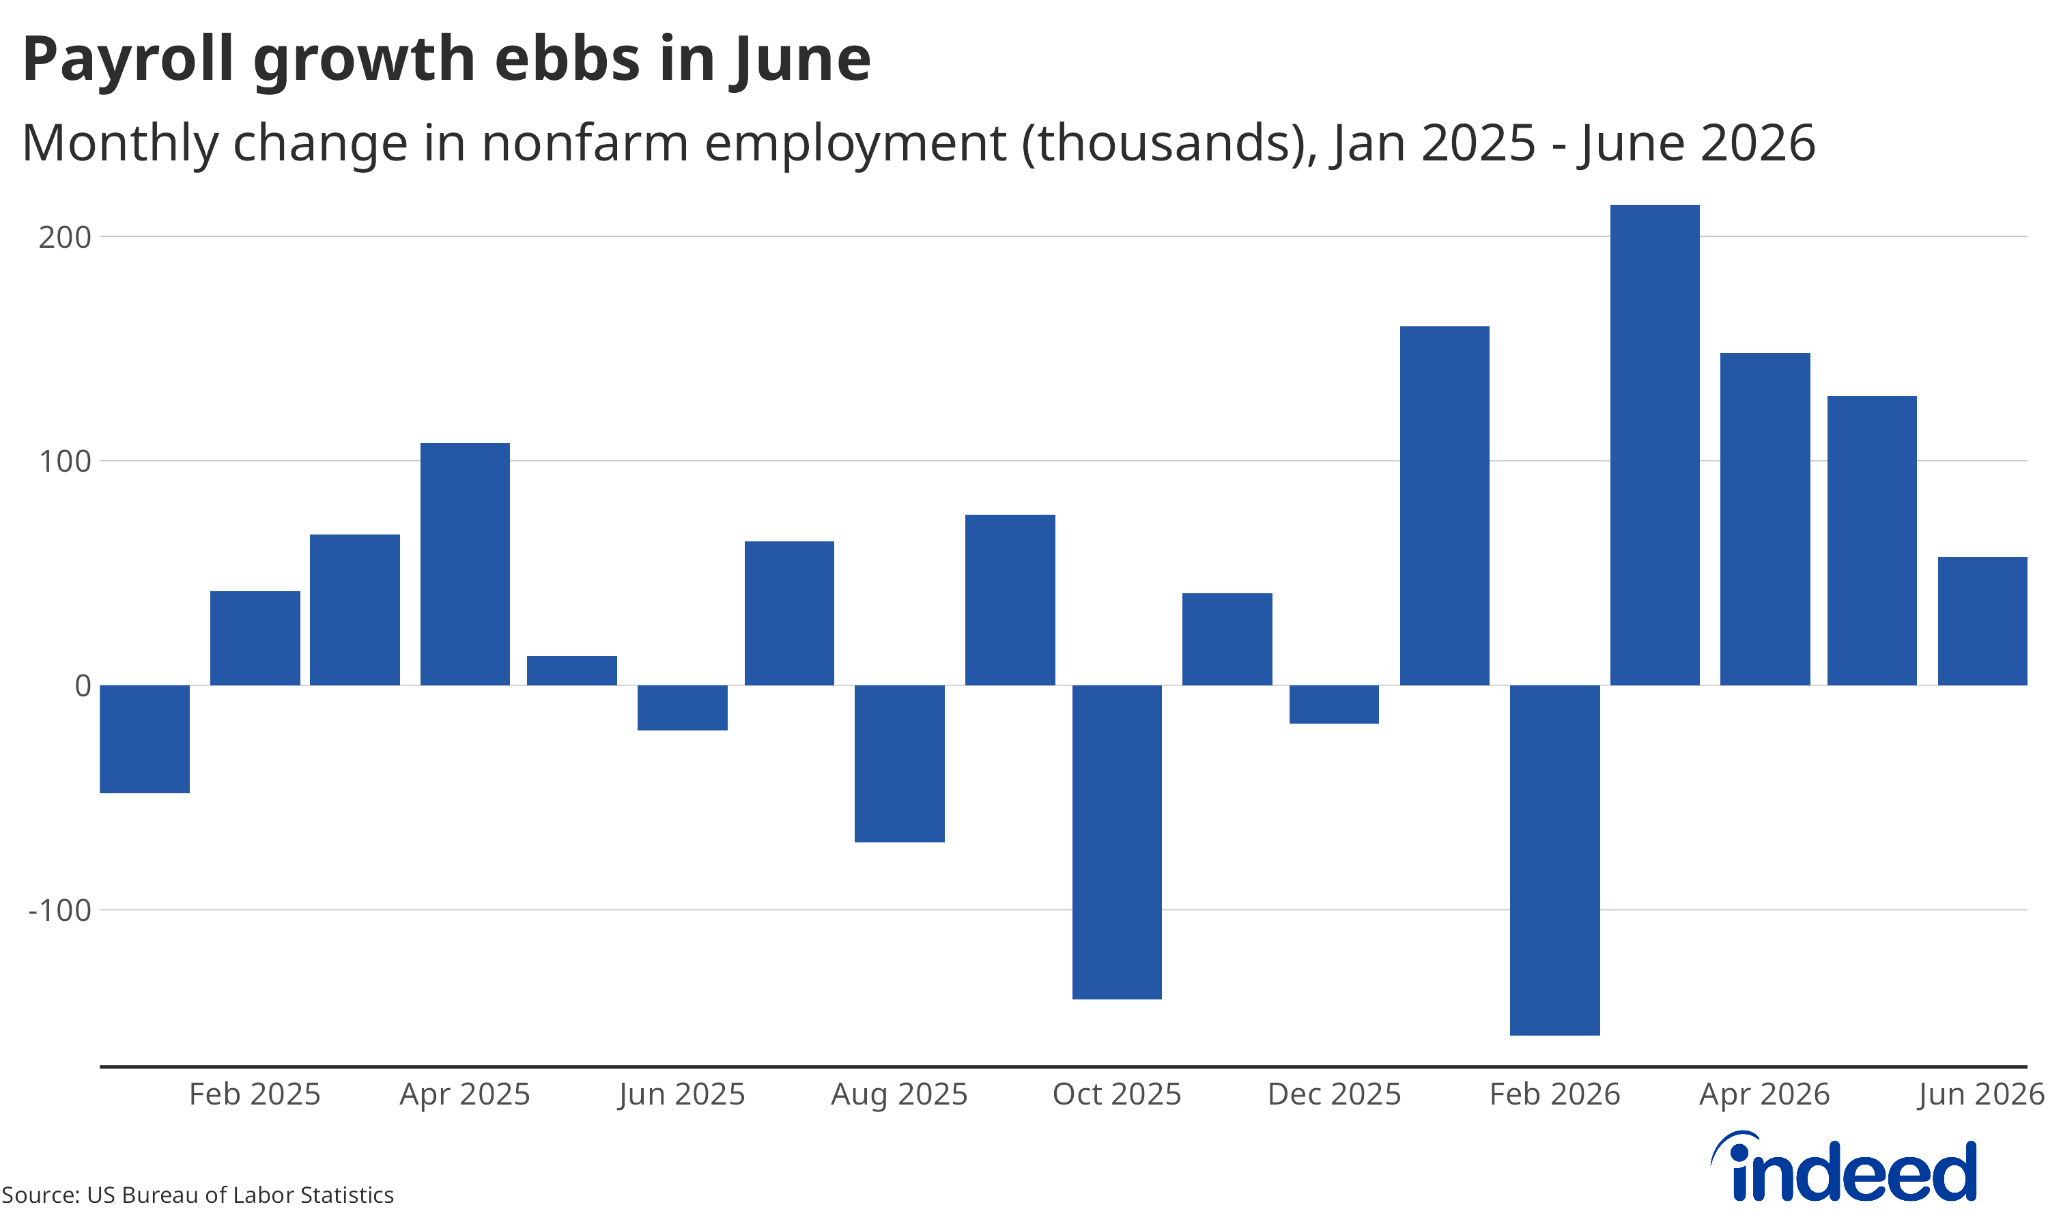
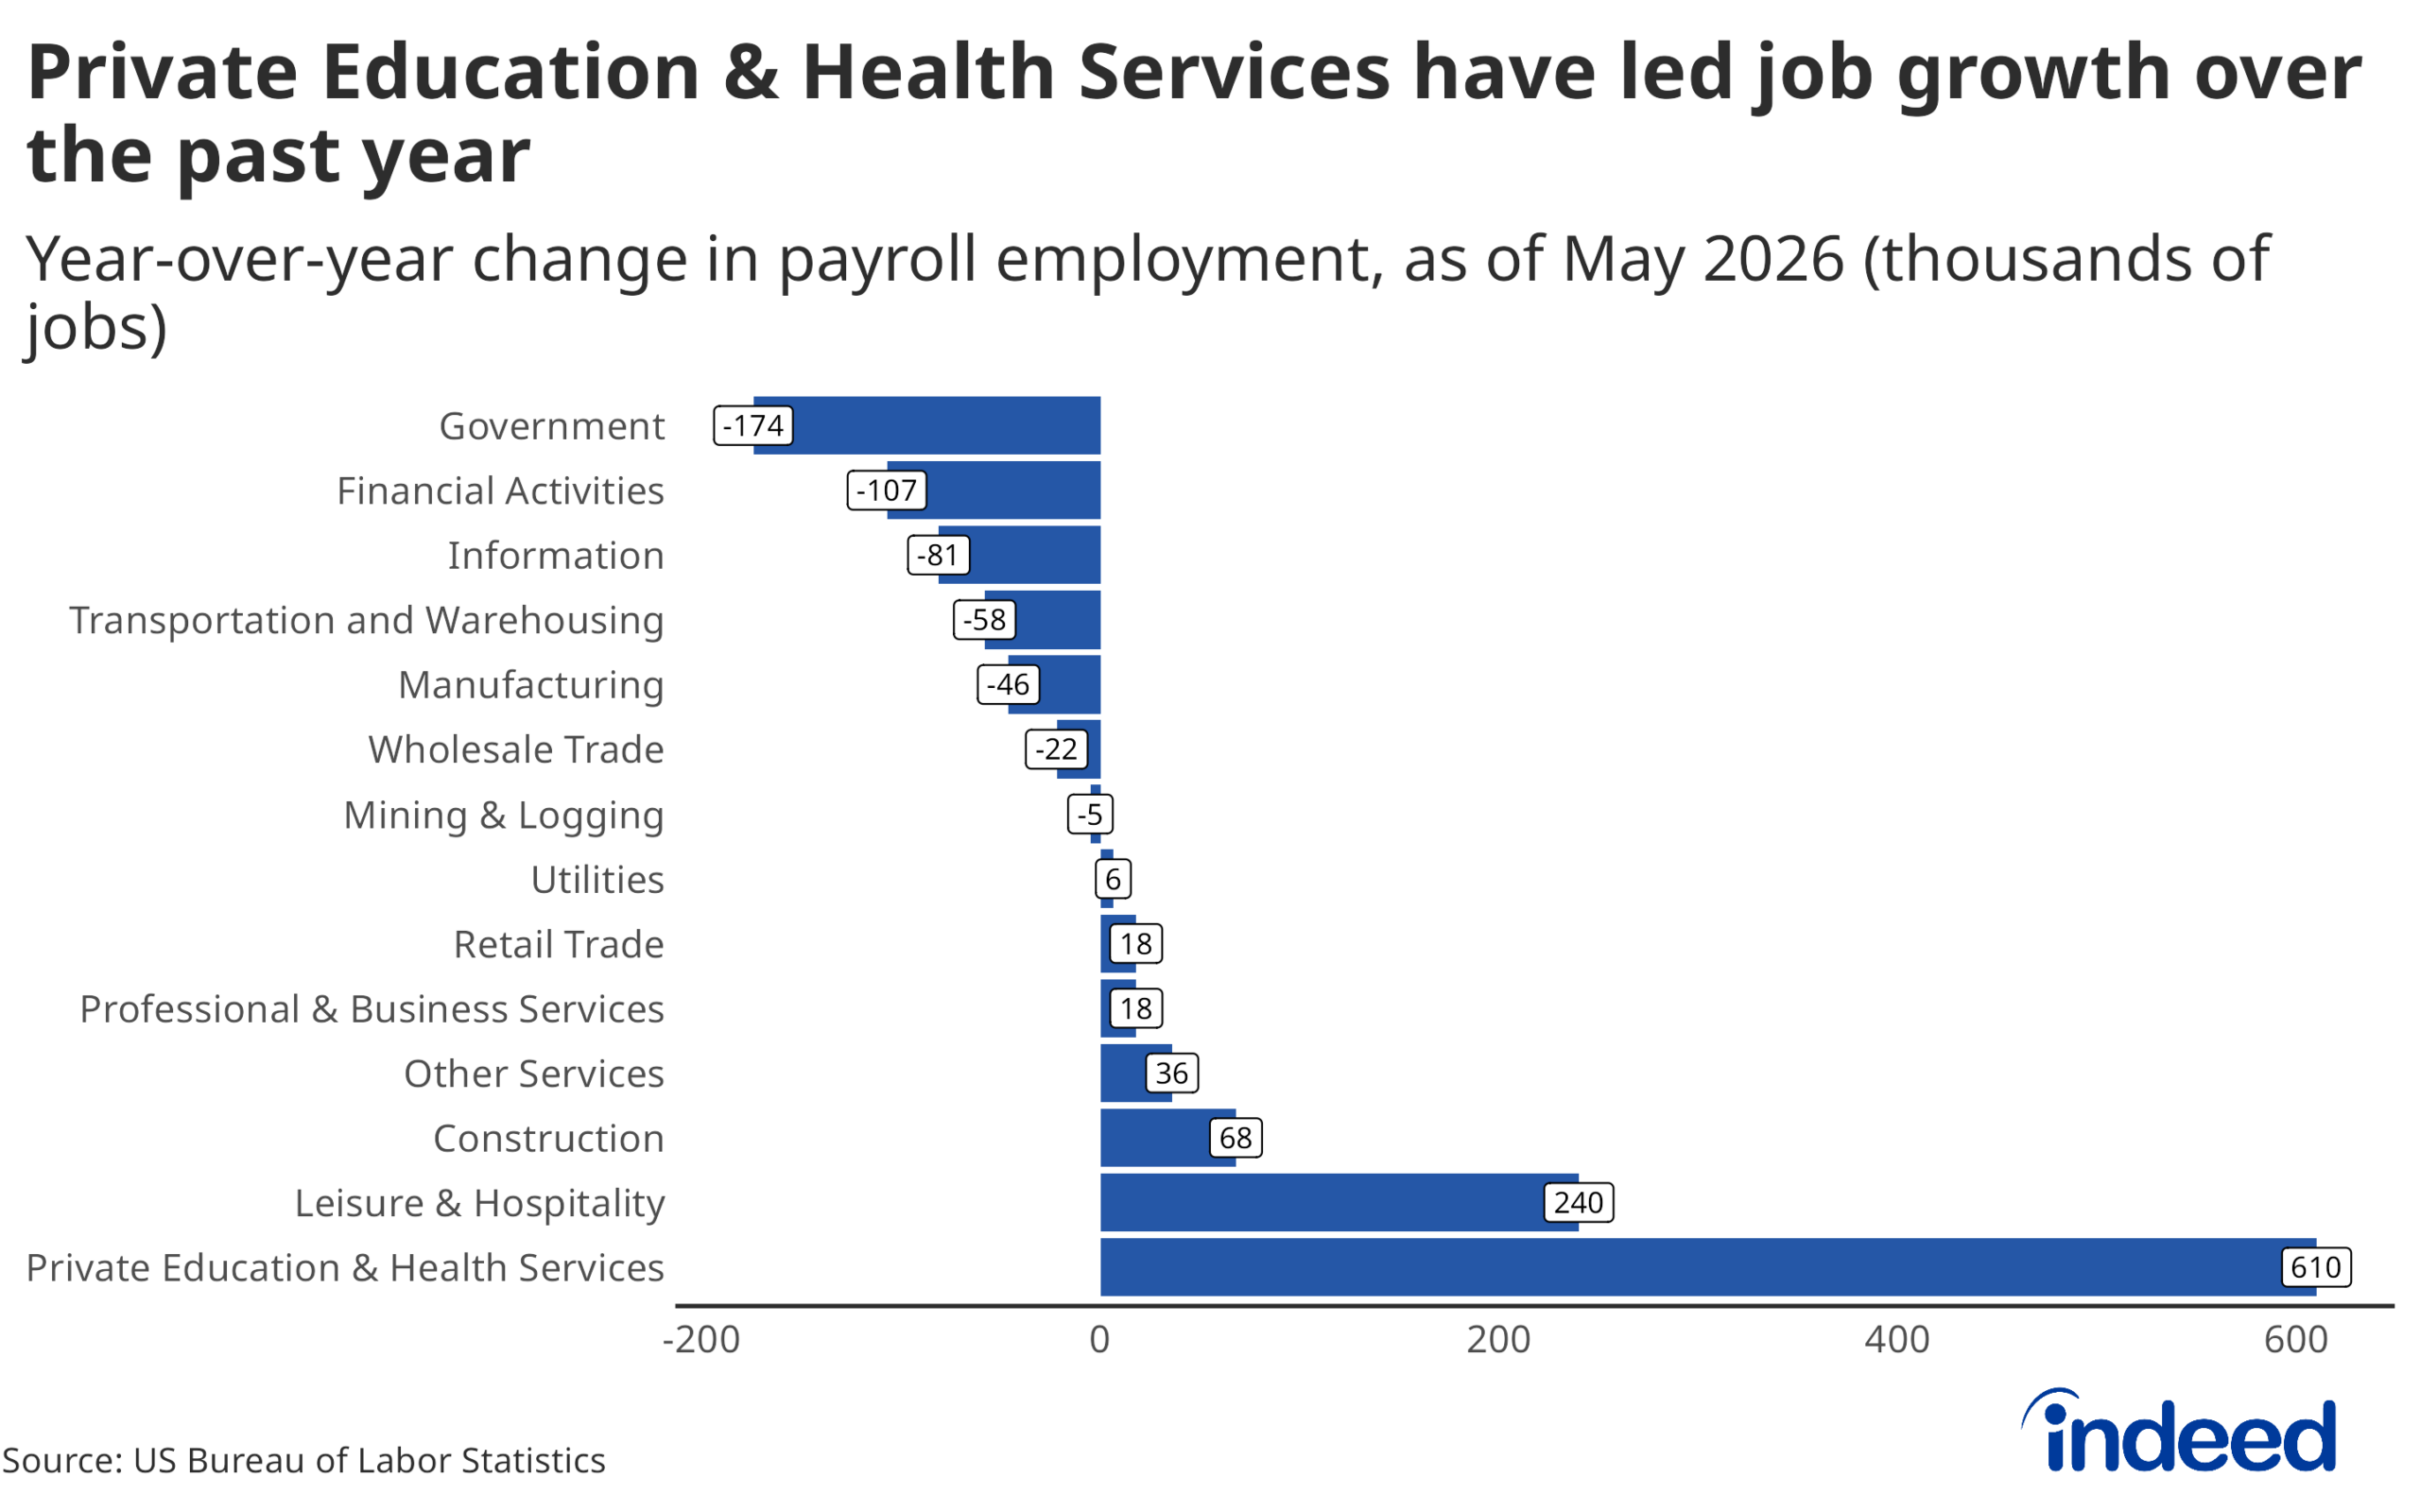
- Employment levels are recovering in response to elevated levels of employer demand, but have not yet returned to pre-pandemic levels.
Spotlight: A Rotation in Wage Growth
Wage growth remains strong, but the source of those strong gains have changed. Since the summer, wage growth has slowed for workers in lower-wage industries while it has increased for workers employed in higher-wage industries. Wage growth in industries such as department stores, food services and drinking places, and child daycare services has tempered, while gains for workers in industries including hospitals and legal services have increased.
The slowdown for lower-wage industries implies that some of the factors giving workers extraordinary leverage last summer have faded. The largest gulfs between demand and supply in these lower-wage, in-person industries seem to have shrunk. The result is slower wage growth, but a pace of gains that is still elevated.
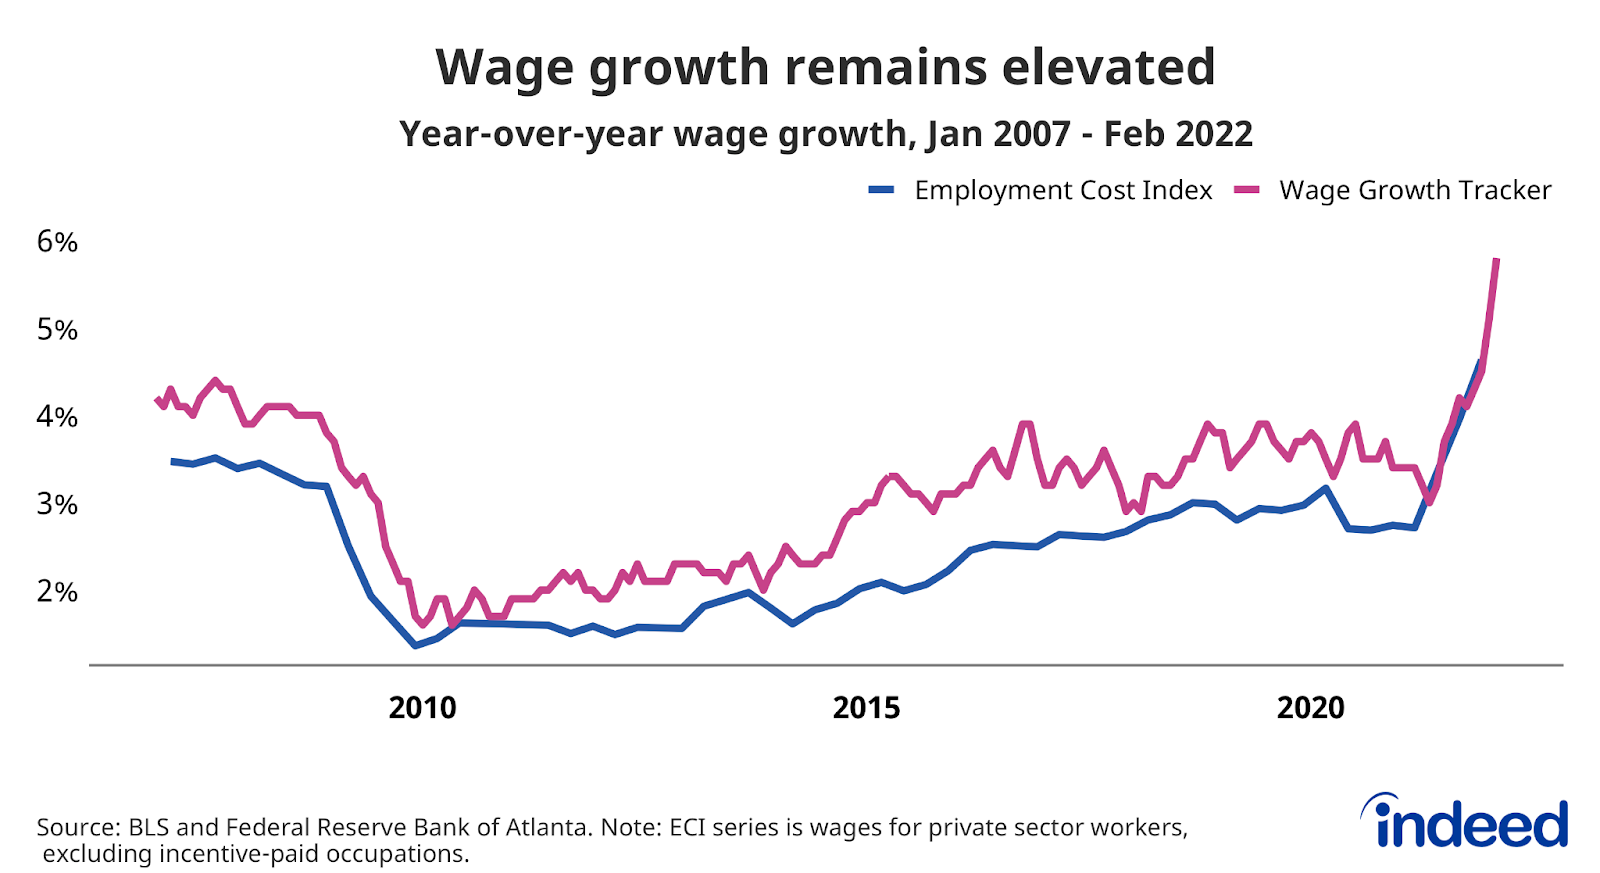
At the same time, the broadening of wage growth is an important trend in itself. The Federal Reserve Bank of Atlanta’s Wage Growth Tracker shows raises are becoming more common among workers. More workers seeing wage gains mean that wages and total incomes could continue to grow briskly even if gains slow among lower-income workers.
Labor Market Overview
The US labor market remains hot. Demand for labor has grown much more quickly than supply as the US economy has quickly recovered from the initial COVID-19 shock. The result has been quickly rebounding employment, fast wage growth and joblessness approaching but not yet at pre-pandemic levels. This forward momentum faces potential speed bumps and roadblocks in the form of quickly tightening monetary policy, geopolitical instability, and new variants of COVID-19.
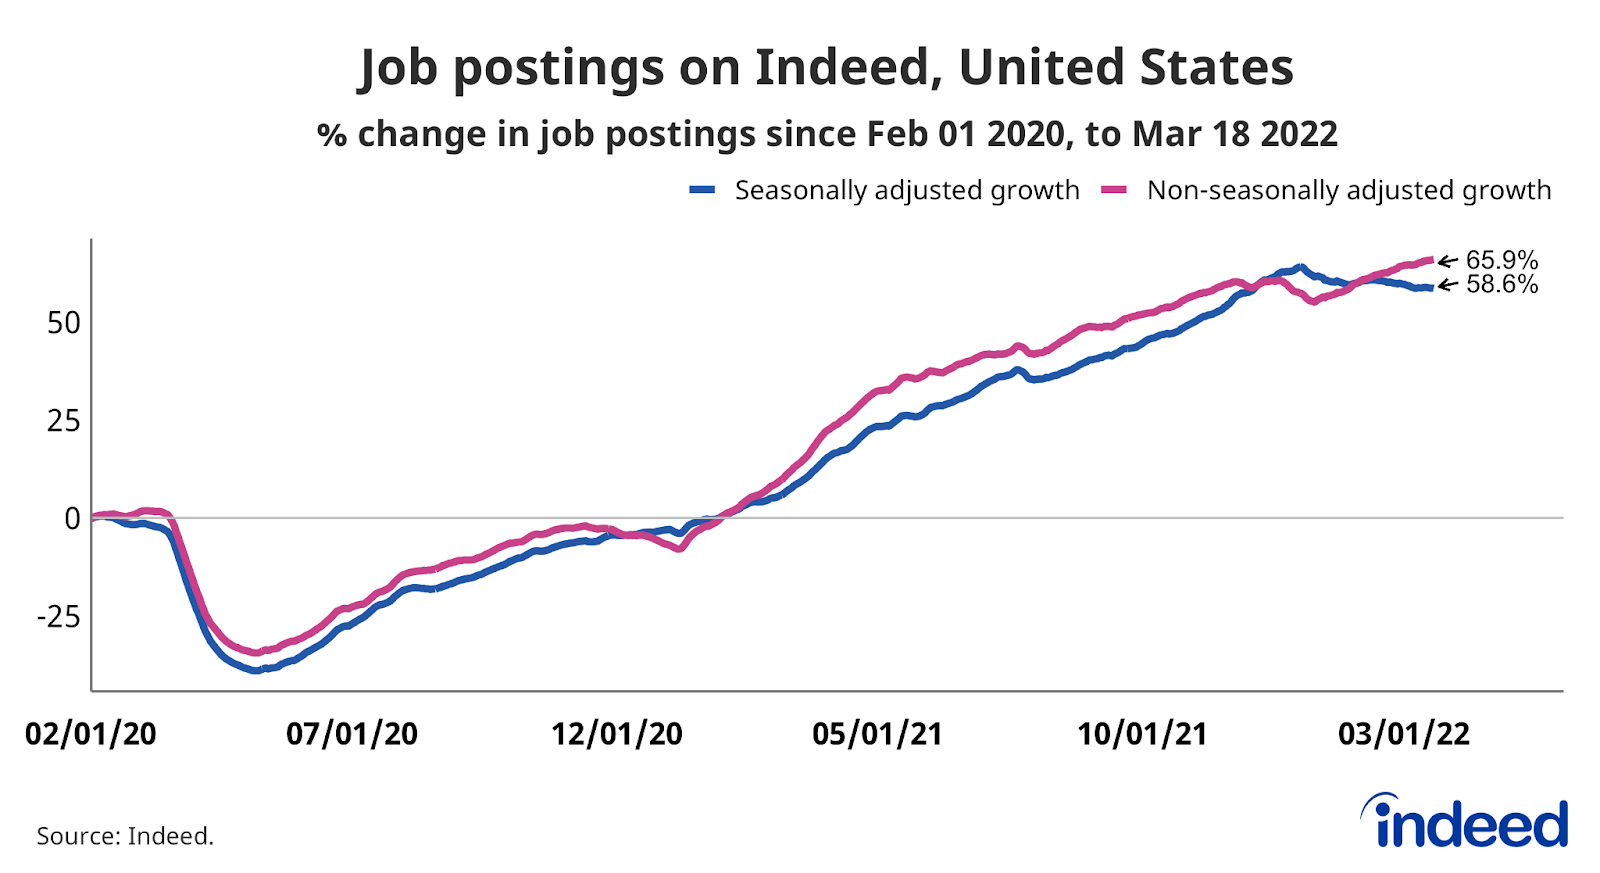
Employer demand for workers remains strong. Indeed job postings are 58.6% above their pre-pandemic baseline, but overall growth in labor demand has slowed in recent months. However this decline has been driven by our adjustment for seasonal fluctuations as non-adjusted postings are above their 2021 year-end level. Occupational sector variation is plentiful, HR job postings are 128% above pre-pandemic baseline but growth in low advertised wage occupations has declined.
Strong wage growth, but inflation eating away gains
This strong demand for workers, with acute hiring difficulties across different sectors, has driven wage growth higher than at any point in over 20 years, with wages growing at almost 6% on a year-over-year basis. While nominal wage gains may be strong, high levels of inflation are eating away gains for many employees. One of the biggest questions for the US economy is what will happen to the pace of nominal wage growth. The rate at which employers are bidding up wages might temper, but inflation would have to drop even more in order for inflation-adjusted raises to become more common.
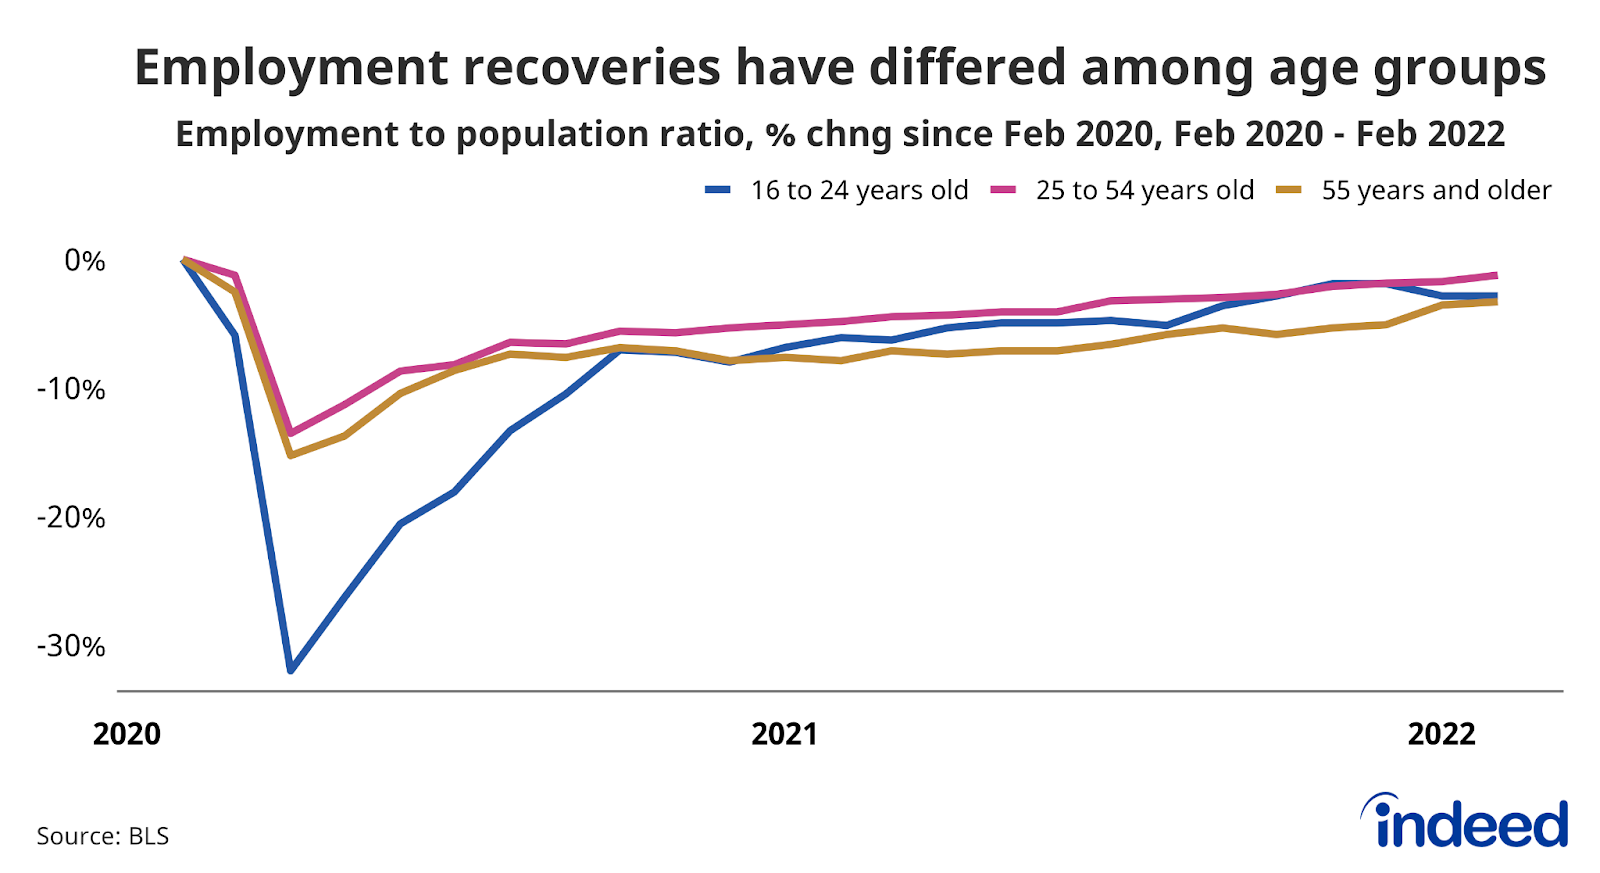
Prime-age workers are returning to work
Labor supply has not grown as swiftly as demand, but people are returning to work. Measures such as the labor force participation rate and the employment-to-population ratio have been sluggish, but a solid rebound has been masked by the aging of the population. Looking at these statistics for people in their prime working years shows much stronger growth in employment and labor force participation.
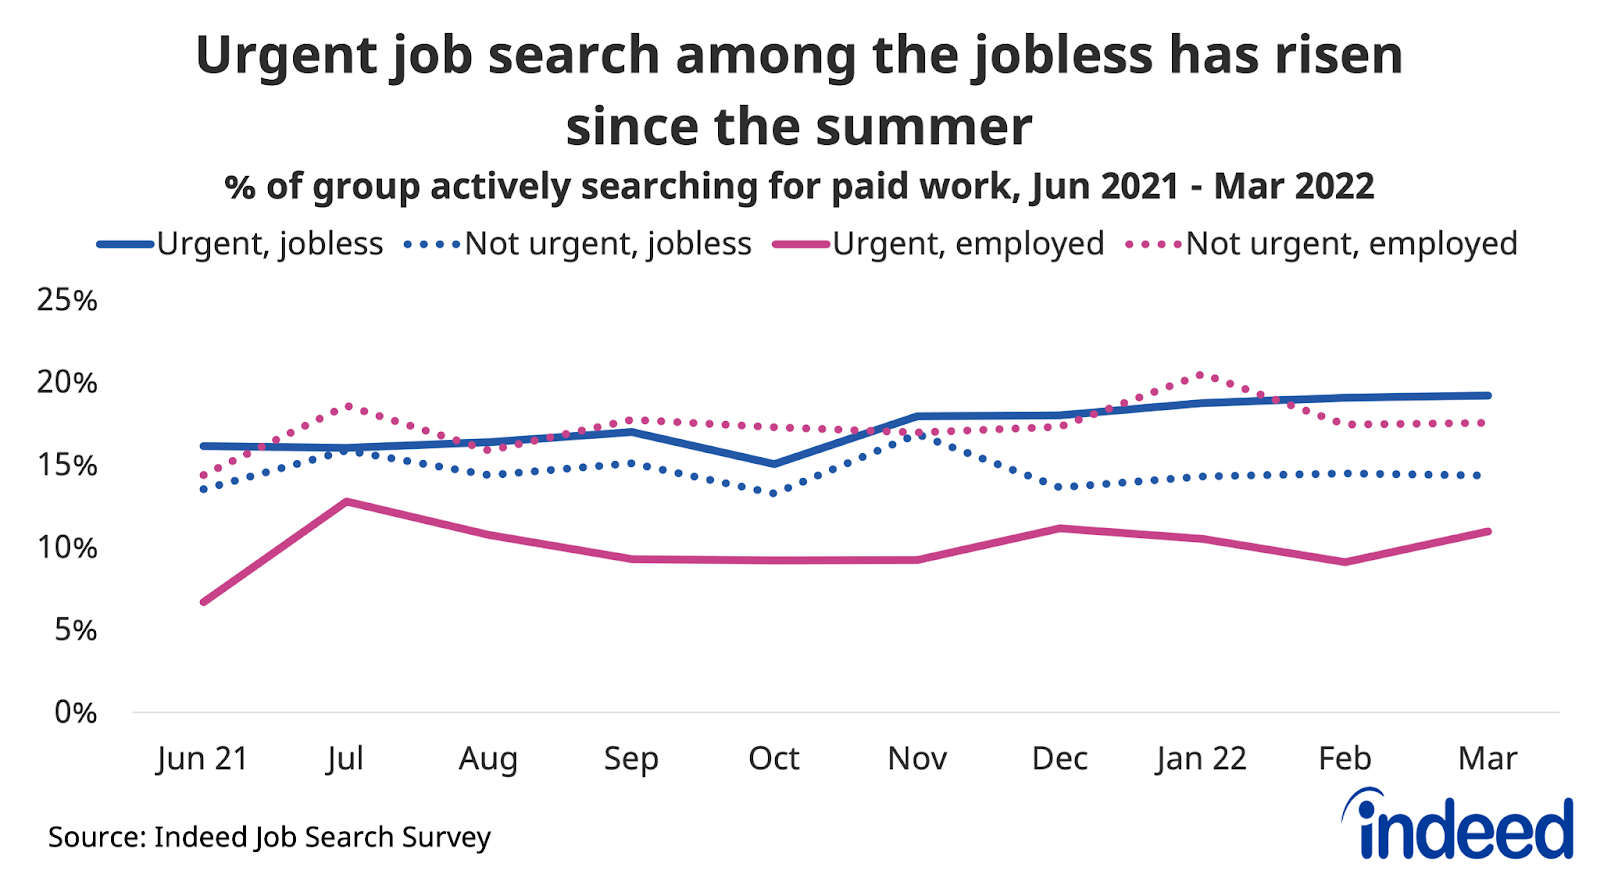
Muted rise in urgent job search
While many people are taking new jobs, the rise in urgency among job seekers has been relatively muted, according to our most recent Indeed Job Search survey data. While more workers are reporting they are searching urgently, the increase is far slower than the rebound in jobs. The pickup in employment is being driven by workers who are being enticed by employers, rather than feeling a need to urgently find new work.
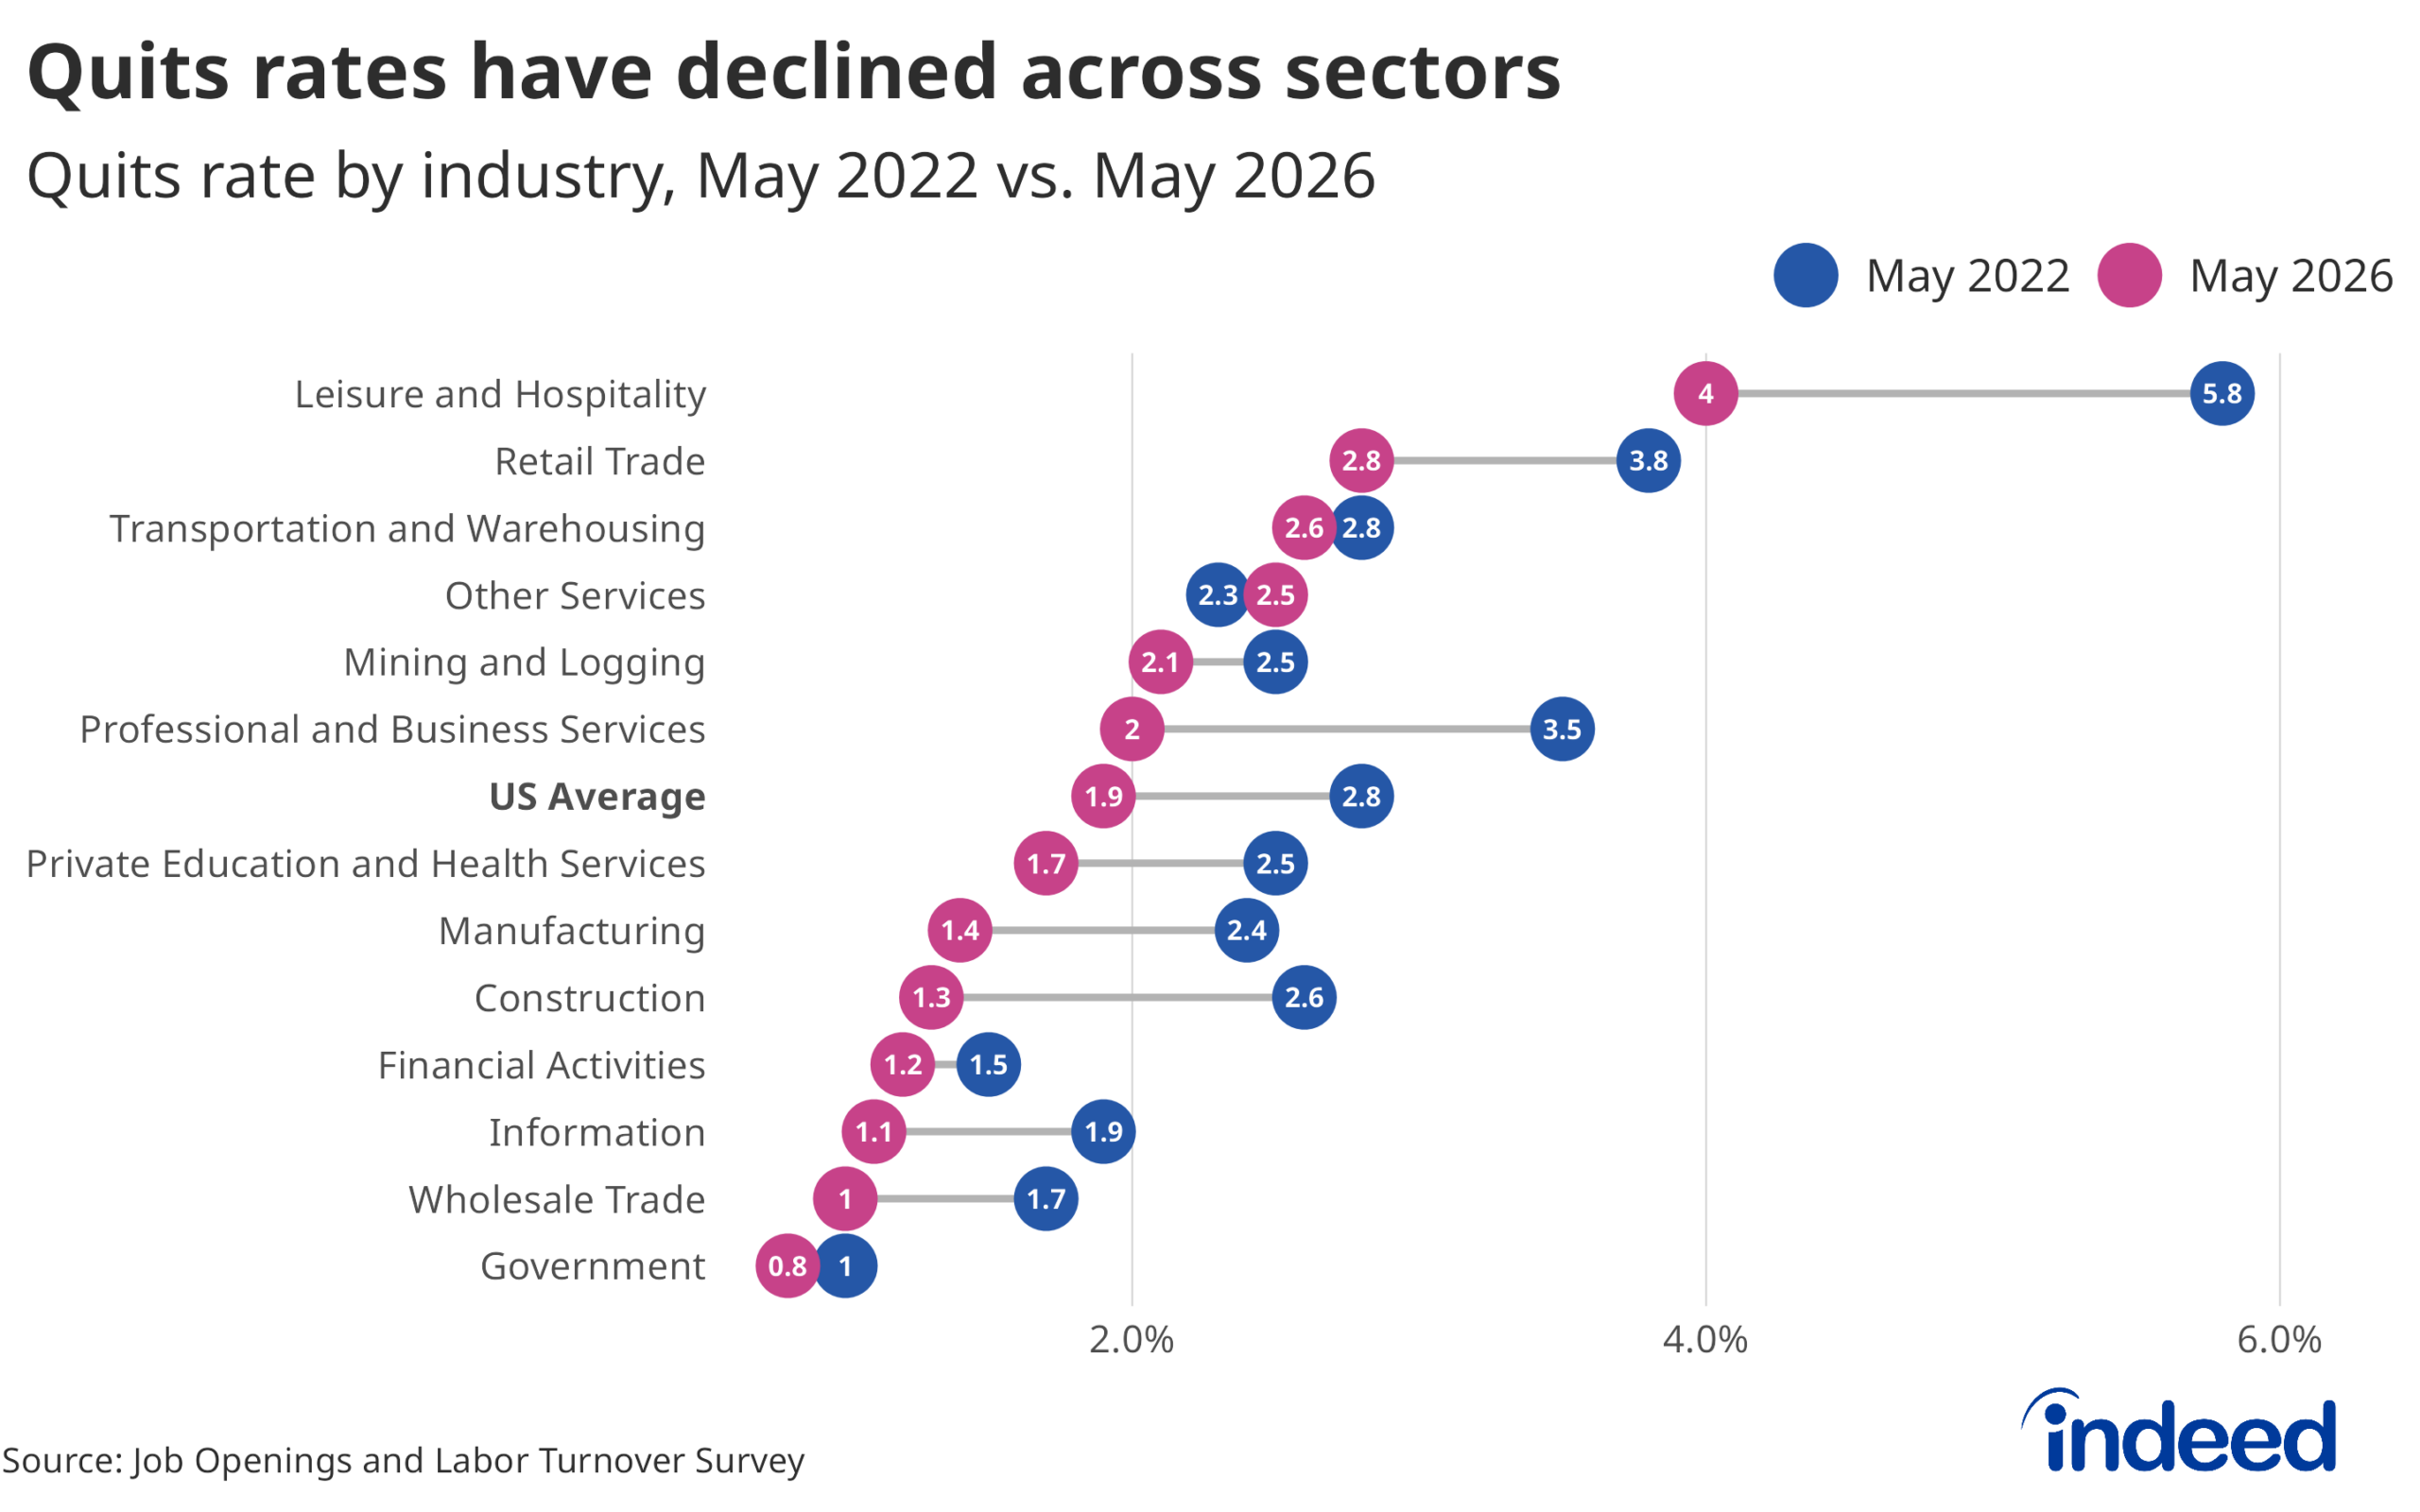
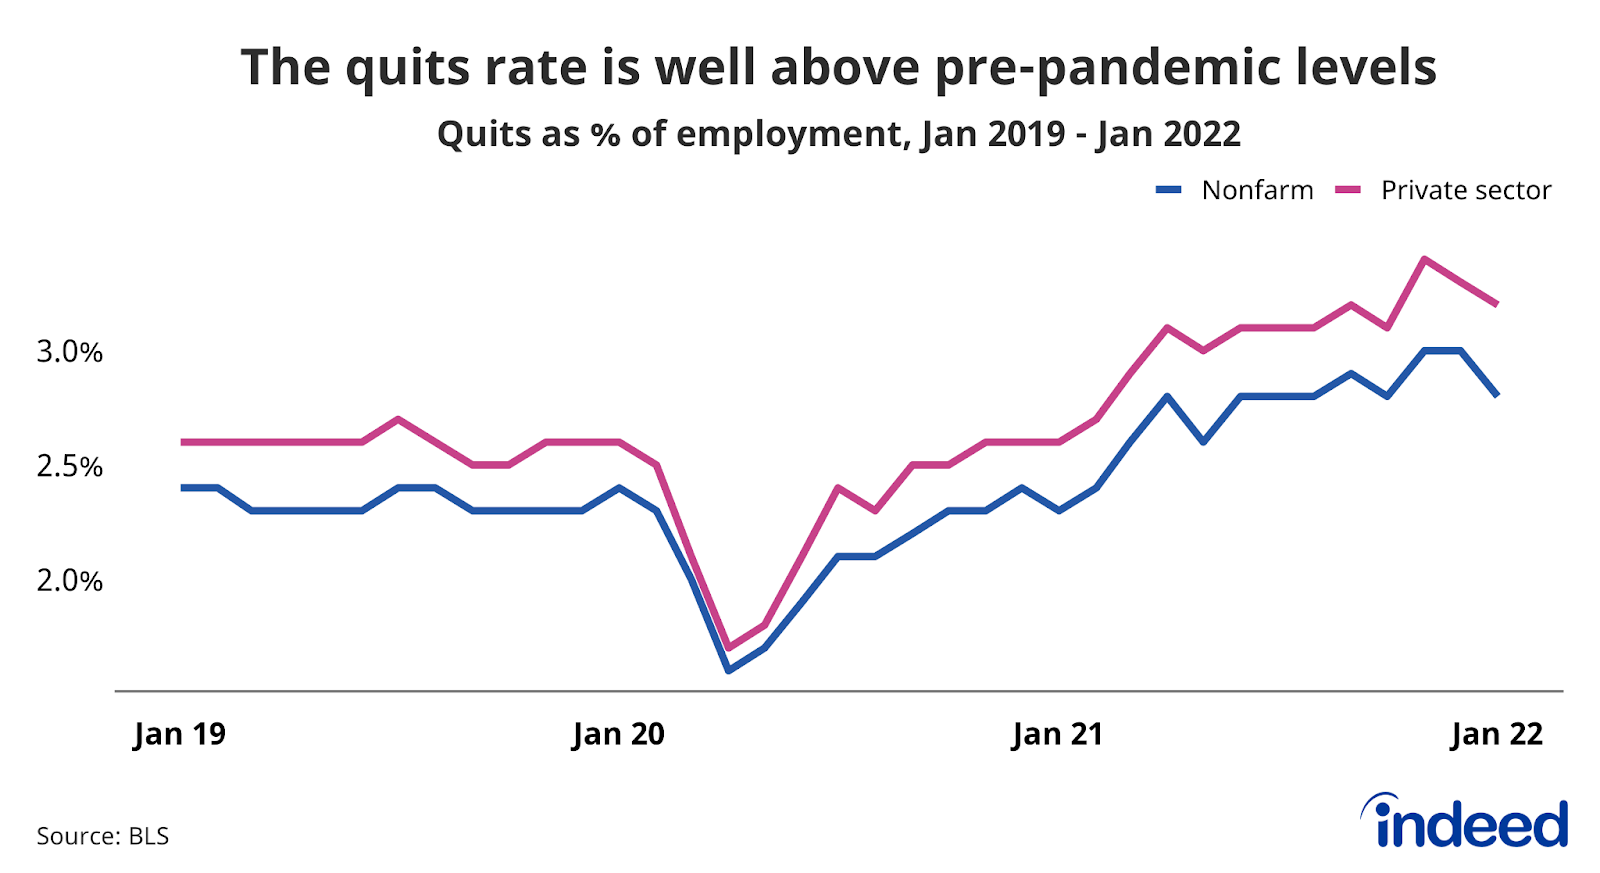
Elevated quits rate
Employed workers are also finding new work. The quits rate is at levels not seen in the 21st century with 3.2% of private sector workers voluntarily leaving their jobs in January 2022. This high volume of quitting has been driven by the strong demand for workers and is concentrated in industry sectors such as manufacturing, leisure and hospitality, and retail trade.
The recent US labor market has offered a variety of opportunities for workers while presenting some challenges to employers. However, the present situation can and will change. We will continue to monitor the above trends and track others as the labor market evolves.
Methodology
Data on seasonally-adjusted Indeed job postings in this blog post are the percentage change in seasonally-adjusted job postings since February 1, 2020, using a seven-day trailing average. February 1, 2020, is our pre-pandemic baseline. We seasonally adjust each series based on historical patterns in 2017, 2018, and 2019. We adopted this methodology in January 2021. Data for June 24-30, 2021, November 1, 2021, January 1, 2022, January 27, 2022 and January 28, 2022 are missing and were interpolated. Non-seasonally adjusted data are calculated in a similar manner except that the data are not adjusted to historical patterns.
The data on job postings are based on publicly available information on the Indeed US website and any other countries if named in the post. Unless specified otherwise, it is limited to the United States, is not a projection of future events, and includes both paid and unpaid job solicitations. US Armed Forces job postings are excluded.
The data from the Job Search Survey is based on ten online surveys of 5,000 US adults ages 18-64, starting in late May 2021 and through March 2022. The first survey was conducted May 26-June 3, the second July 12-20, and the third August 10-18, the fourth from September 13 – 29 and fifth from October 11-20 and the sixth from November 8 – 18 the seventh from December 6 – 22 , the eight from January 10 – 24, the ninth from February 7 – 21, and the most recent from March 7 – 21. Weights were applied to each survey to match respondent distributions across age, educational attainment, race/ethnicity, and sex with the 2020 Current Population Survey’s Annual Social and Economic Supplement.