
We regularly update this report to track the pandemic’s effects on the labor market.
Job postings on Indeed are a real-time measure of labor market activity. On August 27, 2021, they were 39.4% above February 1, 2020, the pre-pandemic baseline, after adjusting for seasonal variation. Postings were up 1.7 percentage points in the past week and 4.2 points over the past four weeks.
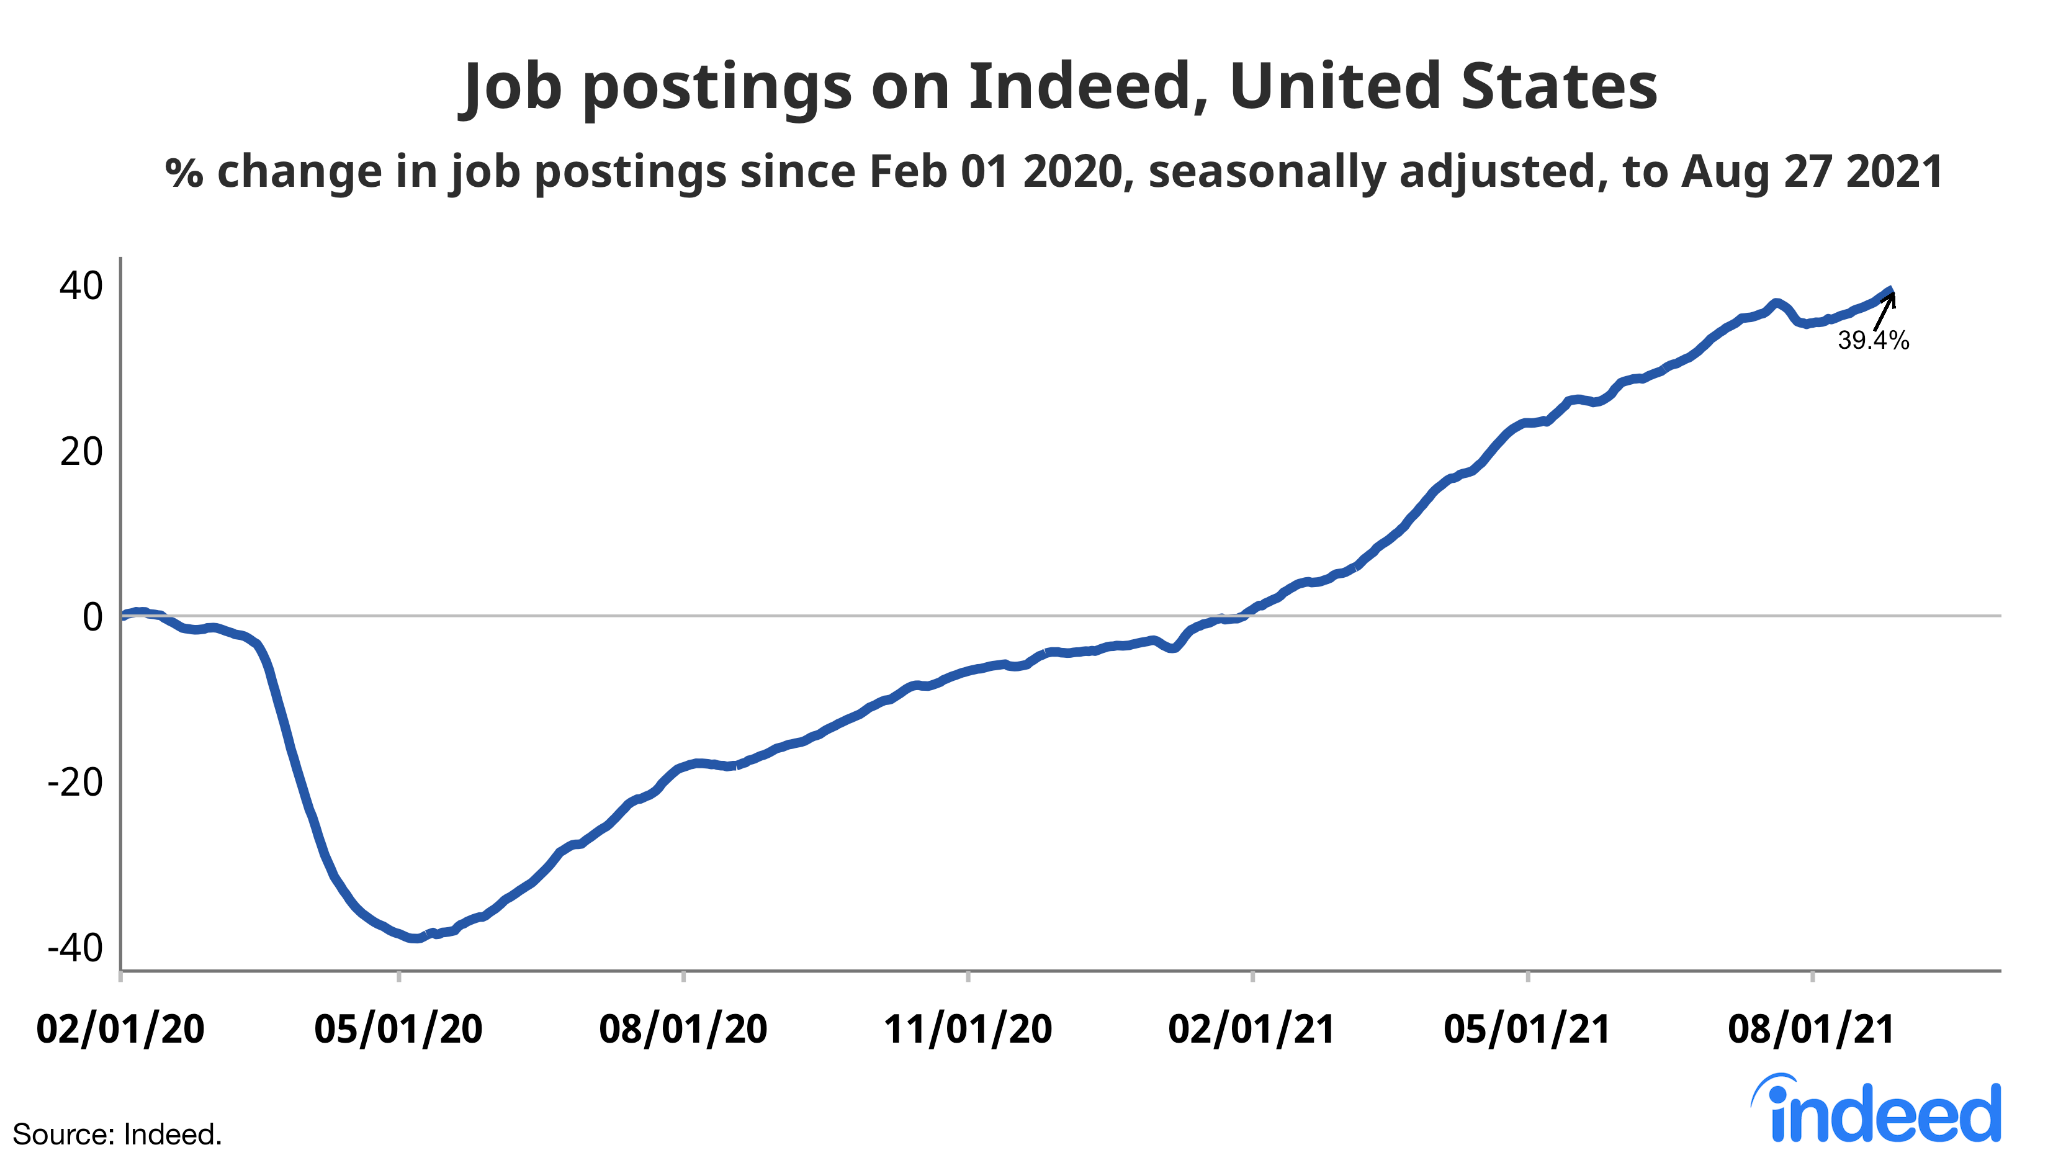
The Bureau of Labor Statistics reported 10.1 million job openings at the end of June in its latest JOLTS report. Job postings on Indeed increased 4.3% between June 30 and August 27. If JOLTS openings have grown since June 30 at the same rate as Indeed job postings, that implies 10.5 million job openings as of August 27.
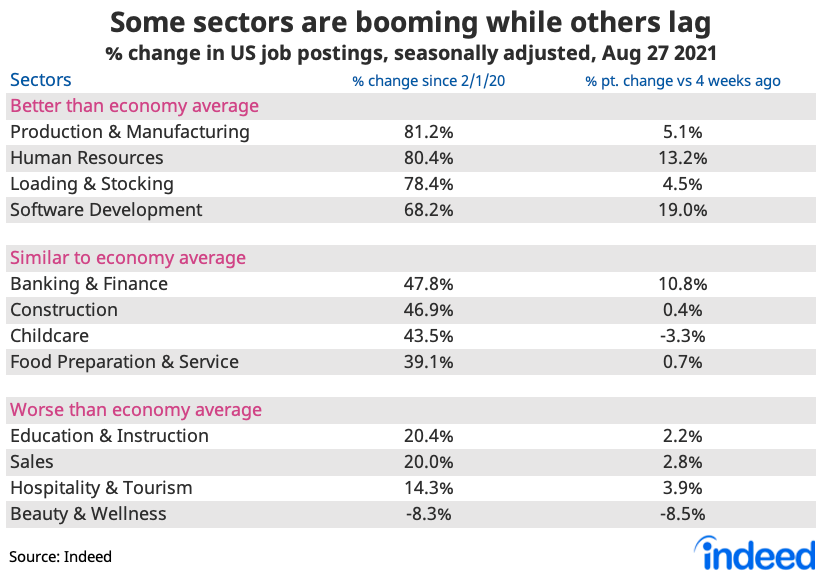
Job postings climbing in tech and HR
Job postings in nearly all sectors are above the pre-pandemic baseline, led by manufacturing and loading & stocking, as well as human resources. Job postings have increased by more than ten points in the past four weeks in the high-paying tech and finance sectors. However, in some virus-sensitive sectors, like childcare and food prep, postings are flat or falling compared with four weeks ago, likely reflecting the effect of the Delta variant
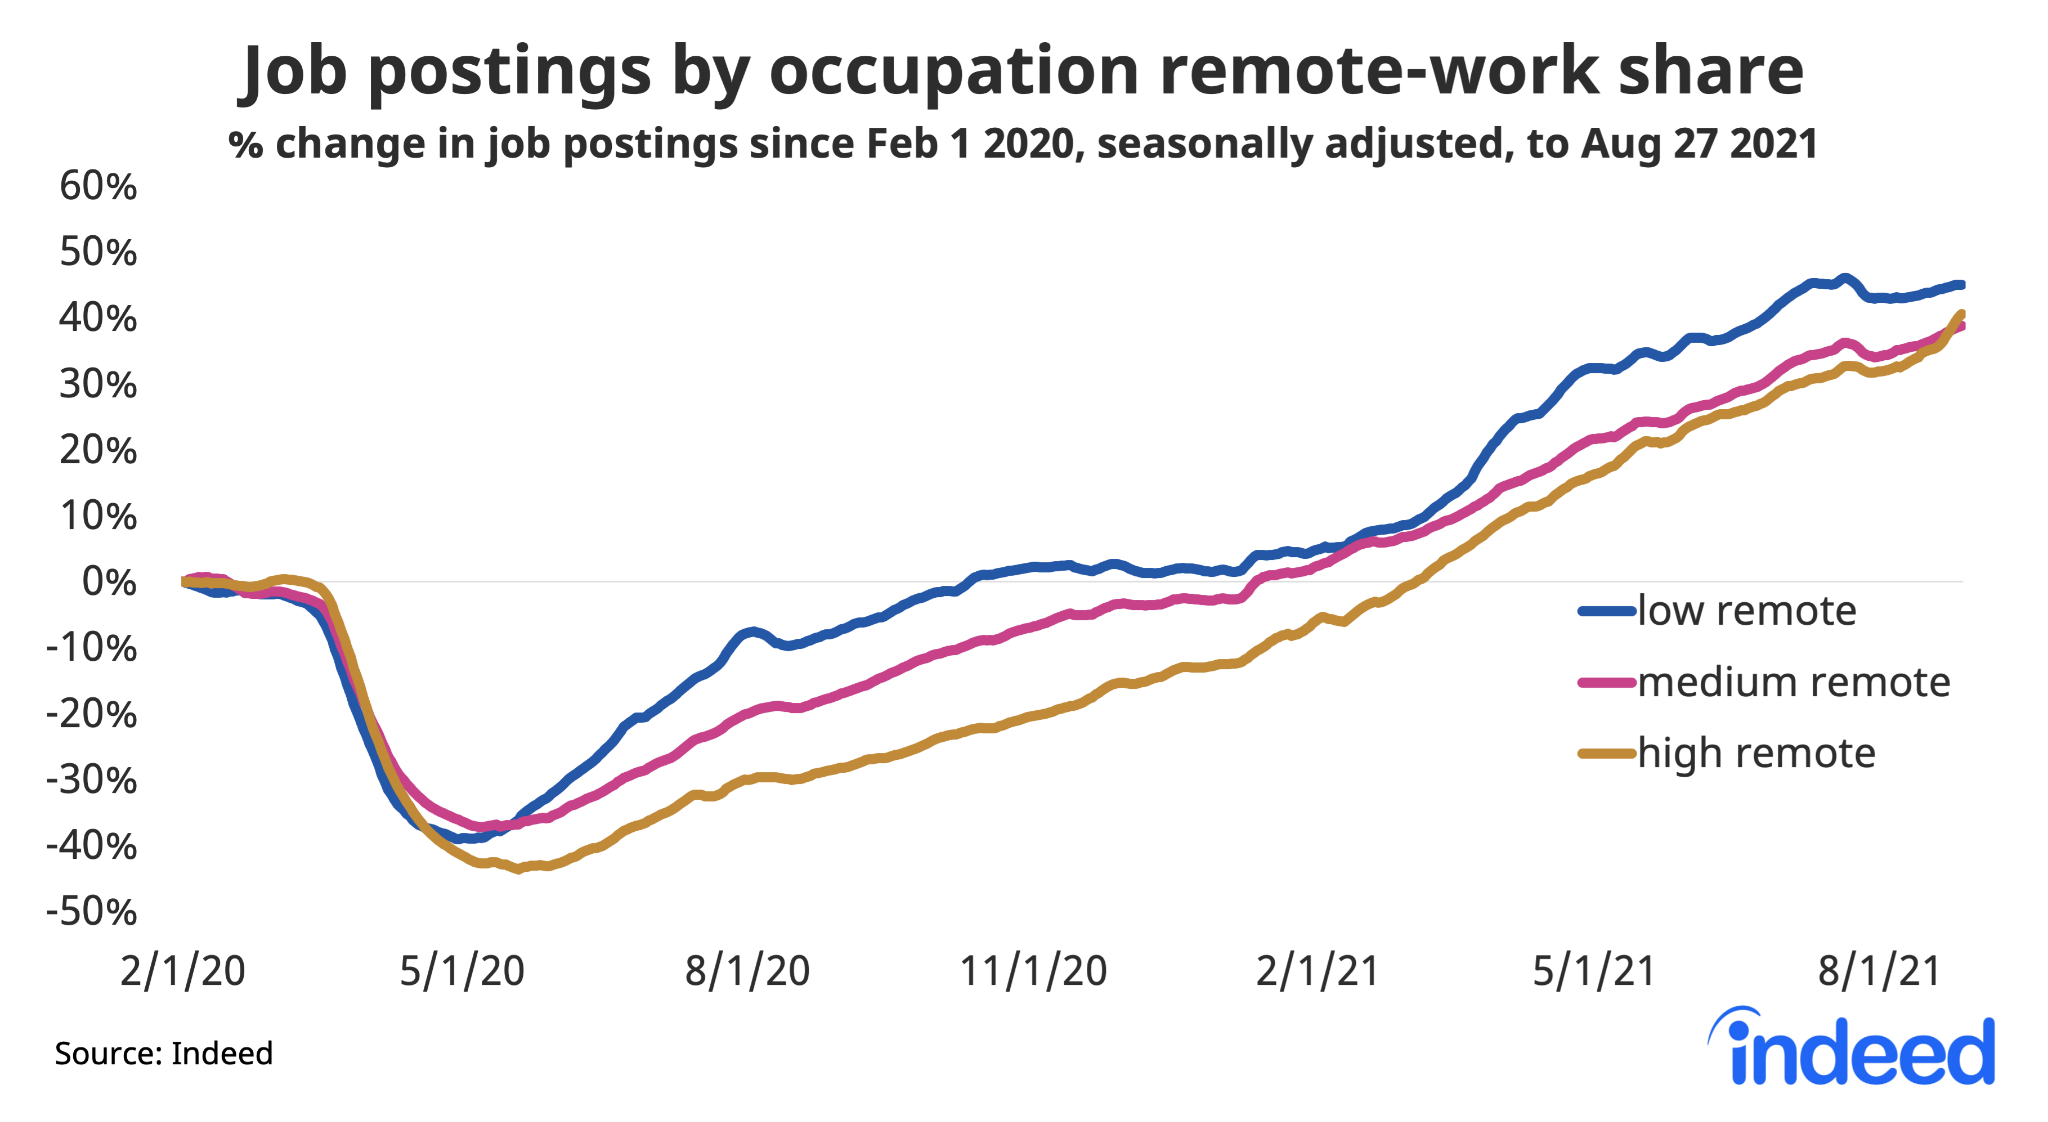
Job postings in high work-from-home sectors like tech and finance have increased most in the past four weeks. In contrast, job postings have increased slowly in in-person sectors where work can’t be done remotely. That’s a shift from earlier in the pandemic, when low-remote postings recovered first and strongest. The shift to remote work in the pandemic created jobs in sectors that supported the stay-at-home economy, like driving and warehouse jobs, that aren’t themselves work-from-home jobs.
Metros where job postings have recovered more slowly
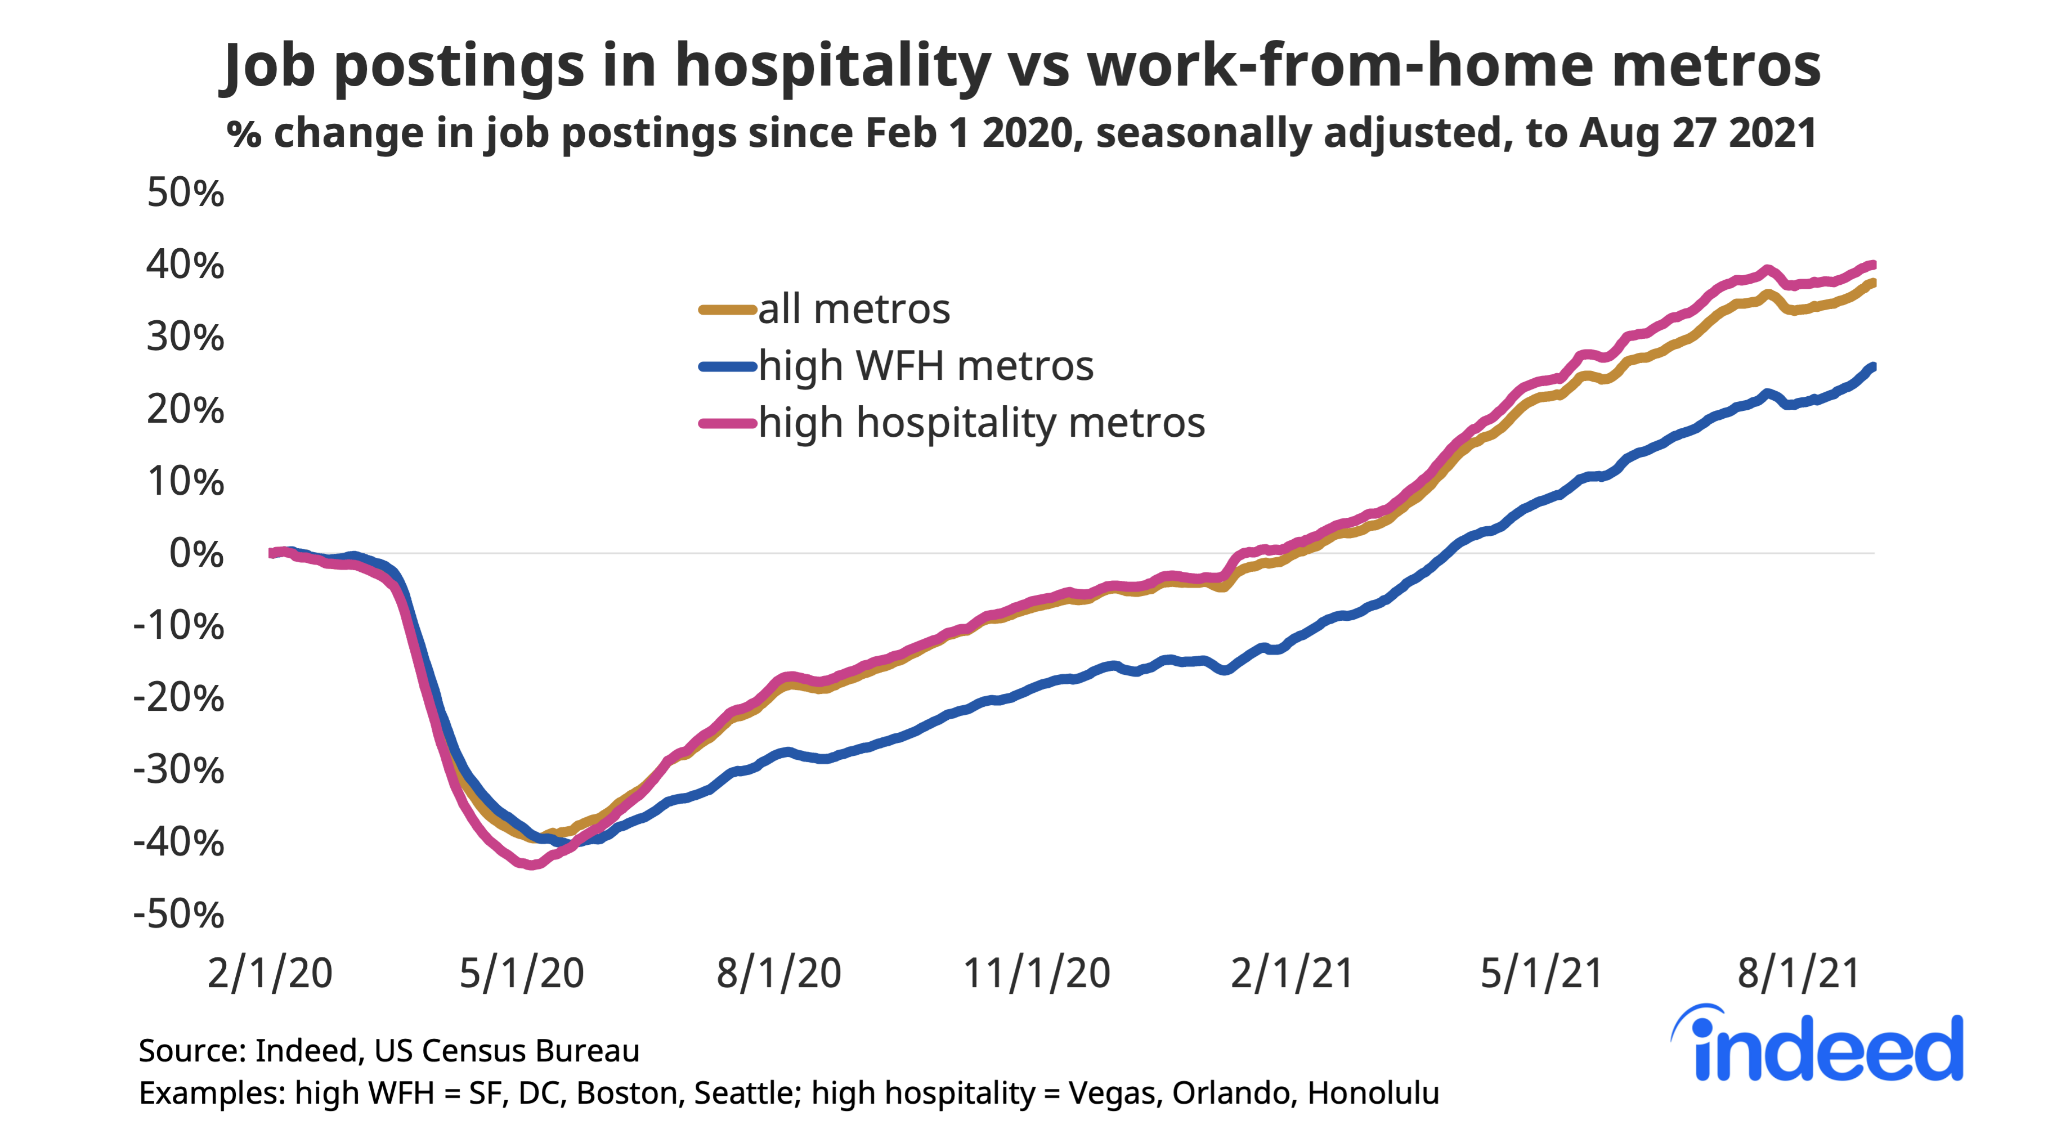
Within the US, job postings are solidly back up above the pre-pandemic baseline in all large metros. Even in Washington DC and Honolulu, the metros where postings have recovered least, job postings are 17% above baseline.
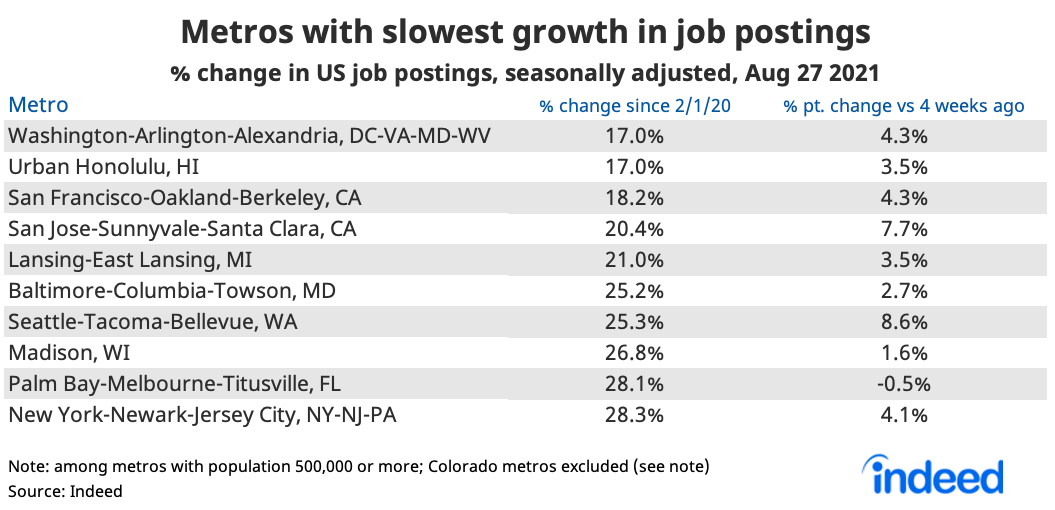
In recent weeks, job postings increased more in metros where a higher share of people work in jobs that can be done remotely. These are mostly large metros with high education levels like tech hubs and finance centers. Earlier in the pandemic, job postings rebounded more slowly in these metros. In high work-from-home metros, postings in retail, restaurant, and personal-services jobs suffered. Postings in these metros finally rose above the pre-pandemic baseline at the end of March.
We host the underlying job-postings chart data on Github as downloadable CSV files. Typically, it will be updated with the latest data one day after this blog post was published.
Methodology
All figures in this blog post are the percentage change in seasonally-adjusted job postings since February 1, 2020, using a seven-day trailing average. February 1, 2020, is our pre-pandemic baseline. We seasonally adjust each series based on historical patterns in 2017, 2018, and 2019. Each series, including the national trend, occupational sectors, and sub-national geographies, is seasonally adjusted separately. We adopted this new methodology in January 2021. Data for June 24-30, 2021, are missing and were interpolated.
Indeed no longer allows Colorado jobs that ask the candidate to disclose their previous salaries. This has a meaningful effect on our postings in the state of Colorado and its metros, though not on our national totals.
The number of job postings on Indeed.com, whether related to paid or unpaid job solicitations, is not indicative of potential revenue or earnings of Indeed, which comprises a significant percentage of the HR Technology segment of its parent company, Recruit Holdings Co., Ltd. Job posting numbers are provided for information purposes only and should not be viewed as an indicator of performance of Indeed or Recruit. Please refer to the Recruit Holdings investor relations website and regulatory filings in Japan for more detailed information on revenue generation by Recruit’s HR Technology segment.