
We regularly update this report to track the pandemic’s effects on the labor market.
Job postings on Indeed are a real-time measure of labor market activity. On June 18, 2021, they were 30.5% above February 1, 2020, the pre-pandemic baseline, after adjusting for seasonal variation. Job postings have increased in May and June by 1.0 percentage point per week, down from 2.0 points per week in April and 2.2 points per week in March.
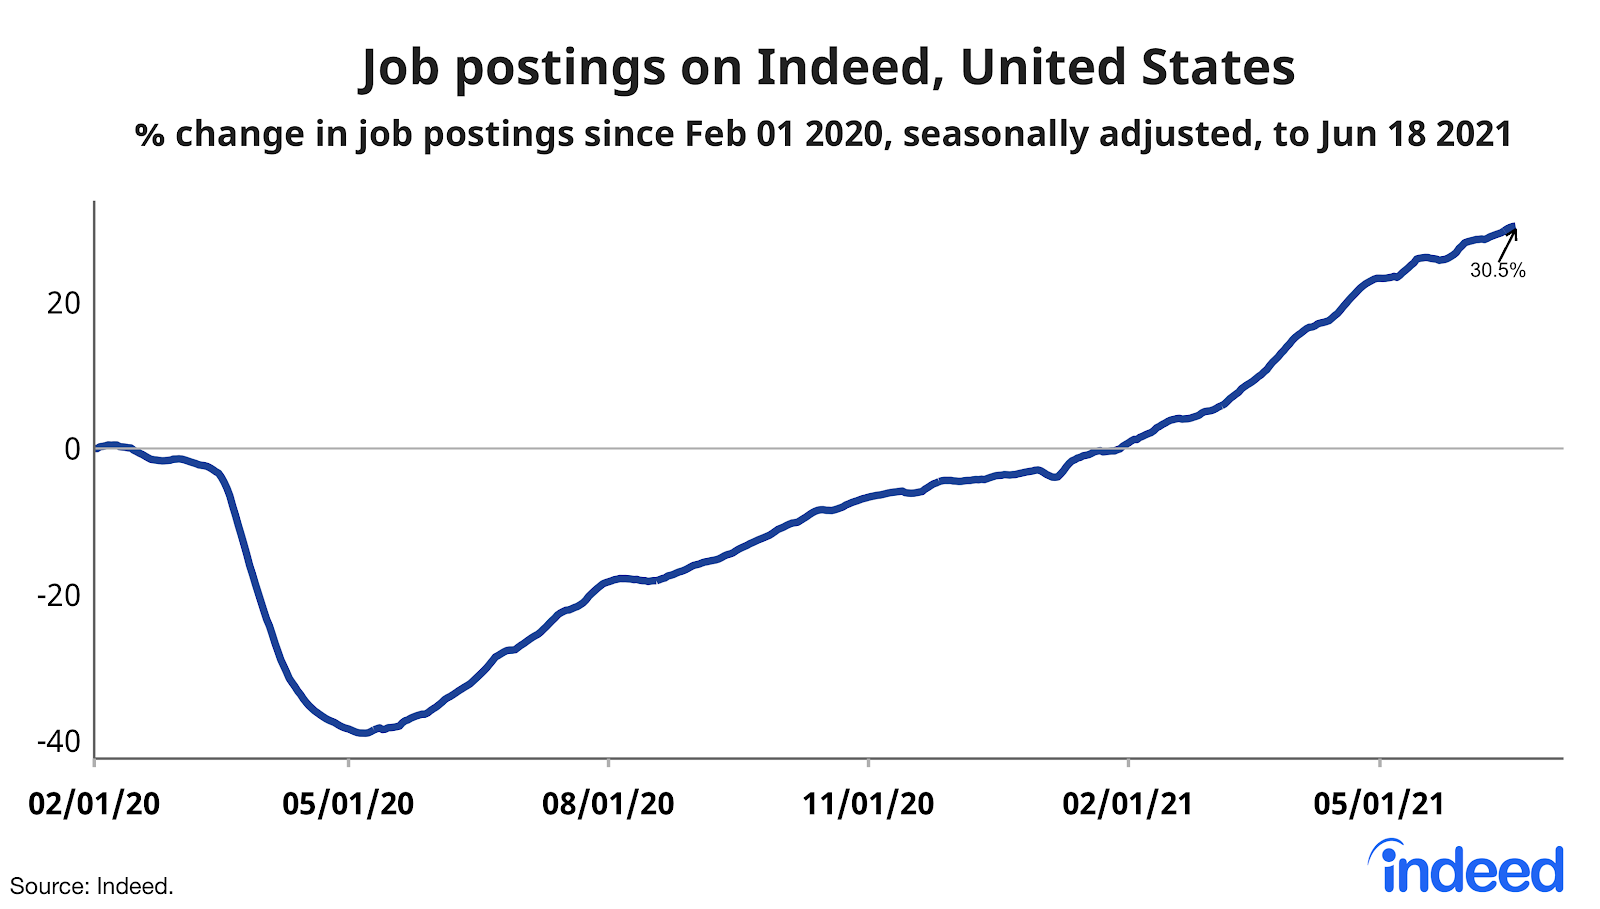
The Bureau of Labor Statistics reported 9.3 million job openings at the end of April in its latest JOLTS report. Job postings on Indeed increased 5.8% between April 30 and June 18. If JOLTS openings have grown since April 30 at the same rate as Indeed job postings, that implies 9.8 million job openings as of June 18.
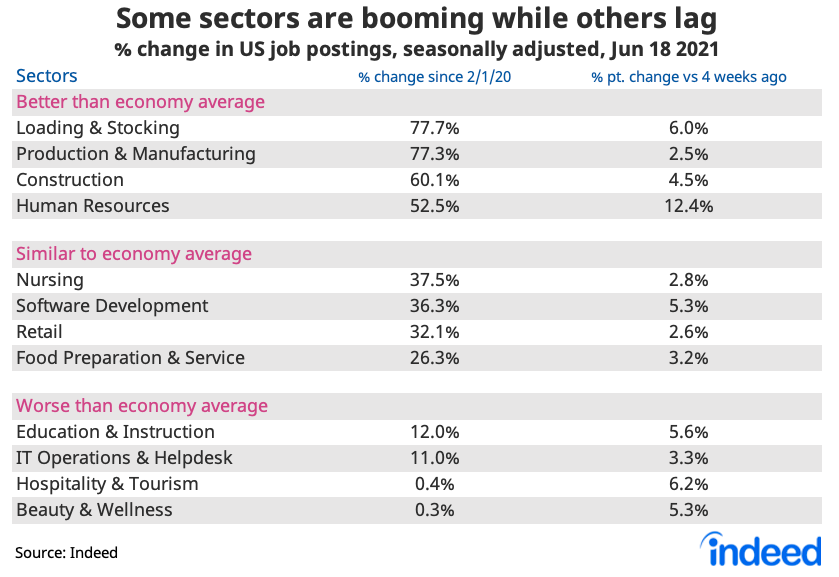
Big rebound in jobs that make & move stuff, and HR jobs
Job postings in all sectors are above the pre-pandemic baseline, led by goods-related sectors like manufacturing, loading & stocking, and construction. The big laggards remain hospitality & tourism and beauty & wellness, which are hovering close to the February 1, 2020, baseline.
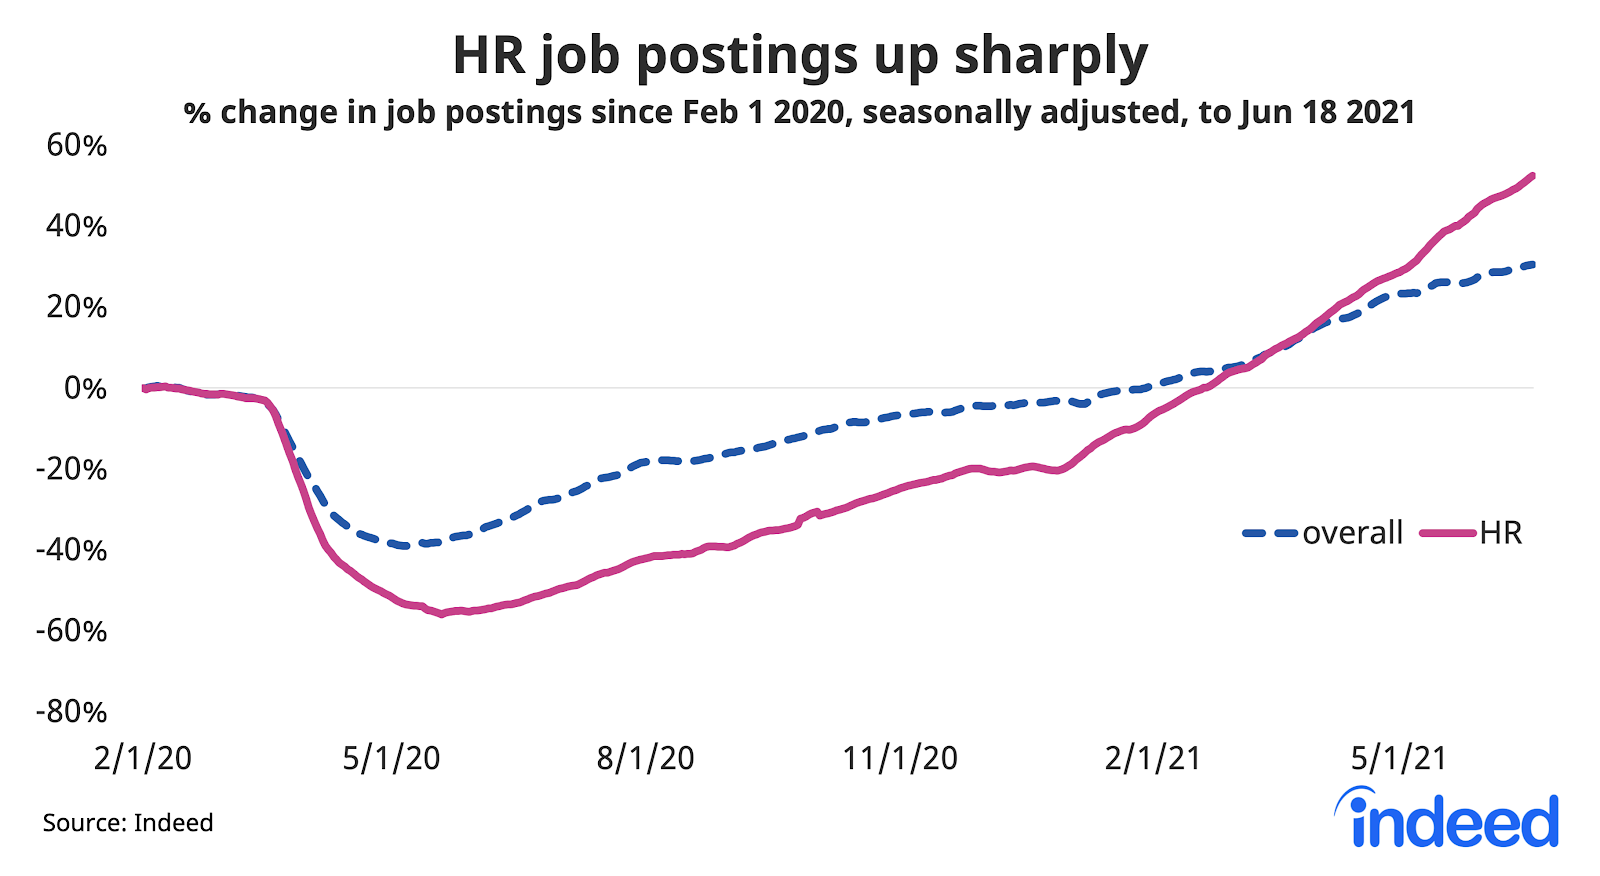
As companies across all sectors are increasingly looking to hire, human resources job postings have risen sharply and are now 52.5% above the pre-pandemic baseline. Throughout most of the pandemic, hiring was depressed. Therefore, HR job postings lagged the economy overall, hitting a low of 56% below the pre-pandemic baseline in May 2020. But now HR postings are even higher above baseline than postings overall.
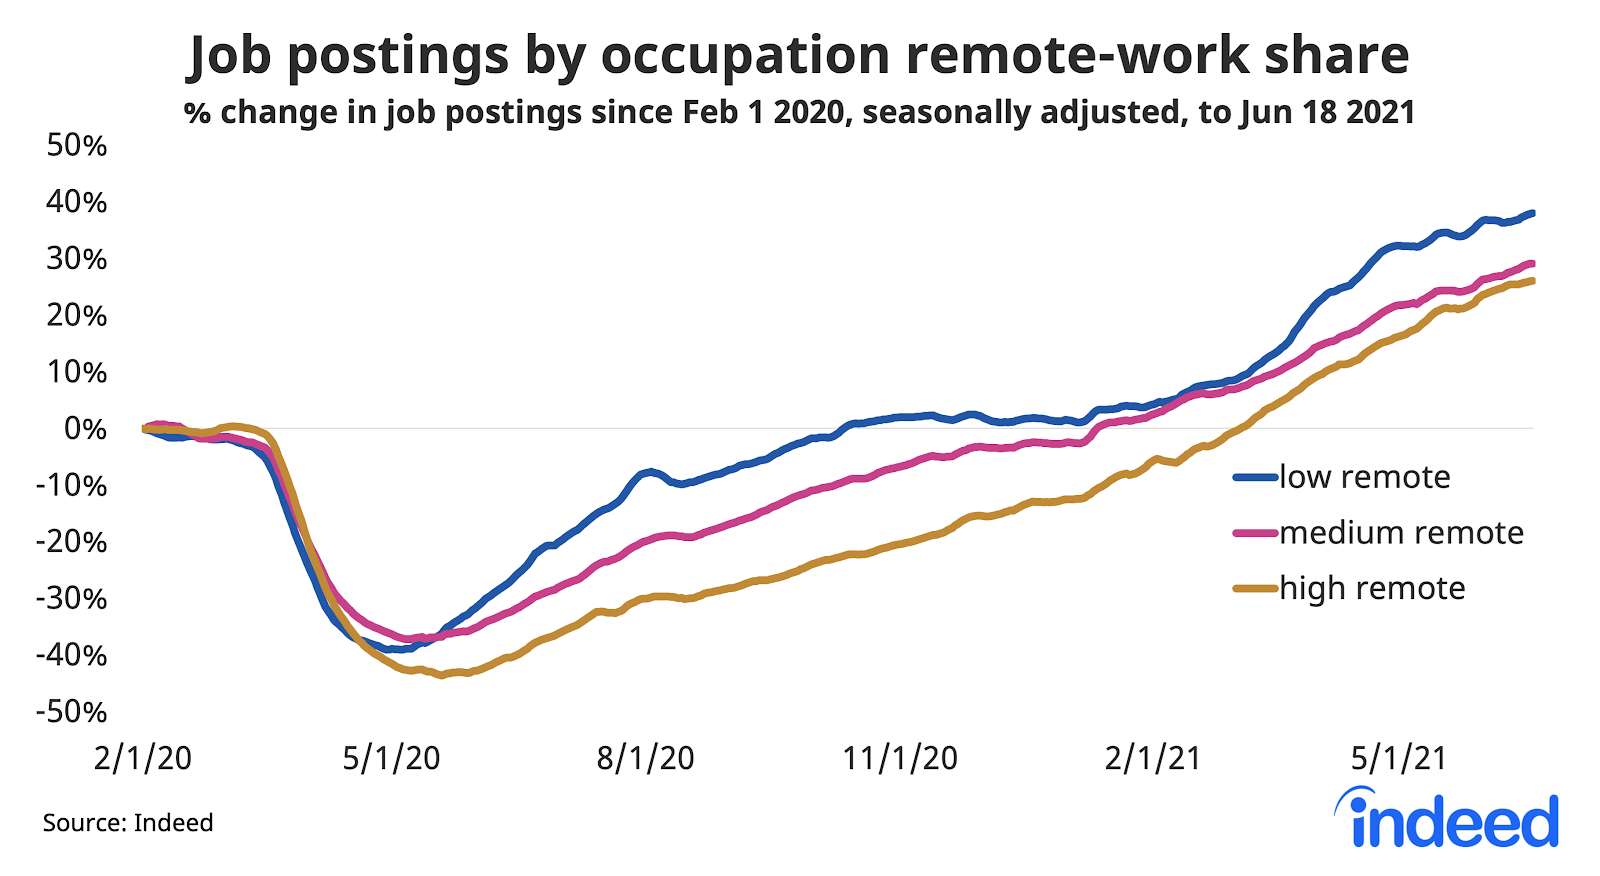
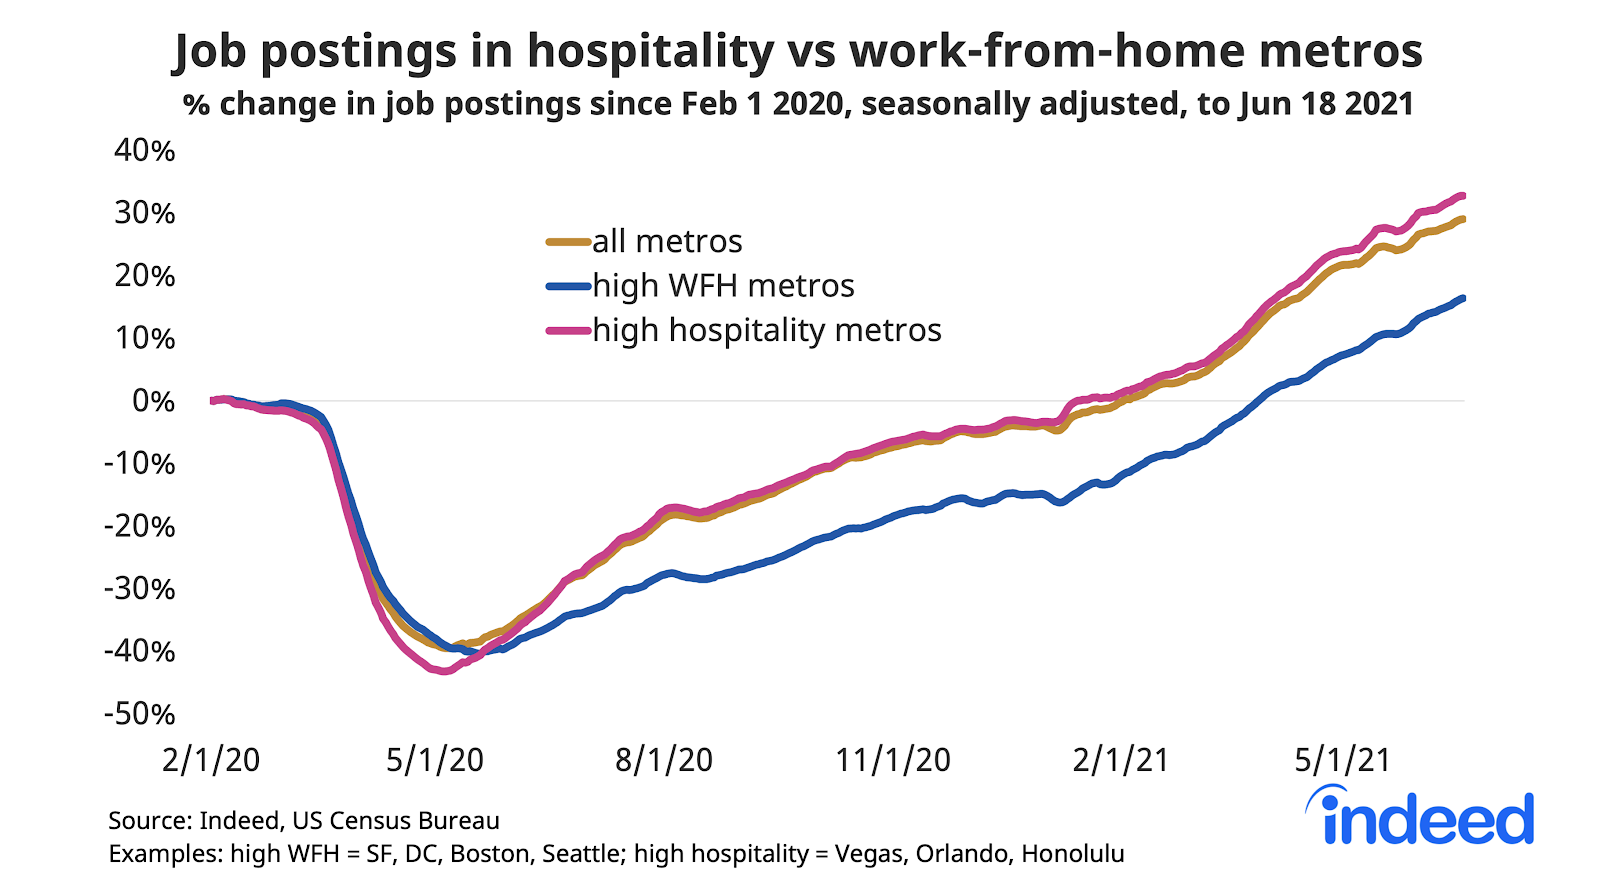
Postings for work that can’t be done from home recovered first and strongest. The shift to remote work in the pandemic created jobs in sectors that supported the stay-at-home economy, like driving and warehouse jobs, that aren’t themselves work-from-home jobs. But job postings in high-remote sectors have recovered, too.
Metros where job postings have recovered more slowly
Within the US, job postings are back up above the pre-pandemic baseline in all large metros. Job postings have recovered least in the San Francisco Bay Area and metro Washington DC.
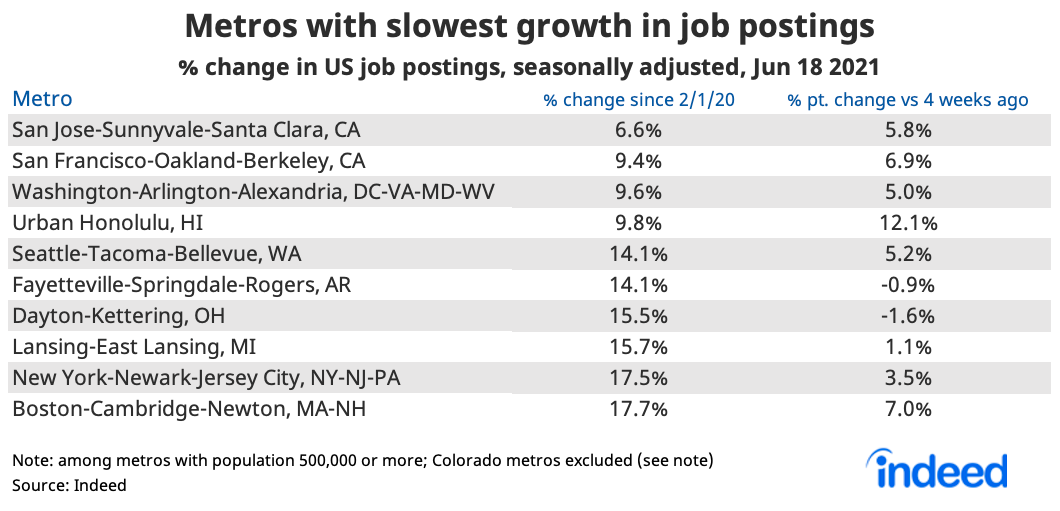
Job postings fell more initially in travel and tourism destinations. But job postings have rebounded more slowly in metros where a higher share of jobs can be done from home. In high work-from-home metros, postings in retail, restaurant, and personal-services jobs suffered. Postings in these metros finally rose above the pre-pandemic baseline at the end of March.
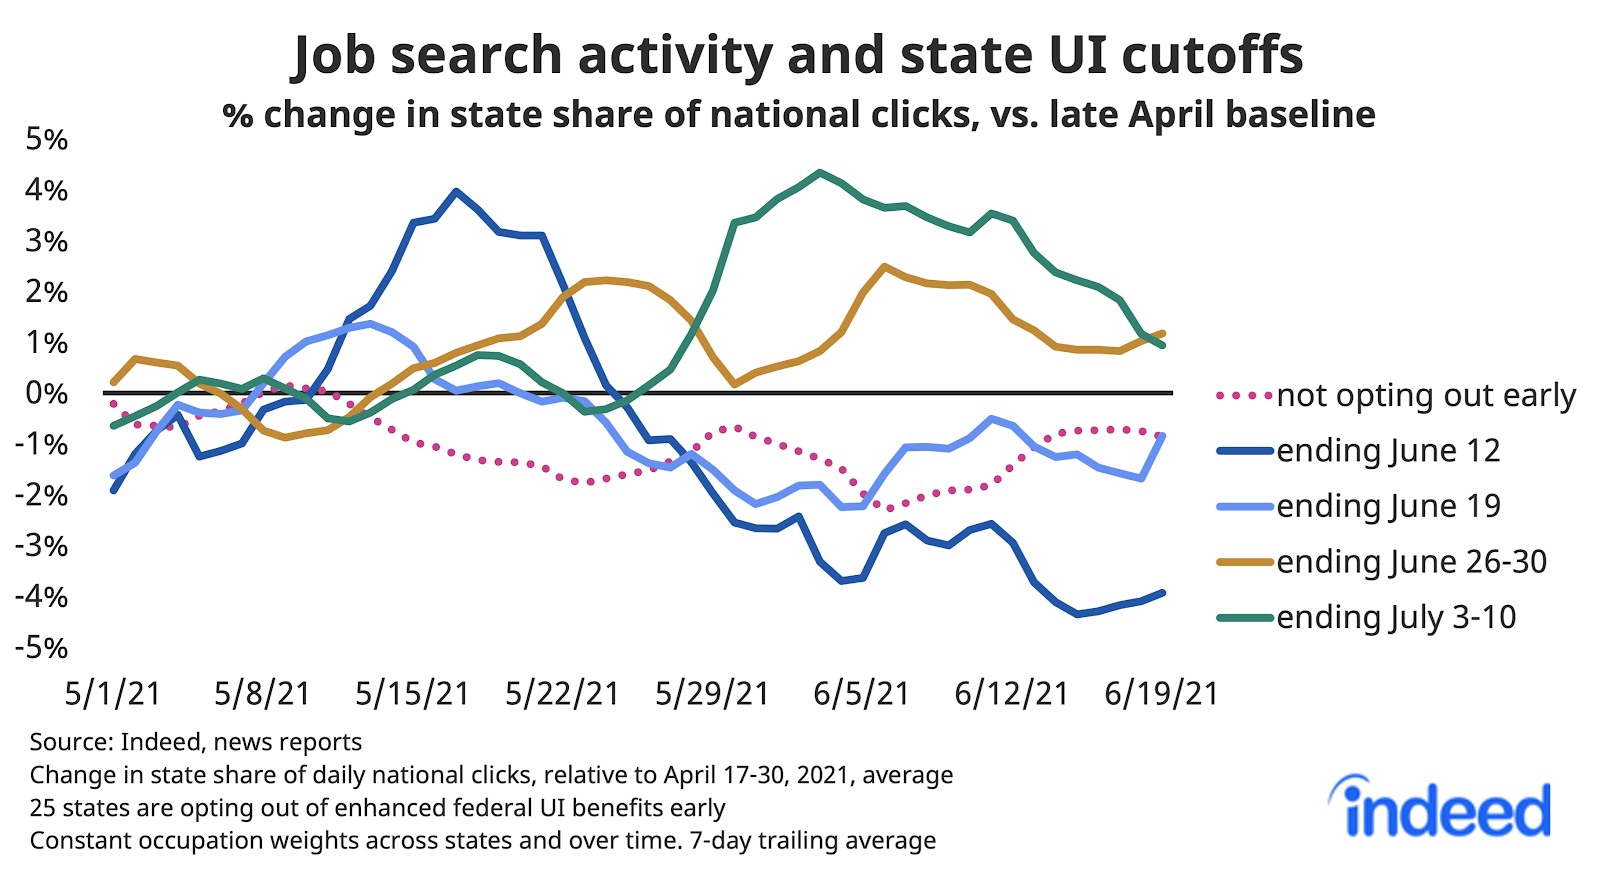
Job search in states opting out of federal UI benefits early
Search activity is up in some states that are opting out early of federal unemployment insurance benefits and down in others. Four states ended enhanced federal UI benefits on June 12, and eight more states ended them on June 19, months ahead of the official expiration on September 6. The share of national job search activity in these states, measured by clicks on job postings, is below the late April baseline.
Search activity is a bit above the national trend in the thirteen additional states opting out of enhanced federal benefits in late June and early July.
It is unclear why search activity is below the baseline in states where federal UI benefits have ended. If overly generous federal UI benefits were holding back job seekers, then we would expect search activity to increase, relative to the national trend, in states where those benefits have ended.
Earlier, job search activity rose, relative to the national trend, in states that announced they’ll prematurely end federal unemployment insurance benefits just after the announcements. This relative increase in job search activity was modest, brief, and across many occupational sectors.
We host the underlying job-postings chart data on Github as downloadable CSV files. Typically, it will be updated with the latest data one day after this blog post was published.
Methodology
All figures in this blogpost are the percentage change in seasonally-adjusted job postings since February 1, 2020, using a seven-day trailing average. February 1, 2020, is our pre-pandemic baseline. We seasonally adjust each series based on historical patterns in 2017, 2018, and 2019. Each series, including the national trend, occupational sectors, and sub-national geographies, is seasonally adjusted separately. We adopted this new methodology in January 2021.
Indeed no longer allows Colorado jobs that ask the candidate to disclose their previous salaries. This has a meaningful effect on our postings in the state of Colorado and its metros, though not on our national totals.
The number of job postings on Indeed.com, whether related to paid or unpaid job solicitations, is not indicative of potential revenue or earnings of Indeed, which comprises a significant percentage of the HR Technology segment of its parent company, Recruit Holdings Co., Ltd. Job posting numbers are provided for information purposes only and should not be viewed as an indicator of performance of Indeed or Recruit. Please refer to the Recruit Holdings investor relations website and regulatory filings in Japan for more detailed information on revenue generation by Recruit’s HR Technology segment.