
We regularly update this report to track the pandemic’s effects on the labor market. Our methodology changed at the start of 2021, as explained in the methodology note at the end of the post.
Job postings on Indeed are a real-time measure of labor market activity. On April 9, 2021, they were 17.9% above February 1, 2020, the pre-pandemic baseline, after adjusting for seasonal variation. That’s a modest 1.5 percentage point gain over last week, the smallest increase in several weeks.
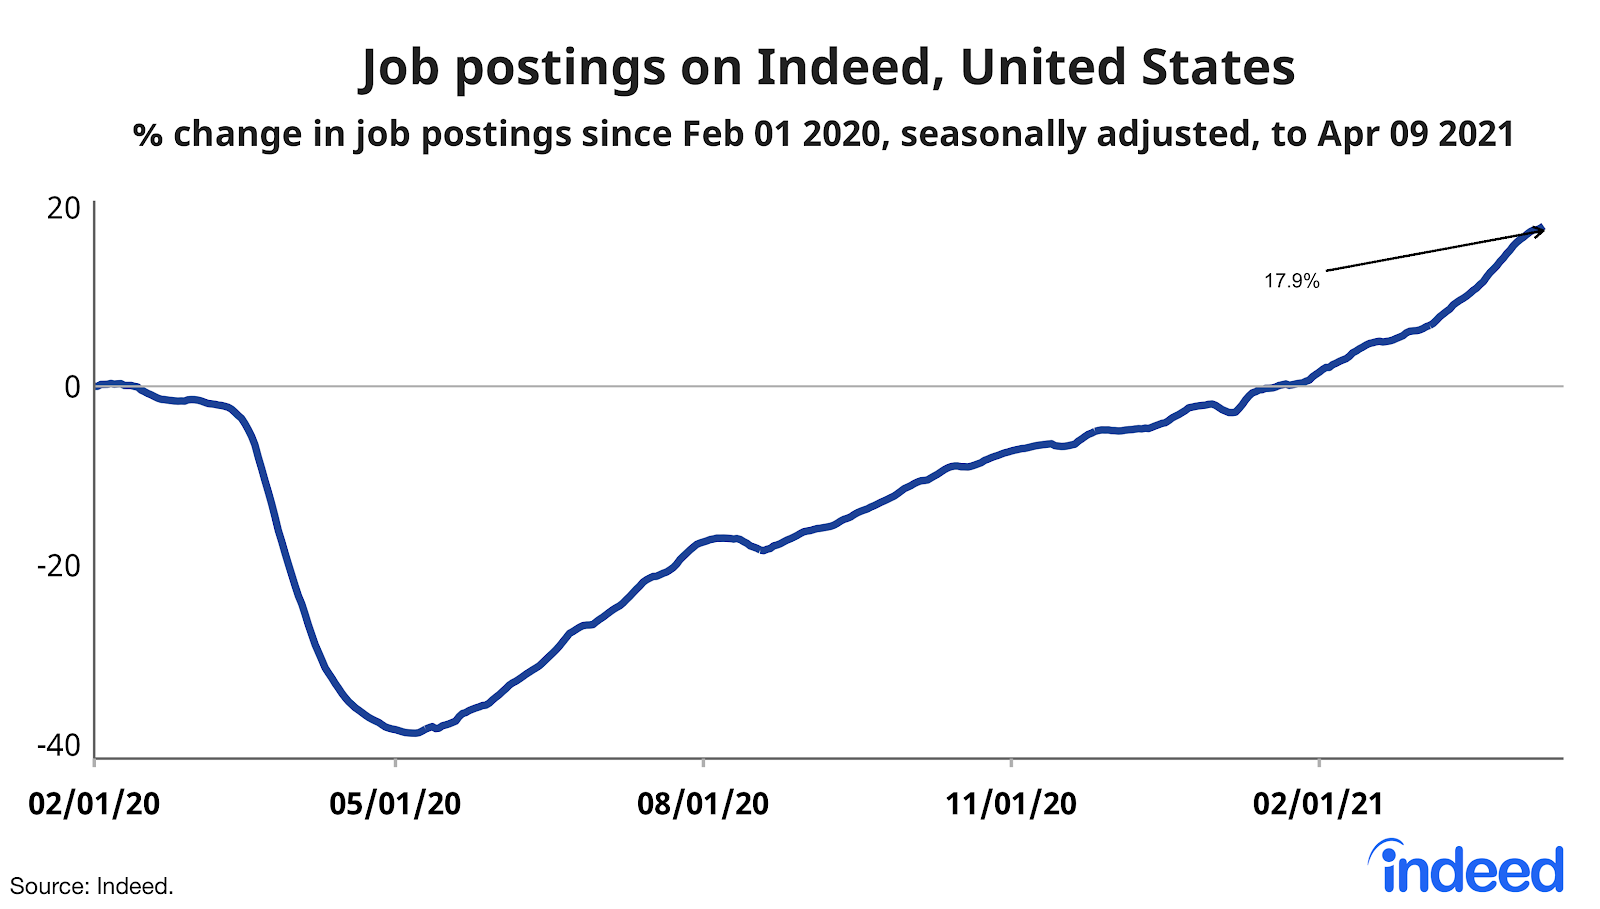
Job postings plunged in March and April 2020 to a low of 39% below the February 1, 2020, baseline. Job postings returned to the baseline on January 20, 2021, but that does not mean the labor market has fully recovered. Other measures of labor market health, like payroll employment and the headline unemployment rate, remain substantially worse than pre-pandemic. For employment to recover completely, job postings will have to remain above the pre-pandemic baseline for an extended time. Finally, in some sectors and metros, job postings are far below the pre-pandemic baseline.
Big rebound in jobs that make & move stuff, but hospitality lags
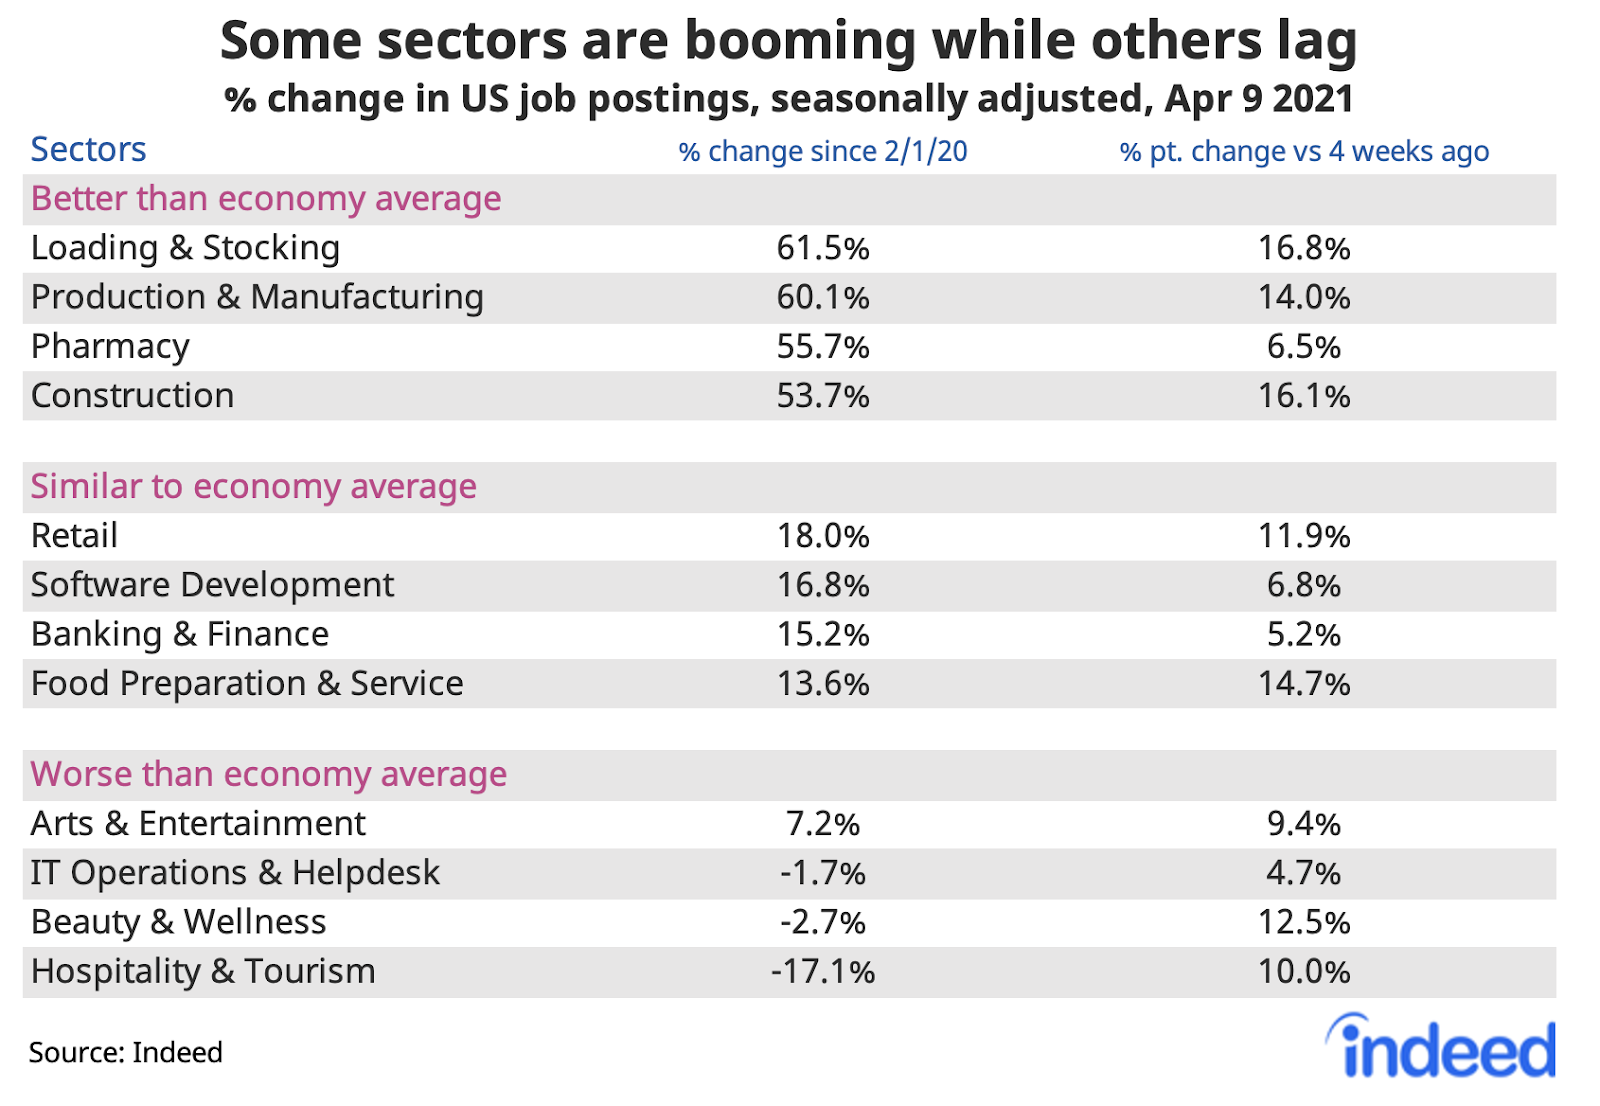
Job postings in nearly all sectors are above the pre-pandemic baseline. Pharmacy postings have increased considerably as vaccines roll out. Nursing and medical-technician jobs are also well above the pre-pandemic baseline. So are jobs in goods-related sectors like loading & stocking, construction, and manufacturing.
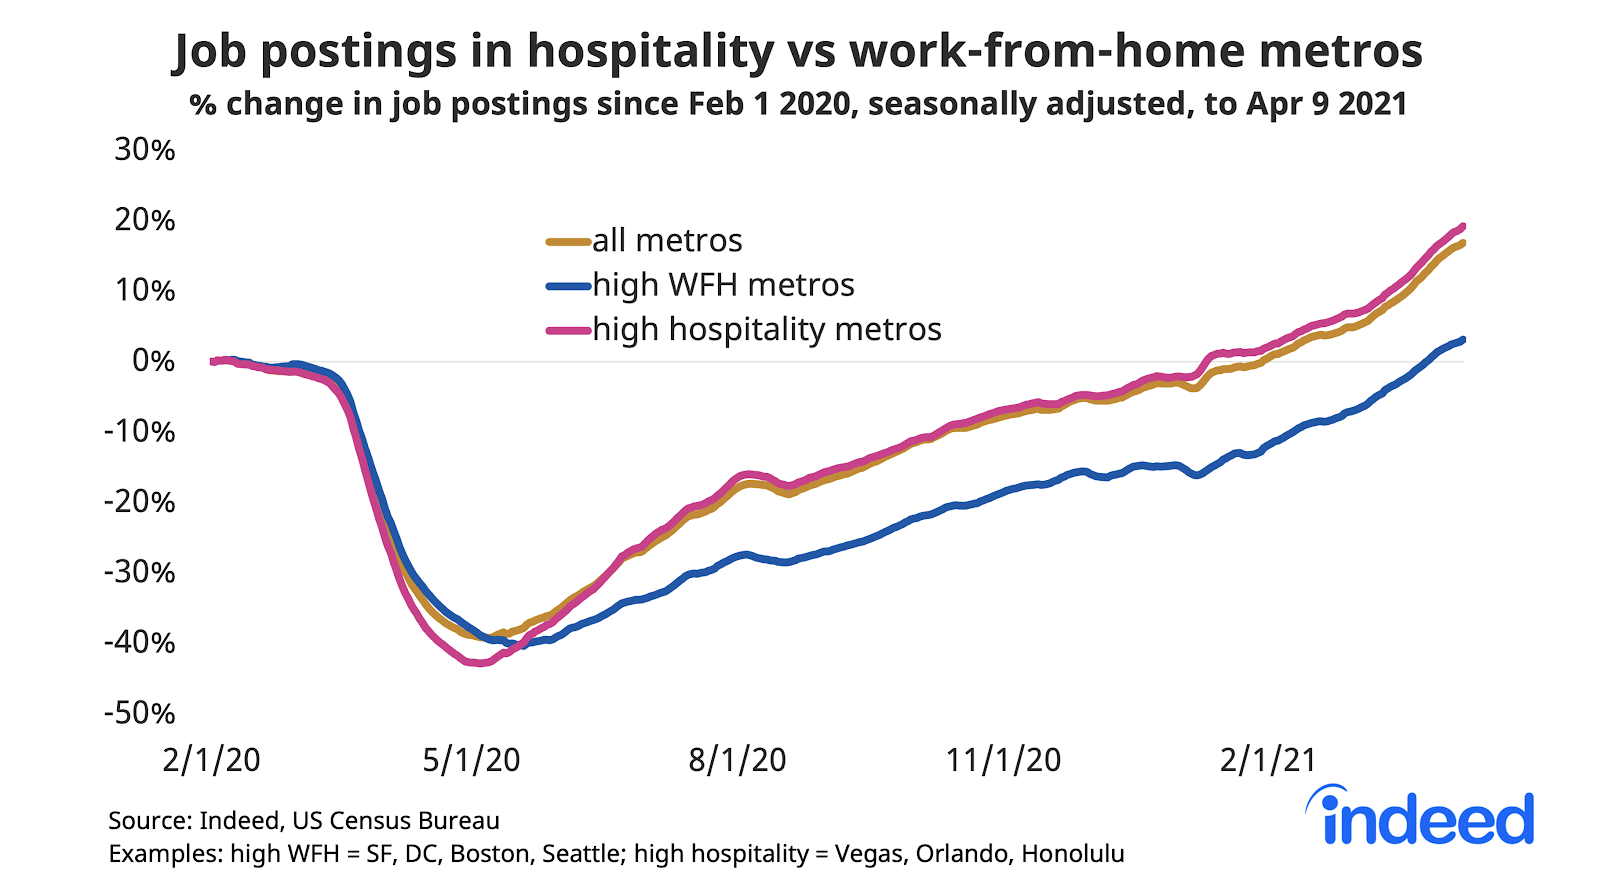
The big laggard remains hospitality & tourism postings, which are 17% below the February 1, 2020, baseline but have improved recently.
Jobs in work-from-home sectors catching up
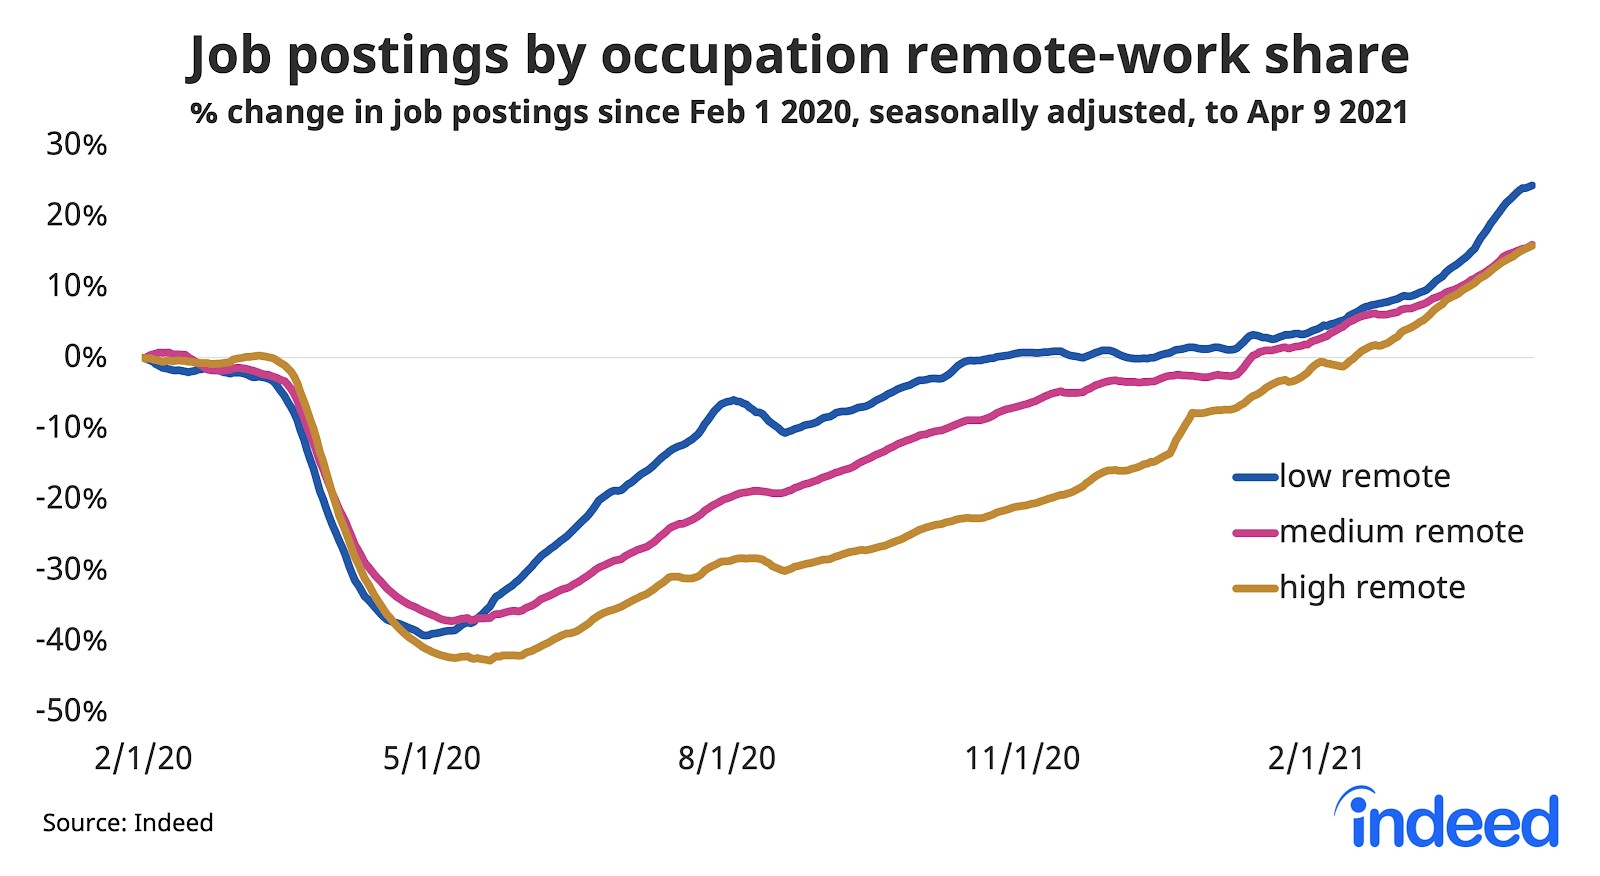
Postings for work that can’t be done from home recovered first and strongest. The shift to remote work in the pandemic created jobs in sectors that support the stay-at-home economy, like driving and warehouse jobs, that aren’t themselves work-from-home jobs. However, in recent months job postings in high remote-work sectors, like finance and tech, have picked up — a sign of longer-term economic confidence.
In the past few weeks, postings in low work-from-home sectors like food prep and beauty & wellness accelerated as more people get vaccinated and visit in-person businesses.
Metros where job postings have recovered more slowly
Within the US, job postings are down most in metro Honolulu, San Jose, and San Francisco. But job postings have improved in nearly all regions of the country. Only five of the 110 metros with at least half a million people remain below the pre-pandemic baseline.
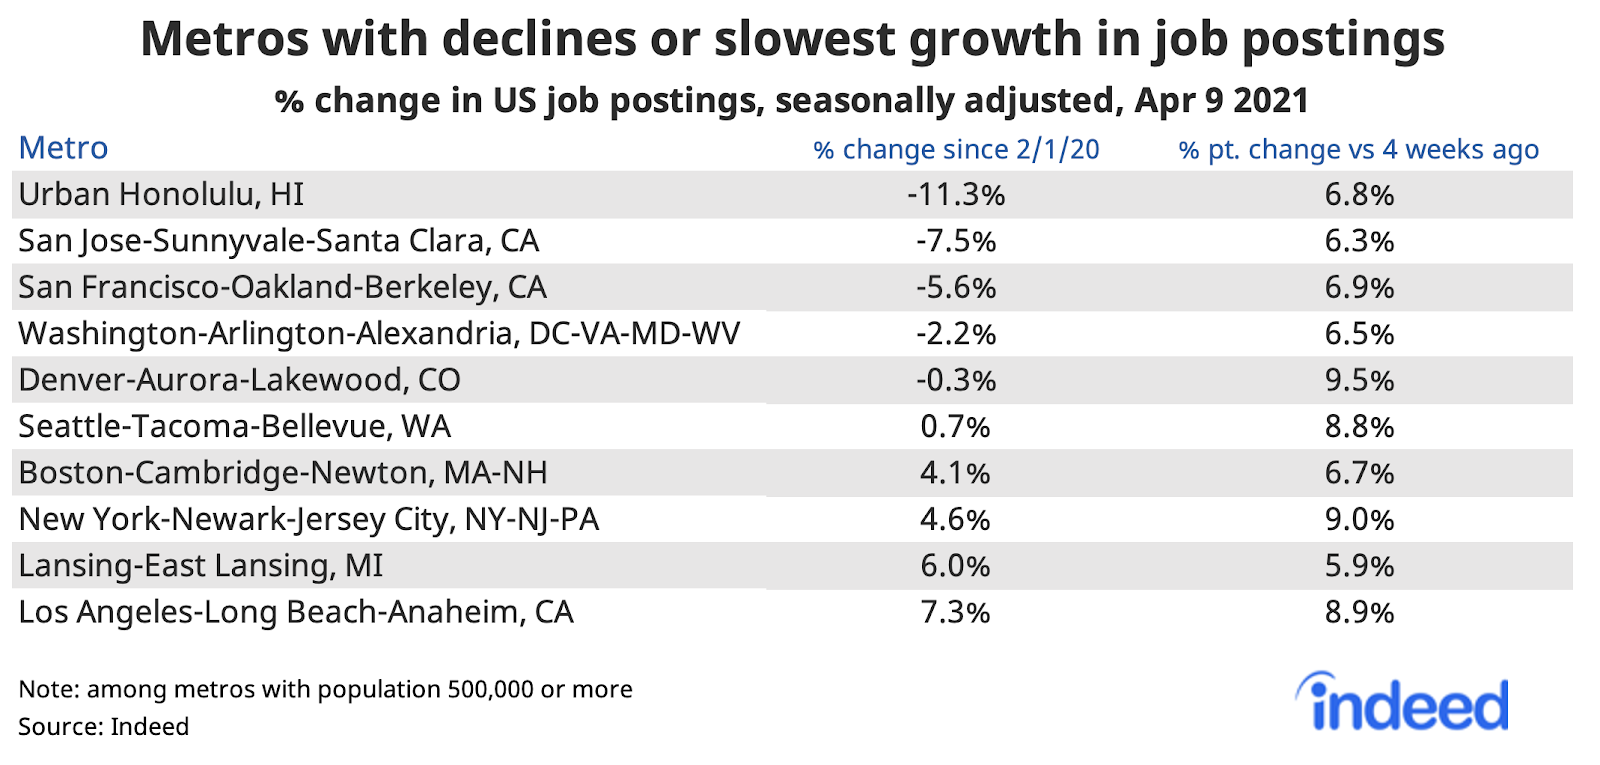
Job postings fell more initially in travel and tourism destinations. But job postings have rebounded more slowly in metros where a higher share of jobs can be done from home. In high work-from-home metros, postings in retail, restaurant, and personal-services jobs suffered. Postings in these metros finally rose above the pre-pandemic baseline at the end of March.
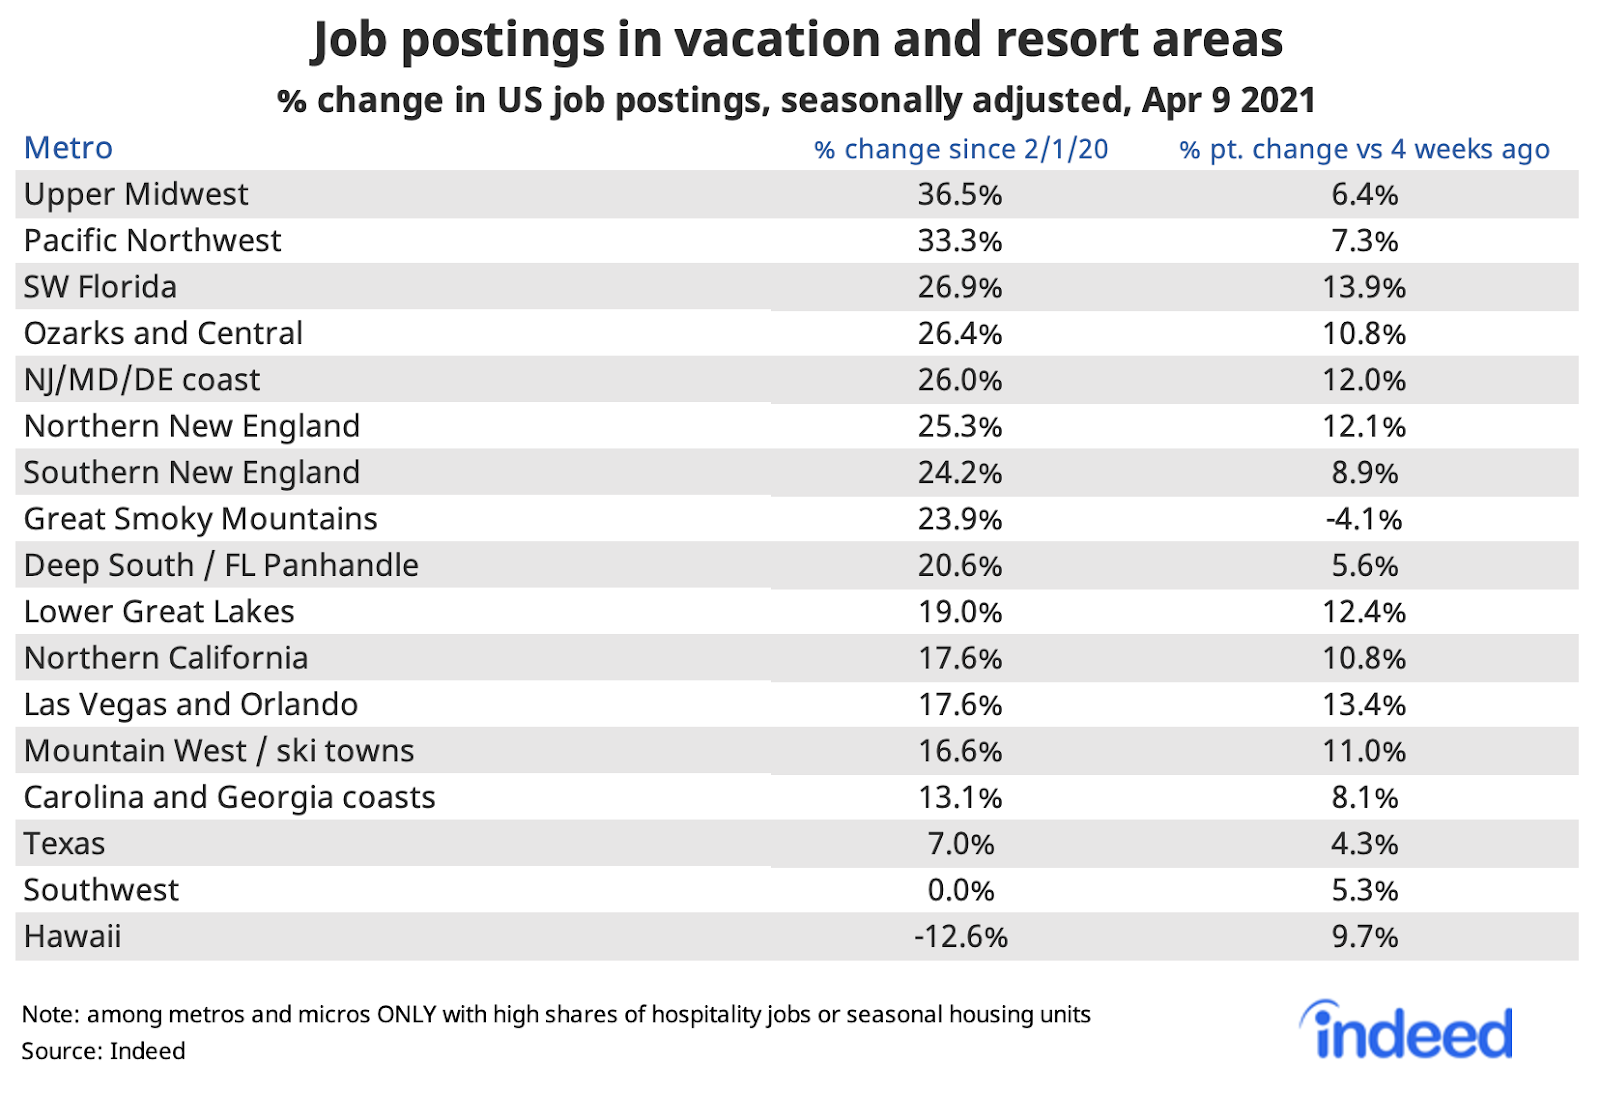
Job postings rising in vacation areas
Job postings are above the pre-pandemic baseline and rising in nearly all vacation and resort areas. As summer approaches and vaccinations continue, people are eager to travel. Vacation areas that are driving distance for regional visitors have recovered faster than places people fly to. Job postings are far above the pre-pandemic baseline in parts of Michigan’s Upper Peninsula and other vacation areas in Michigan, Wisconsin, and Minnesota. Same with several coastal towns near the Oregon-California border. Hawaii job postings, however, remain below the baseline.
We host the underlying chart data on Github as downloadable CSV files. Typically, it will be updated with the latest data one day after this blog post was published.
Methodology
All figures in this blogpost are the percentage change in seasonally-adjusted job postings since February 1, 2020, using a seven-day trailing average. February 1, 2020, is our pre-pandemic baseline. We seasonally adjust each series based on historical patterns in 2017, 2018, and 2019. Each series, including the national trend, occupational sectors, and sub-national geographies, is seasonally adjusted separately. We adopted this new methodology in January 2021 and now use it to report all historical data. Historical numbers have been revised and may differ significantly from originally reported values.
The number of job postings on Indeed.com, whether related to paid or unpaid job solicitations, is not indicative of potential revenue or earnings of Indeed, which comprises a significant percentage of the HR Technology segment of its parent company, Recruit Holdings Co., Ltd. Job posting numbers are provided for information purposes only and should not be viewed as an indicator of performance of Indeed or Recruit. Please refer to the Recruit Holdings investor relations website and regulatory filings in Japan for more detailed information on revenue generation by Recruit’s HR Technology segment.