
We regularly update this report to track the pandemic’s effects on the labor market. Our methodology changed at the start of 2021, as explained in the methodology note at the end of the post.
Job postings on Indeed are a real-time measure of labor market activity. On January 29, 2021, they were 0.7% above February 1, 2020, the pre-pandemic baseline, after adjusting for seasonal variation. That’s a very slight gain from a week earlier, when postings were 0.3% above the baseline.
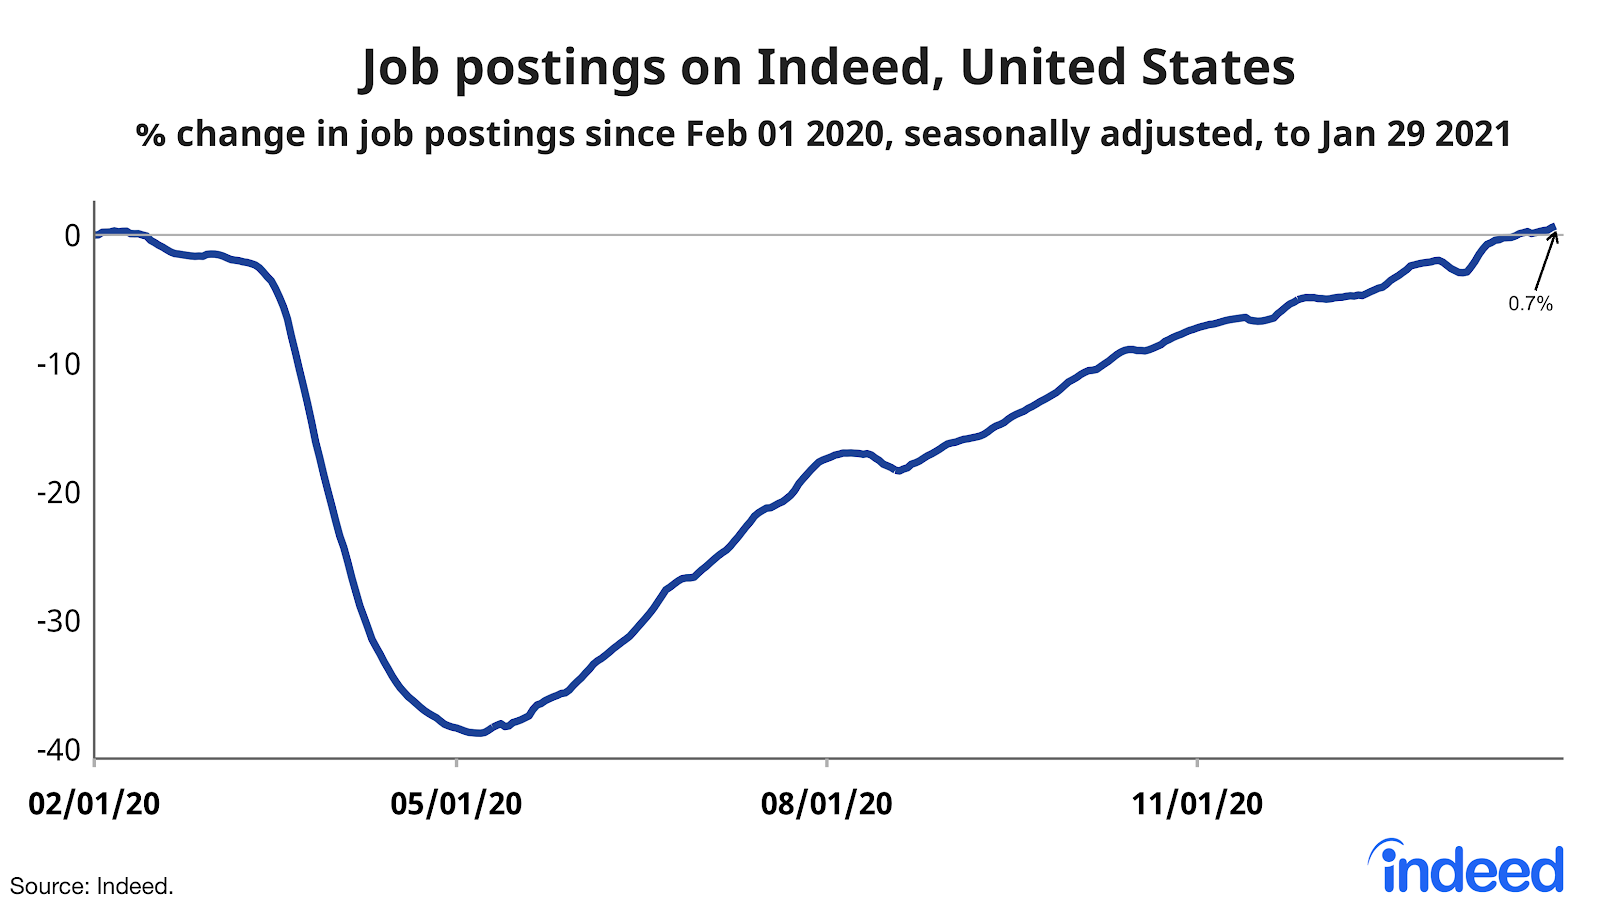
Job postings plunged from mid-March to early May 2020 to a low of 39% below the February 1, 2020, baseline. Postings rebounded in May, June, and July by an average of 1.6 percentage points per week. Starting in August, improvement slowed to an average of 0.7 percentage points per week.
Returning to the February 1, 2020, baseline does not mean the labor market has fully recovered. From February 1, 2019, to February 1, 2020, US job postings increased 9%, so returning to the baseline represents slower growth than before the pandemic. Moreover, other measures of labor market health, like payroll employment and the headline unemployment rate, remain substantially worse than pre-pandemic. For employment to recover completely, job postings will have to remain above the pre-pandemic baseline for an extended time. Finally, in some sectors and metros, job postings are far below the pre-pandemic baseline.
Hospitality and tourism jobs have seen the biggest decline
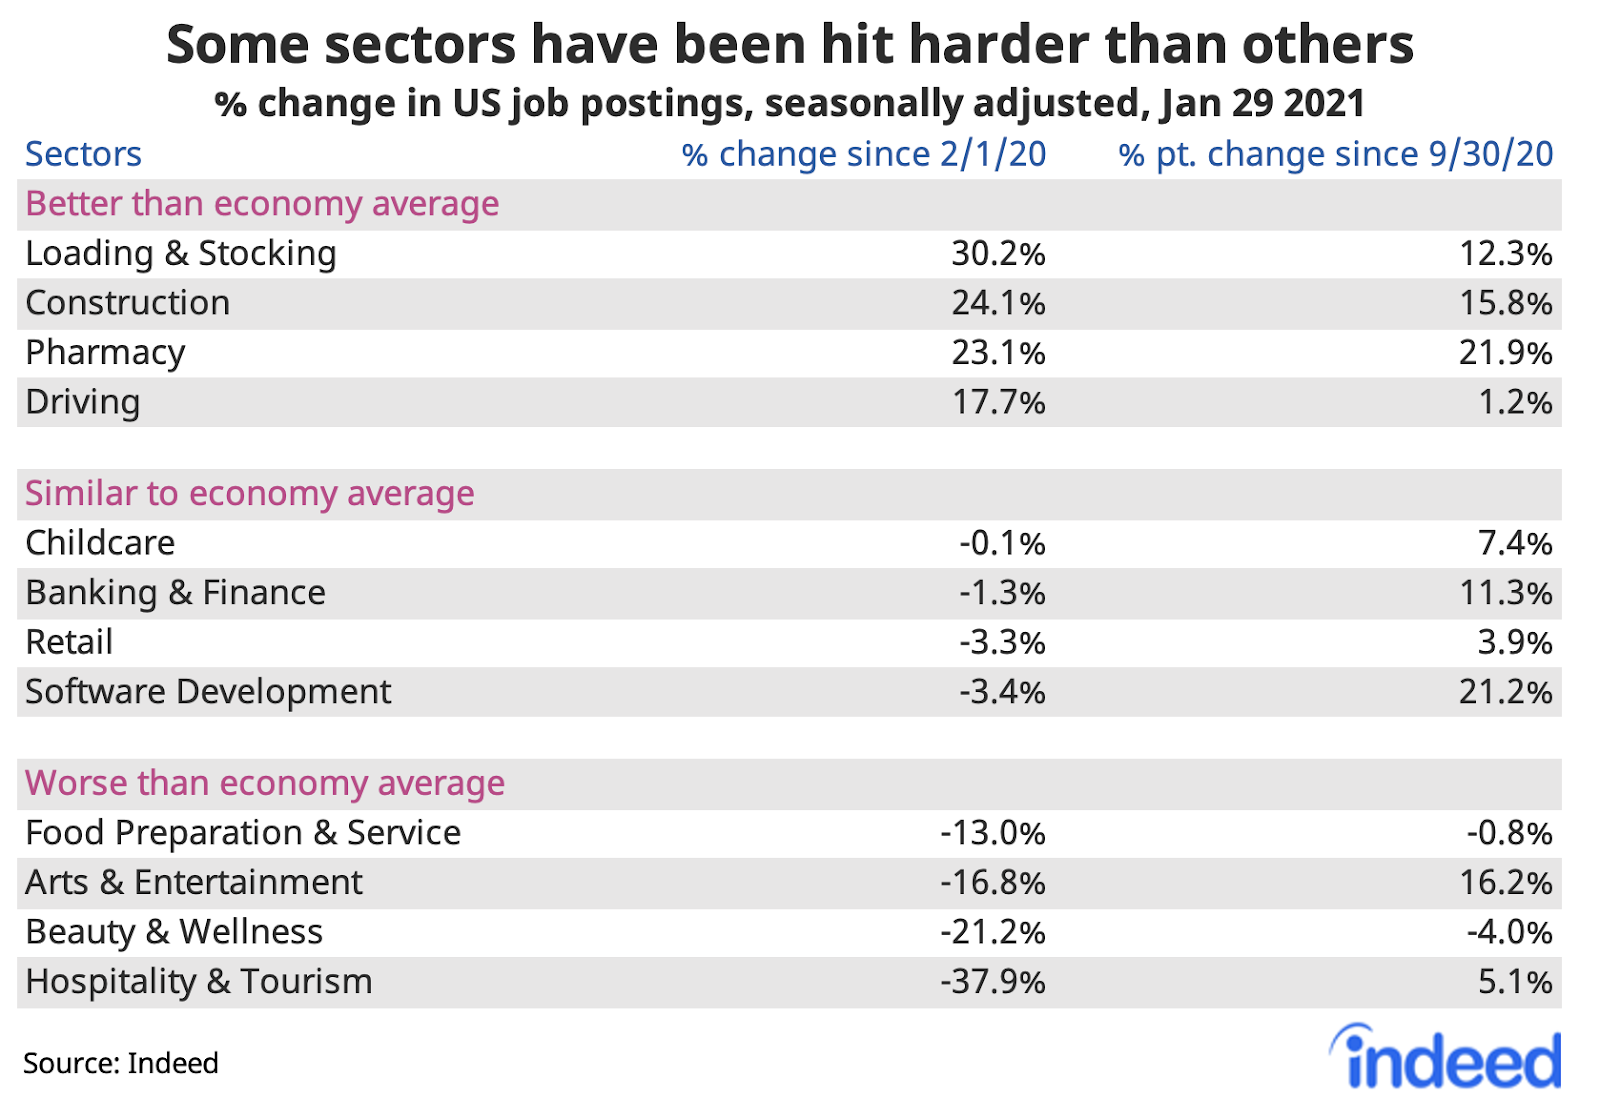
Job postings have fallen most in occupations directly affected by the coronavirus, such as hospitality & tourism, sports, and arts & entertainment. Hospitality & tourism postings are still more than 35% below the February 1, 2020, baseline and have improved little in recent months.
In several goods-related sectors, including loading & stocking, construction, driving, and manufacturing, job postings are well ahead of the baseline. Pharmacy postings have picked up substantially too, probably reflecting upbeat vaccine news.
Two sectors affected by virus surges and shutdowns — food prep and beauty & wellness — have stalled in the current COVID19 wave, which started in the fall. But job postings in two higher-wage sectors, tech and finance, continued to gain in the fall and winter as vaccine optimism and longer-term economic confidence have grown.
Metros where job postings have declined most
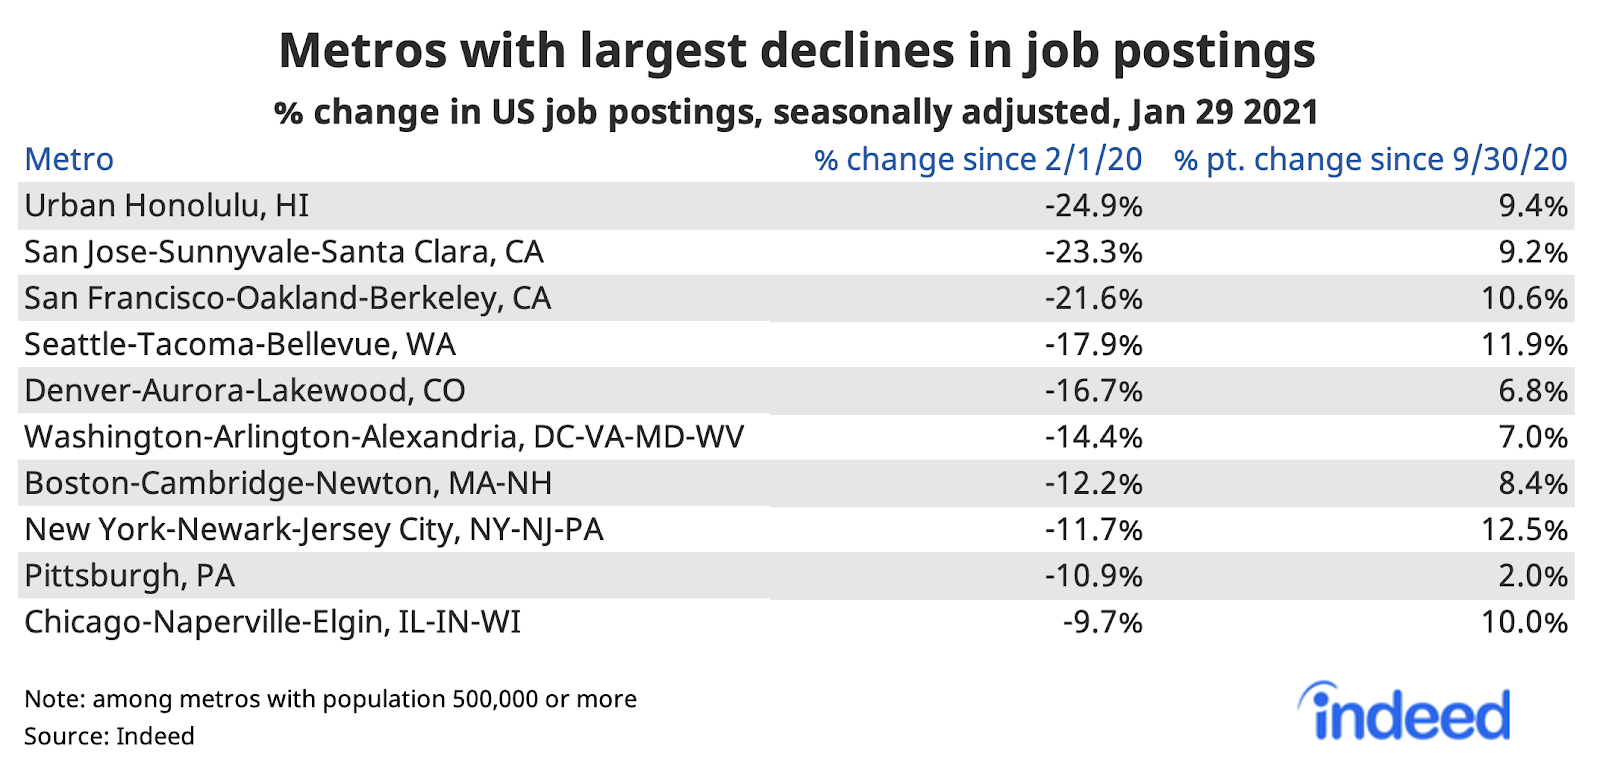
Within the US, job postings are down most in metro Honolulu, San Jose, and San Francisco. But job postings have improved significantly since the end of September in nearly all of the hardest-hit metros.
Job postings fell more initially in both large and small travel and tourism destinations, but have picked up since May in hospitality metros like Las Vegas, Miami, and Orlando. Job postings have rebounded more slowly in metros where a higher share of jobs can be done from home. In high work-from-home metros, postings in retail, restaurant, and personal-services jobs have suffered. Postings in these metros are still 13% below the pre-pandemic baseline and recovery is slow.
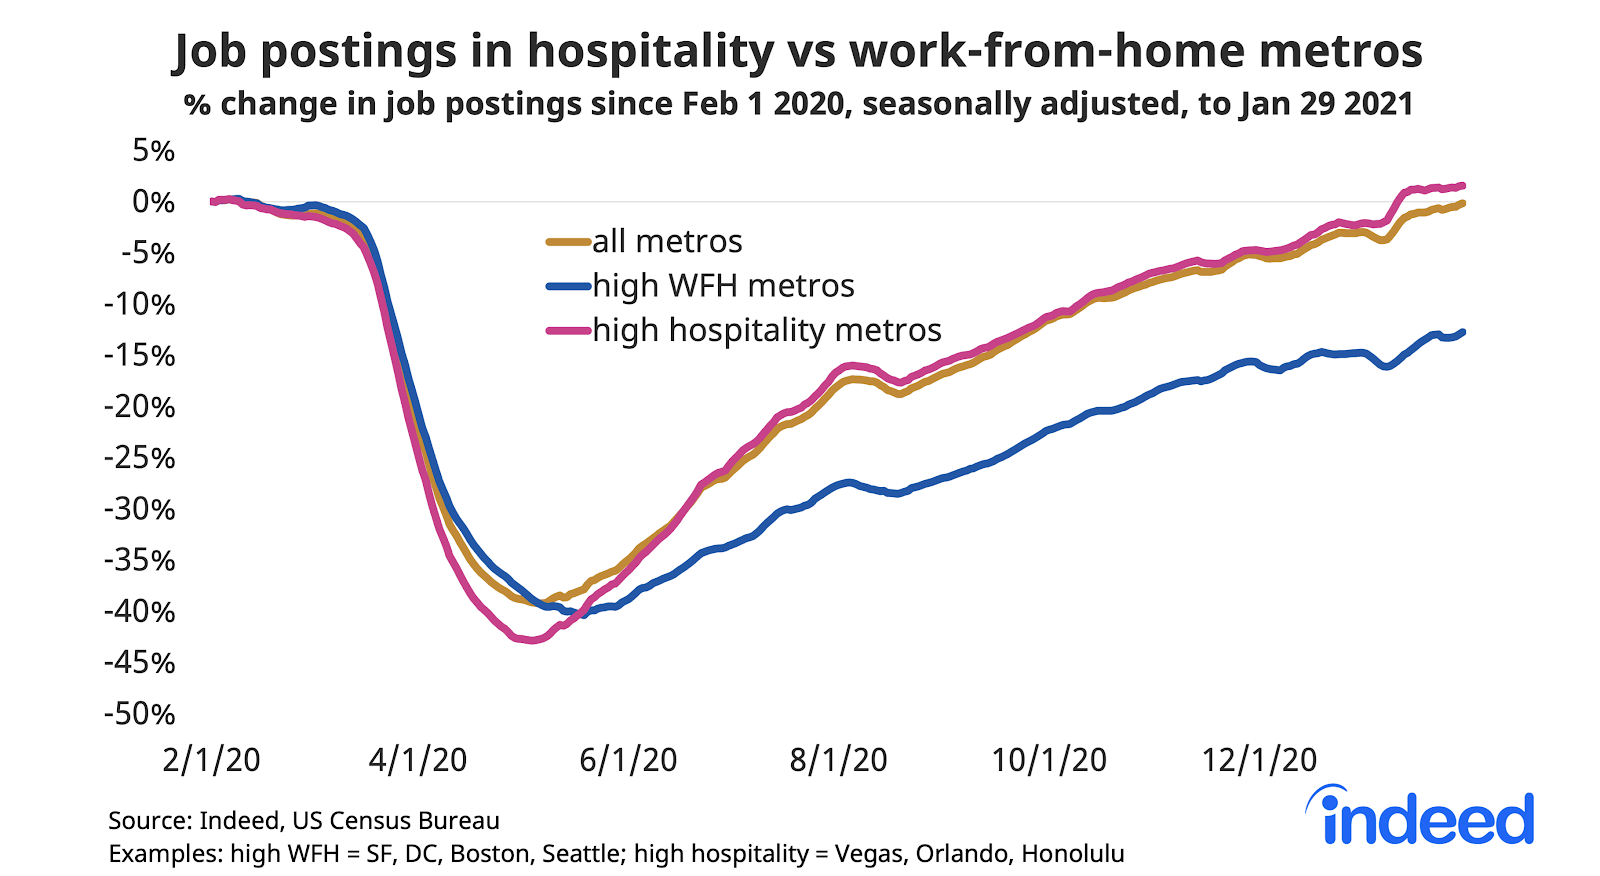
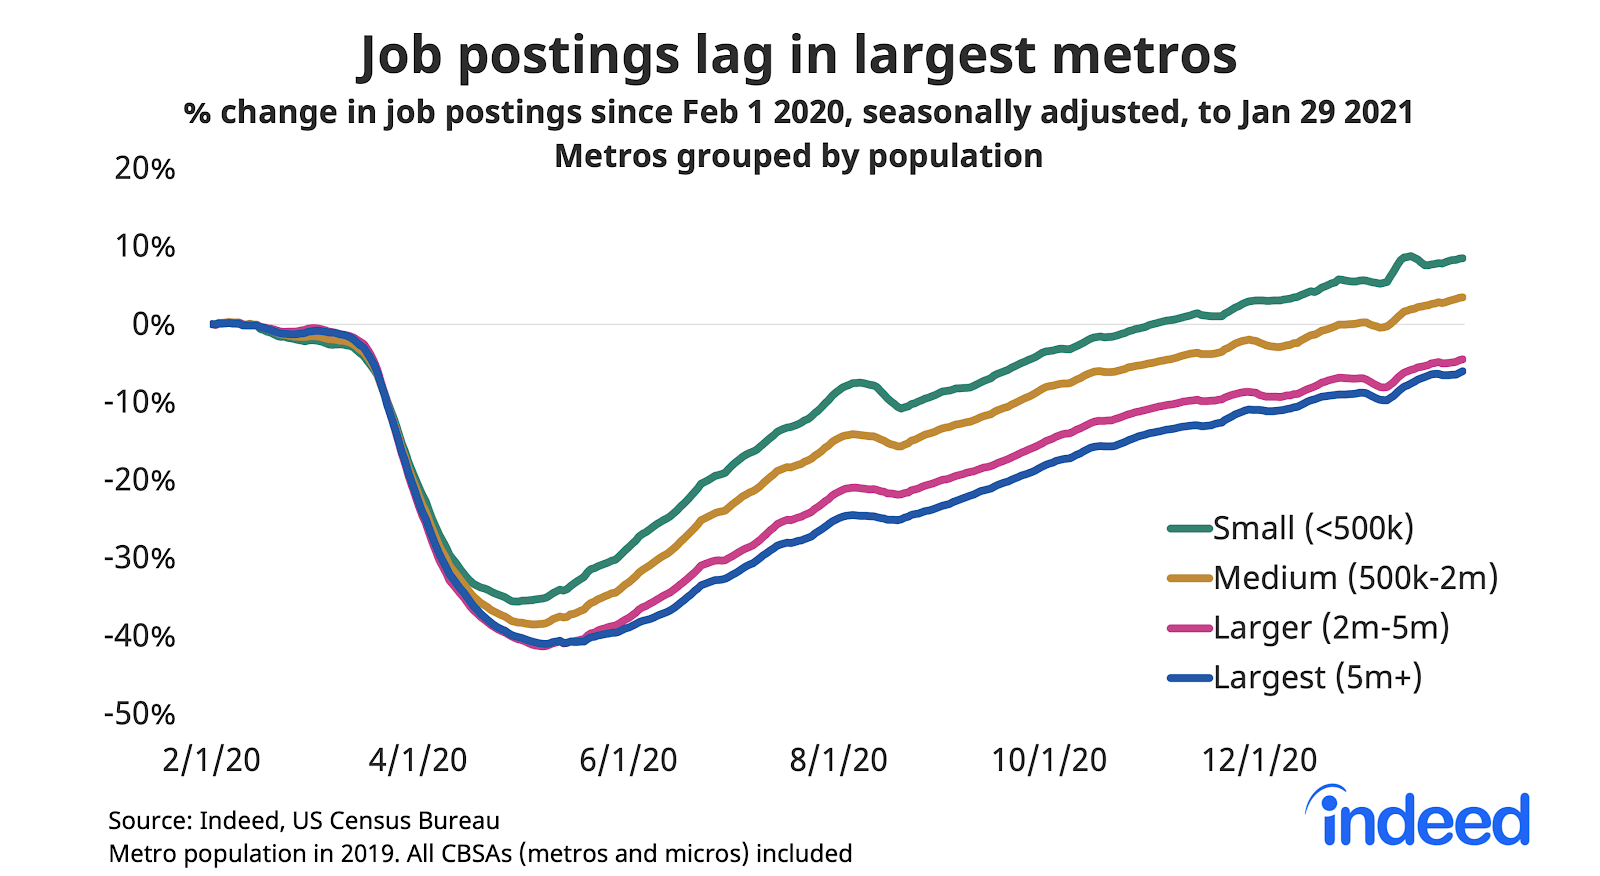
The pandemic has especially been a big-city recession. Job postings remain below baseline in larger and largest metros, but are above baseline in medium and small areas.
Methodology
All figures in this blogpost are the percentage change in seasonally-adjusted job postings since February 1, 2020, using a seven-day trailing average. February 1, 2020, is our pre-pandemic baseline. We seasonally adjust each series based on historical patterns in 2017, 2018, and 2019. Each series, including the national trend, occupational sectors, and sub-national geographies, is seasonally adjusted separately.
We adopted this new methodology in January 2021 and now use it to report all historical data. Historical numbers have been revised and may differ significantly from originally reported values. The new methodology applies a detrended seasonal adjustment factor to the percentage change in job postings. In contrast, our previous methodology used the 2019 change between February 1 and the reported date as the adjustment factor, which implicitly included both a seasonality component and the underlying trend.
For nearly all series, job postings trended upward in 2019. The new methodology no longer subtracts the underlying 2019 trend. As a result, most historical figures are higher (i.e. less negative relative to the February 1, 2020 baseline) under the new methodology than originally reported.
The number of job postings on Indeed.com, whether related to paid or unpaid job solicitations, is not indicative of potential revenue or earnings of Indeed, which comprises a significant percentage of the HR Technology segment of its parent company, Recruit Holdings Co., Ltd. Job posting numbers are provided for information purposes only and should not be viewed as an indicator of performance of Indeed or Recruit. Please refer to the Recruit Holdings investor relations website and regulatory filings in Japan for more detailed information on revenue generation by Recruit’s HR Technology segment.