
We regularly update this report to track the pandemic’s effects on the labor market. Our methodology changed at the start of 2021 — see note at end of post.
Job postings — a real-time measure of labor market activity — were 0.3% above the February 1, 2020, pre-pandemic baseline, seasonally adjusted, as of January 22, 2021. That’s a slight gain from a week earlier, when postings were 0.4% below the baseline.
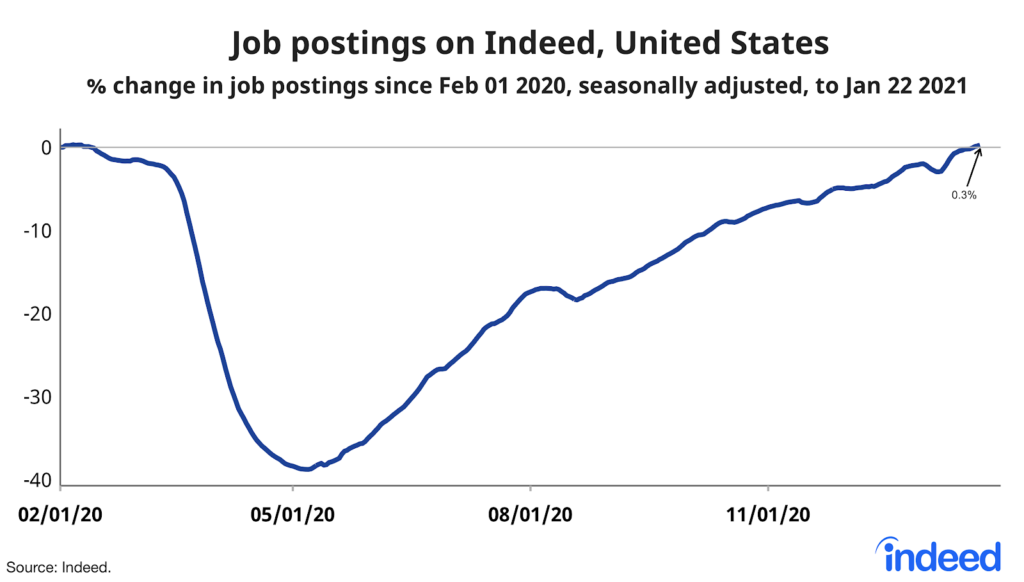
Job postings plunged from mid-March to early May 2020, to a low of 39% below the February 1, 2020 baseline. Then, postings rebounded in May, June, and July by an average of 1.6 percentage points per week. Starting in August, improvement slowed to an average of just 0.7 percentage points per week.
Returning to the February 1, 2020, baseline does not mean the labor market has recovered, however. From February 1, 2019, to February 1, 2020, US job postings increased by 9%, so returning now to the baseline means slower growth than pre-pandemic. Furthermore, other measures of labor market health, like payroll employment and the headline unemployment rate, remain substantially worse than before the pandemic. Job postings might have to remain above the pre-pandemic baseline for an extended time until employment recovers. Finally, job postings are still below the pre-pandemic baseline in many sectors and metros.
Hospitality and tourism jobs have seen the biggest decline
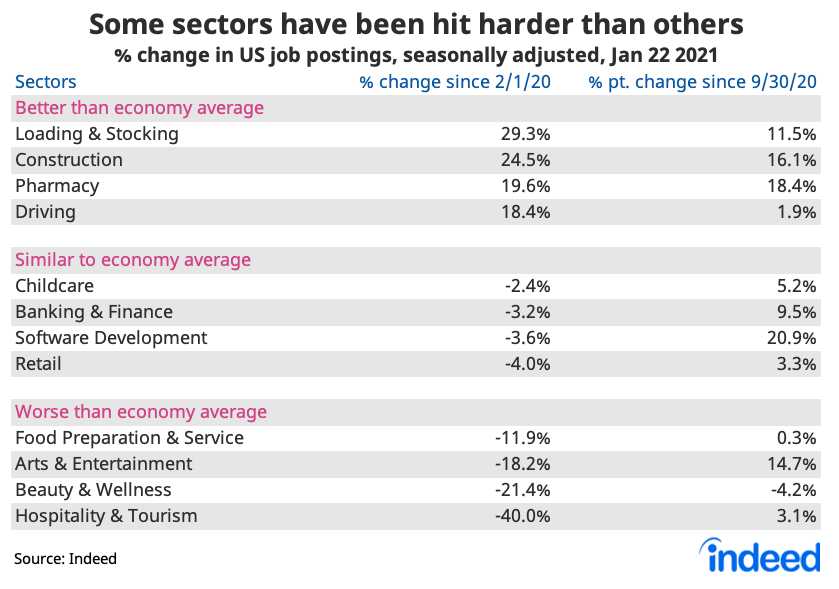
Job postings have fallen most in occupations directly affected by the coronavirus such as hospitality & tourism, sports, and arts & entertainment. Hospitality & tourism postings are still 40% below the February 1, 2020, pre-pandemic baseline, with little improvement in recent months.
In several goods-related sectors like loading & stocking, construction, driving, and manufacturing, job postings are well ahead of the baseline. Pharmacy postings have picked up, too, likely on upbeat vaccine news.
Two sectors affected by virus surges and shutdowns — food prep and beauty & wellness — have stalled in the current COVID19 wave, which started in the fall. But in two higher-wage sectors, tech and finance, job postings continued to improve in the fall and winter as vaccine optimism and longer-term economic confidence have grown.
Where job postings have declined most
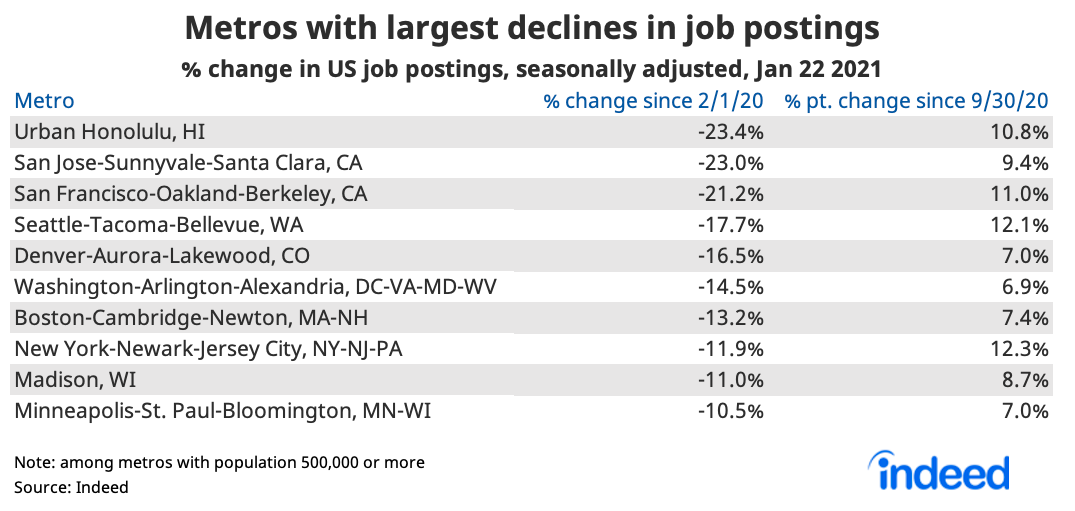
Within the US, job postings are down most in metro Honolulu, San Jose, and San Francisco. But job postings have improved significantly since the end of September in all of the hardest-hit metros.
Job postings fell more initially in travel and tourism destinations, large and small, but postings have picked up since May in hospitality metros like Las Vegas, Miami, and Orlando. Job postings have rebounded more slowly in metros where more of the jobs can be done from home. In work-from-home metros, postings in retail, restaurant, and personal-services jobs have suffered. Postings in high work-from-home metros remain 13% below the pre-pandemic baseline, with slow recovery.
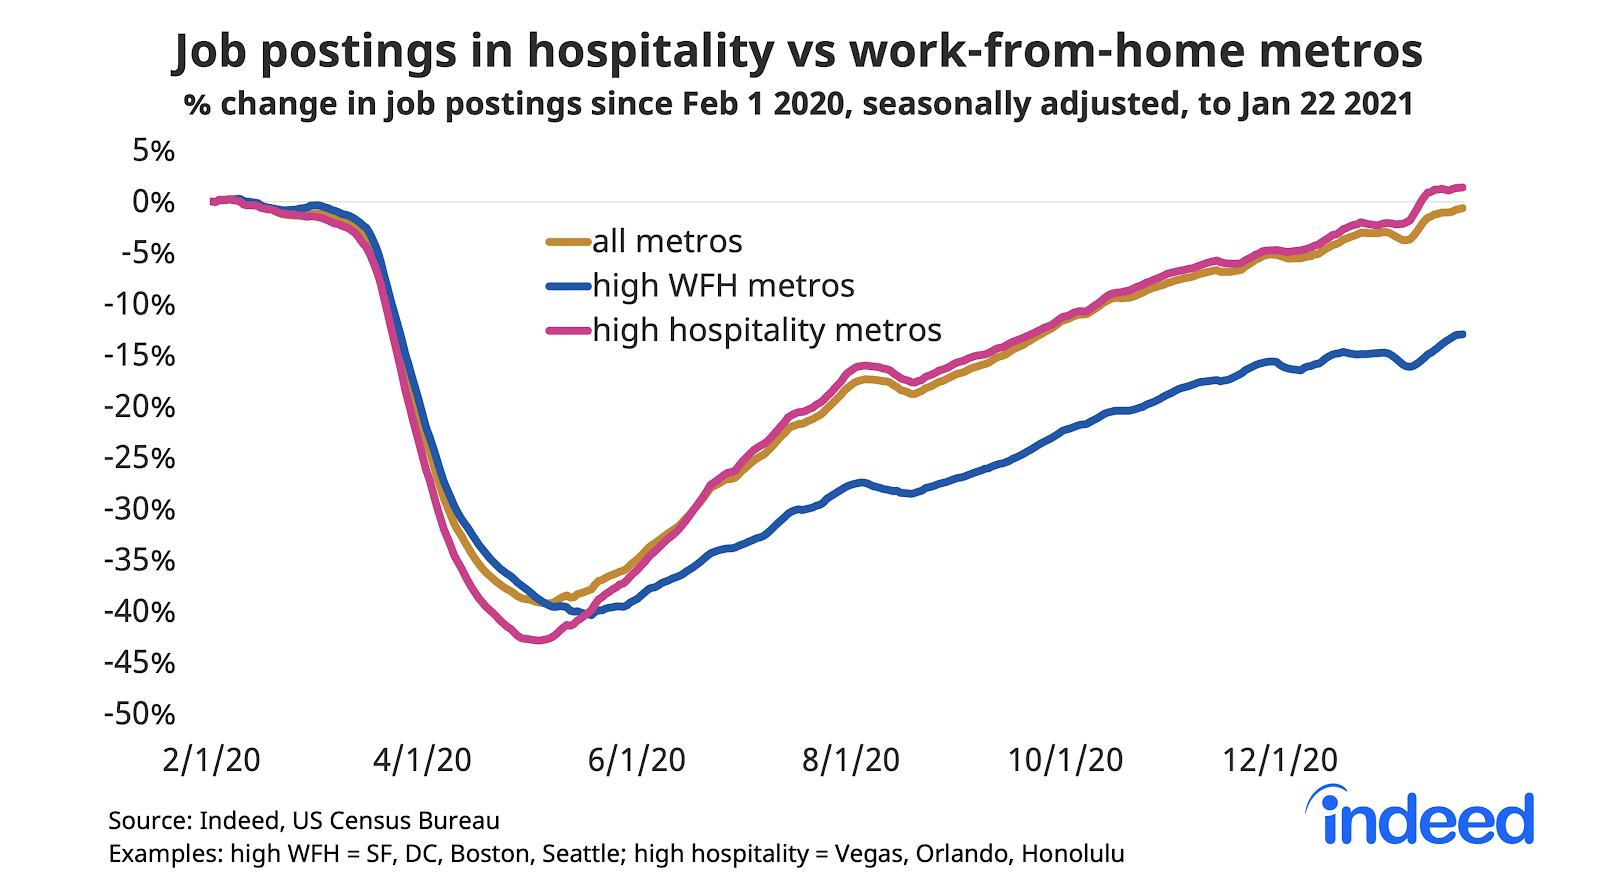
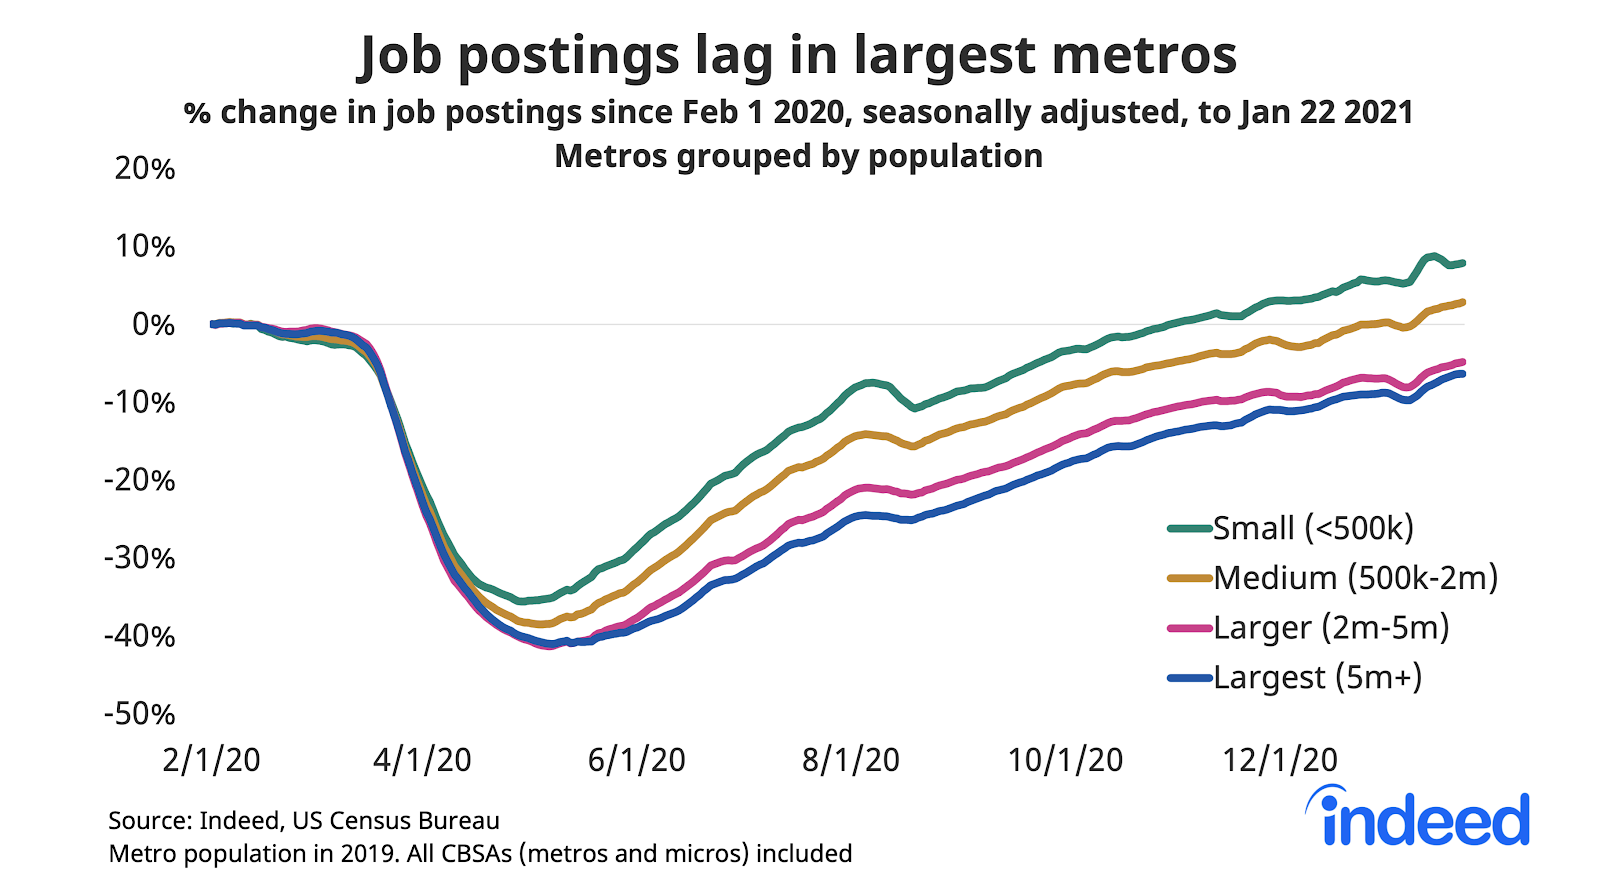
The pandemic has been a big-city recession. Job postings remain below baseline in the larger and largest metros, but are above baseline in medium and small areas.
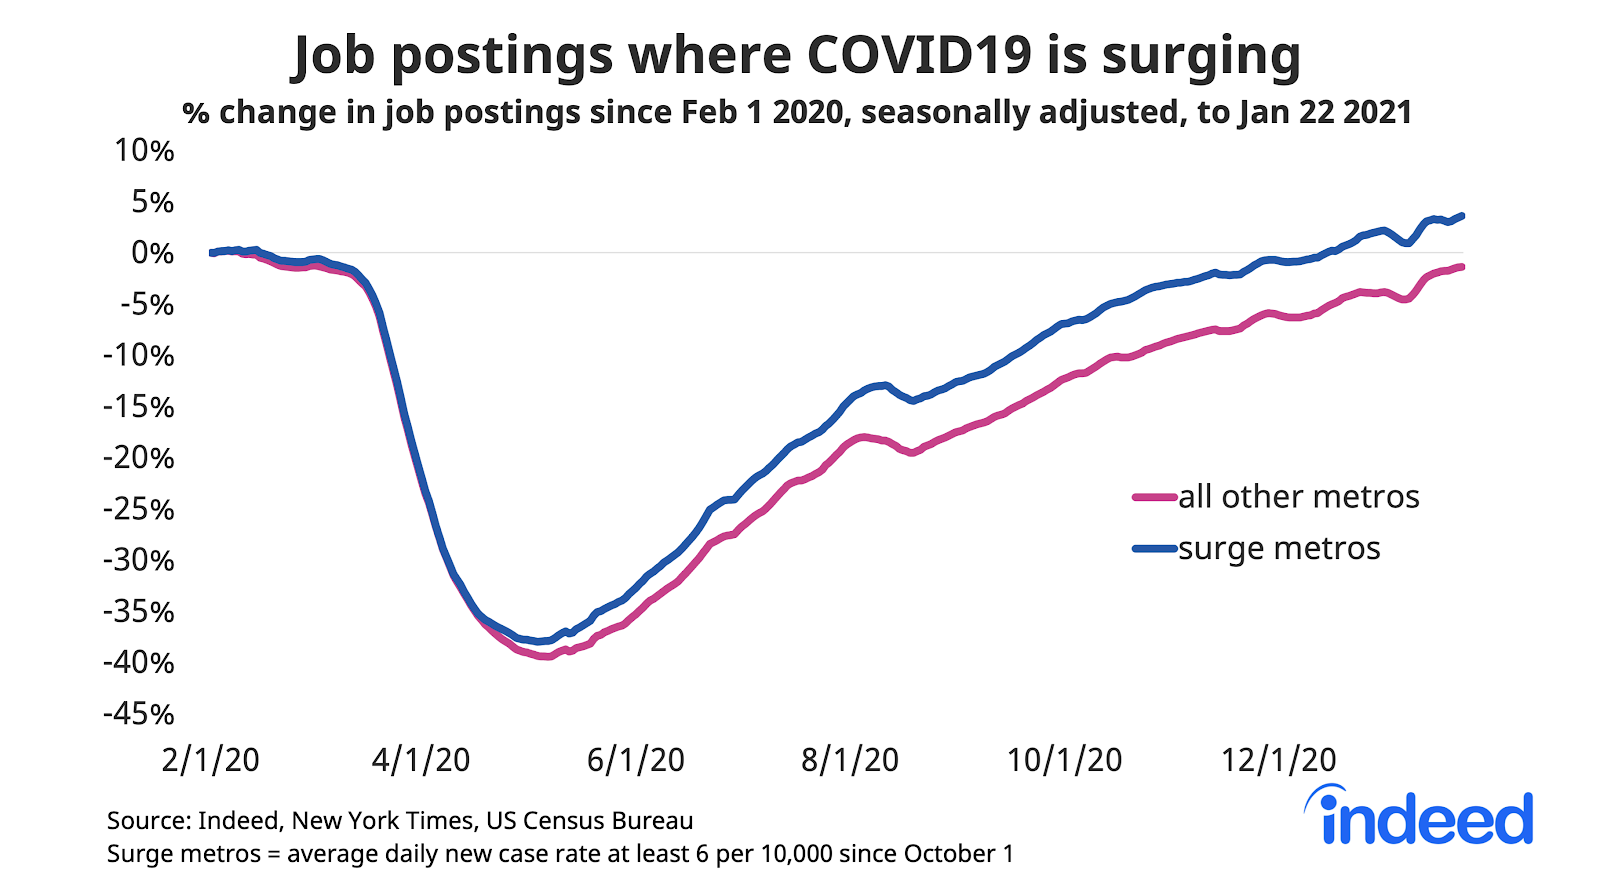
Job postings have held up even in markets where the virus is surging. In metros with the highest rate of new infections since October, job postings are 4% above the pre-pandemic baseline, and the recovery path has been similar in metros where the virus has surged and in other places.
Methodology
All figures in this blogpost are the percentage change in seasonally-adjusted job postings since February 1, 2020, using a 7-day trailing average. February 1, 2020, is our pre-pandemic baseline. We seasonally adjust each series based on historical patterns in 2017, 2018, and 2019. Each series, including the national trend, occupational sectors, and sub-national geographies, is seasonally adjusted separately.
We switched to this new methodology in January 2021 and now report all historical data using this new methodology. Historical numbers have been revised and may differ significantly from originally reported values. The new methodology applies a detrended seasonal adjustment factor to the percentage change in job postings. In contrast, our previous methodology used the 2019 change between February 1 and the reported date as the adjustment factor, which implicitly included both a seasonality component and the underlying trend.
For nearly all series, job postings trended upward in 2019. The new methodology no longer subtracts out the underlying 2019 trend, so most historical figures are higher (i.e. less negative relative to the February 1, 2020 baseline) with the new methodology than originally reported.
Information is based on publicly available information on the Indeed US website (and any other countries named in the post), is limited to the United States, is not a projection of future events, and includes both paid and unpaid job solicitations. US. Armed Forces job postings are excluded.