
We will be regularly updating this data as we track how coronavirus impacts the global labor market.
The trend in job postings — a real-time measure of labor market activity — is 11.5% lower than in 2019, as of December 4. One week ago, postings were 11.6% below last year’s trend.
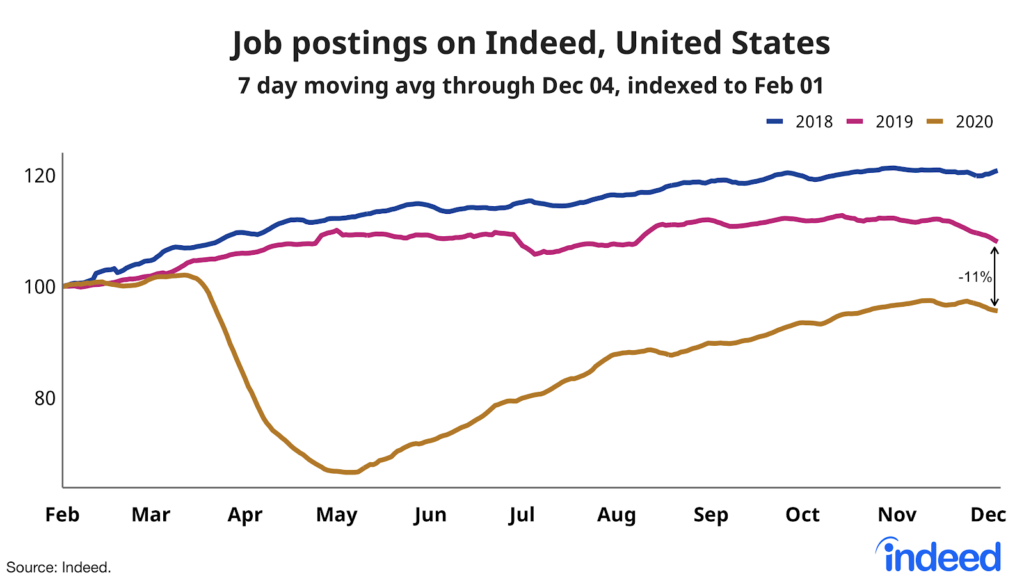
The trend in job postings was roughly in line with last year’s trend until the second week of March. Postings were 2.9% below the 2019 trend on March 15 then plunged over the next six weeks to a low point of 39.3% on May 1. There was improvement in May, June, and July, when our postings tracker improved by an average of 1.6 percentage points per week. Starting in August, improvement slowed to an average of just 0.4 percentage points per week.
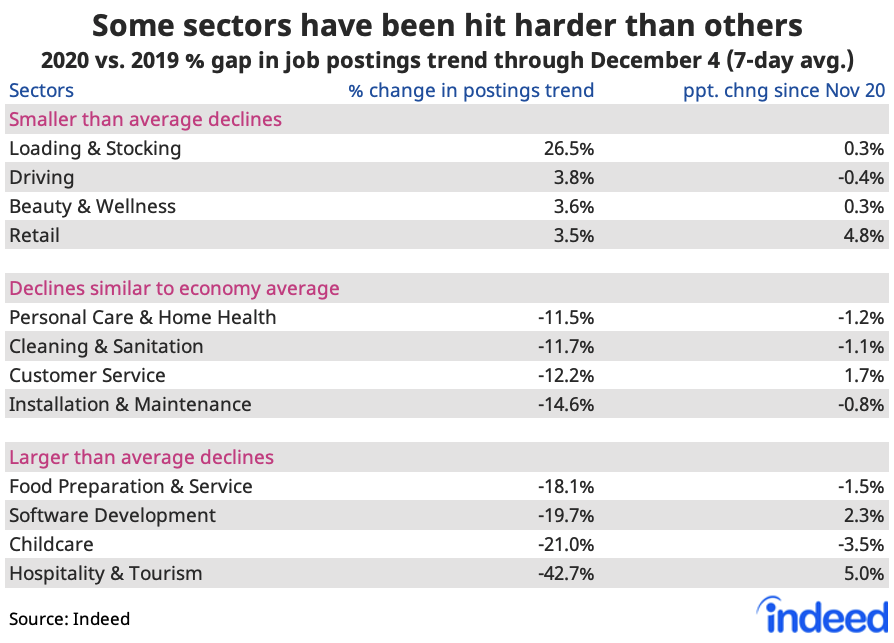
Hospitality and tourism jobs have seen the biggest decline
Job postings have fallen most in occupations directly affected by the coronavirus such as hospitality & tourism, sports, and arts & entertainment. Hospitality & tourism postings are down 43%. Postings are below last year’s trend in many higher-wage office sectors, too, like software development and banking & finance, though tech jobs have picked up in the last two weeks.
In several goods-related sectors, job postings are near or ahead of last year’s levels. Driving, loading & stocking, construction, manufacturing, beauty & wellness, and dental postings are above last year’s trend, as is retail. Some of these sectors, like dental and beauty & wellness, rebounded as people got services they postponed earlier in the pandemic. But other in-person services like food prep and childcare haven’t recovered and have started to backslide.
Job postings for higher-wage occupations have fallen the most. Initially, postings in higher-wage occupations fell less than those in middle- and lower-wage occupations, but have subsequently lagged. Postings in higher-wage occupations are now 14% below trend, versus 8% below trend for lower-wage occupations.
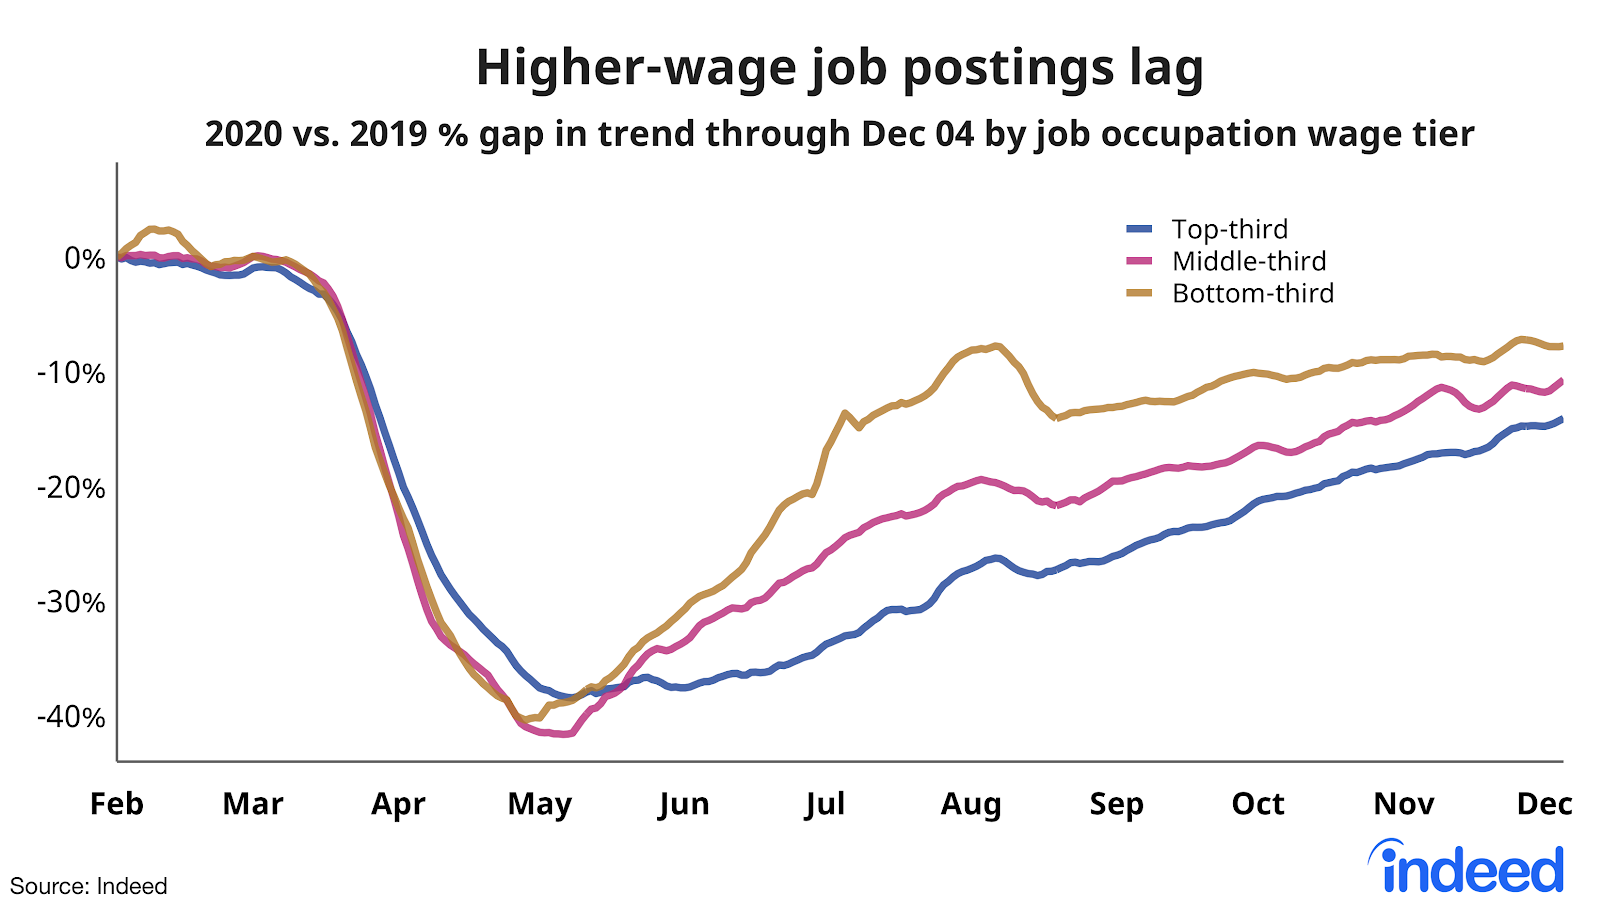
This pattern in job postings is different from the trend in employment. Bureau of Labor Statistics data through mid-November show that lower-wage industries have lost the most jobs in the pandemic, by a wide margin. Lower-wage industries like retail and food service adjust their workforces in response to month-to-month or even week-to-week changes in demand. But it is more expensive and often takes longer to fire and hire higher-wage workers. Higher-wage industries like tech and finance might plan their headcounts based on what they expect demand to look like longer-term, in future quarters or years.
Where job postings have declined most
Within the US, the trend in job postings is down most in metro Honolulu, Seattle, and San Francisco. In these metros, job postings are down more than twice as much as the national average.
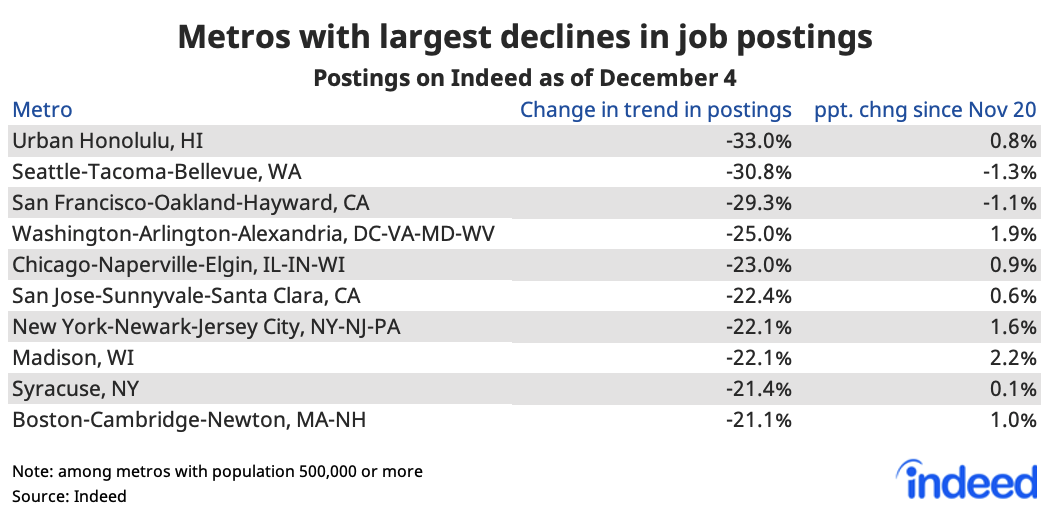
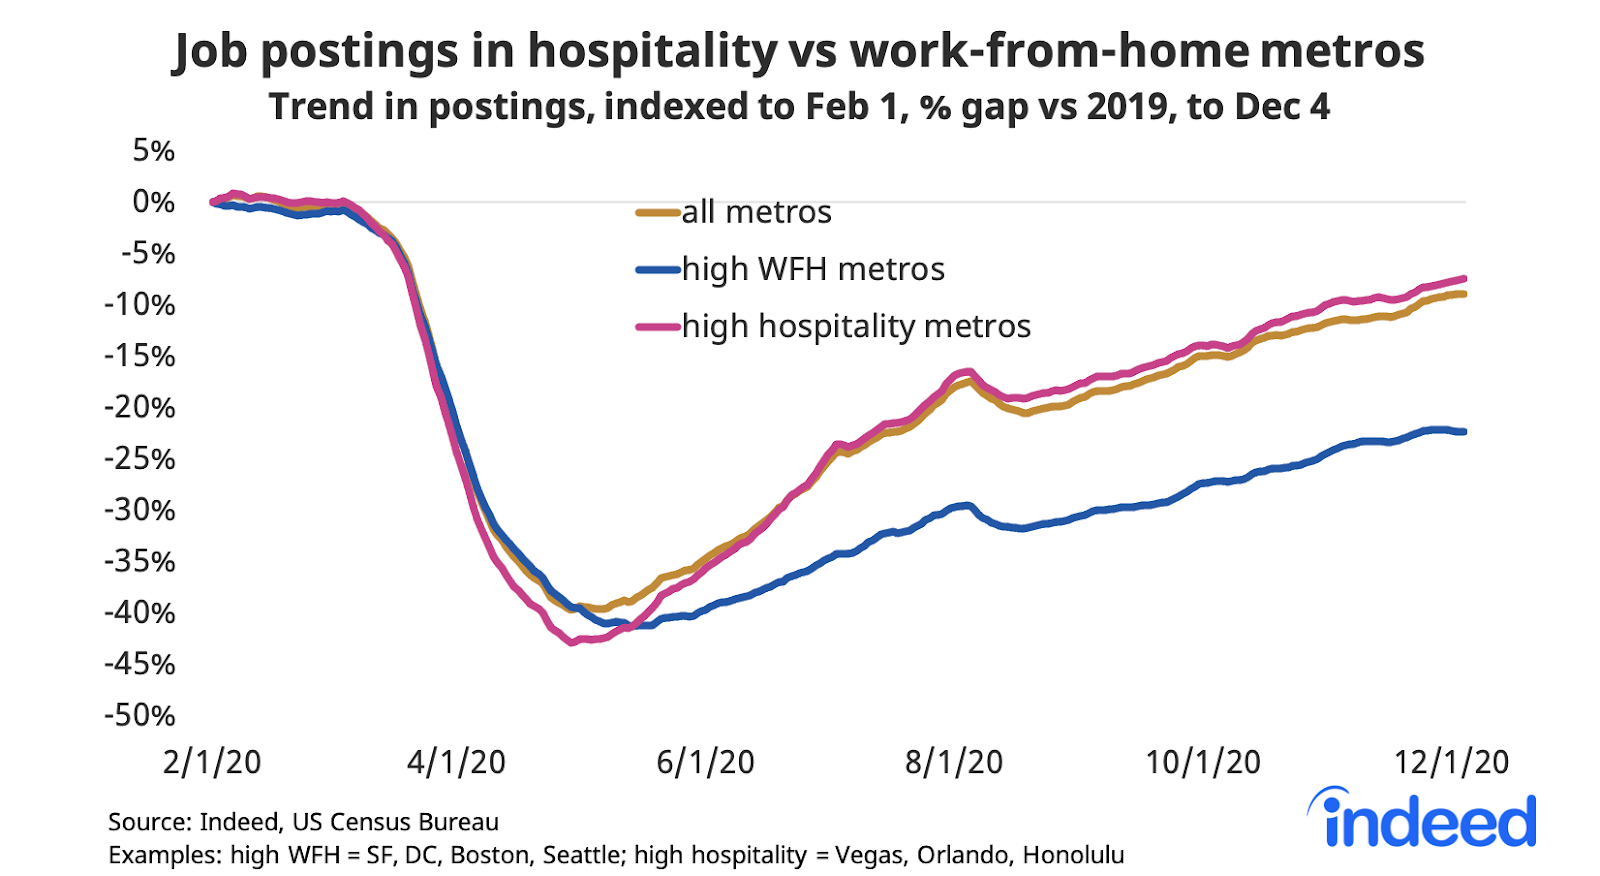
Job postings fell more initially in travel and tourism destinations, large and small, but postings have picked up since May in hospitality metros like Las Vegas, Miami, and Orlando. Job postings have rebounded much more slowly in metros where more of the jobs can be done from home. In work-from-home metros, postings in retail, restaurant, and personal-services jobs have suffered. Postings in high work-from-home metros remain 22% below last year’s trend, with slow recovery.
The autumn surge in COVID19 cases isn’t affecting local job-posting trends. Postings have improved similarly in recent weeks where new cases per capita are highest — like El Paso TX, Sioux Falls SD, and Green Bay WI — as in the rest of the country. And job postings had recovered more prior to October in places where cases are now surging.

We’ll be regularly updating this data. We also host the underlying chart data on Github as downloadable CSV files. Typically, it will be updated with the latest data one day after the respective Hiring Lab tracker is published.
Note: recently we changed our methodology very slightly for calculating the change in job postings for metropolitan areas. We will continue publishing metro-level data in this blogpost but won’t be publishing the full time-series on Github this week.
Methodology
To measure the trends in job postings, we calculated the 7-day moving average of the number of US job postings on Indeed. We index each day’s 7-day moving average to the start of that year (Feb 1, 2020 = 100 for 2020 data, and so on), or another date if specified on the chart.
We report how the trend in job postings this year differs from last year, in order to focus on the recent changes in labor market conditions due to COVID-19. For example: if job postings for a country increased 30% from February 1, 2019, to May 22, 2019, but only 20% from February 1, 2020, to May 22, 2020, then the index would have risen from 100 to 130 in 2019 and 100 to 120 in 2020. The year-to-date trend in job postings would therefore be down 7.7% on May 22 (120 is 7.7% below 130) in 2020 relative to 2019.
In the tables for this post, the caption “change in trend in postings” represents the percent change in job growth rate from February 1 compared to the same date the year prior.
We occasionally update the full series of job-postings numbers for metros and states. We exclude U.S. Armed Forces job postings, which tend to be clustered in specific locations at specific times. The trend numbers for individual metros and states might change as we identify and exclude likely Armed Forces jobs.
The number of job postings on Indeed.com, whether related to paid or unpaid job solicitations, is not indicative of potential revenue or earnings of Indeed, which comprises a significant percentage of the HR Technology segment of its parent company, Recruit Holdings Co., Ltd. Job posting numbers are provided for information purposes only and should not be viewed as an indicator of performance of Indeed or Recruit. Please refer to the Recruit Holdings investor relations website and regulatory filings in Japan for more detailed information on revenue generation by Recruit’s HR Technology segment.