Key points:
- Most labor market measures are more than halfway back to pre-pandemic levels.
- Much of America still faces a long road back despite the strong rebound.
- The coronavirus recession was different from other downturns, with service jobs suffering most and much of the job loss temporary.
- Next year’s labor market depends on the path of the virus, politics and policy in the new administration, and the extent to which pandemic-era behaviors like remote work become permanent.
The US labor market has recovered more than half its pandemic losses. Payroll employment, the unemployment rate, and job postings are now closer to their pre-pandemic levels than to their worst moments in April and May. However, much damage remains. Some temporary layoffs have turned permanent and some sectors, places, and people still face alarmingly and stubbornly high job losses. In short, the labor market is now better than the grim mid-year predictions, but weaker than headline measures suggest.
Above all, the 2021 outlook hinges on the course of the coronavirus. Both the recent virus surge and the election make government emergency relief more likely. Next year will also start to show whether two of the big pandemic shifts will endure — from services to goods and from in-office to remote work. Even small shifts in these trends, if permanent, could cause big changes in how businesses hire, how job seekers search, where people live, and how much they earn.
Apologies for the long read. This year’s review and outlook is much longer than I expected, but so was 2020.
This time really is different
When the pandemic hit the economy in March, it was clear that this downturn would be different. Previous recession records were quickly shattered. In early April, weekly unemployment claims were almost six times higher than their previous high, in 1982. April’s job losses were more than 10 times higher than their previous peak, in 1945. Unemployment spiked to 14.7%, its highest since the Great Depression in the 1930s. Beyond these record-setting numbers, the underlying causes and effects were unlike anything seen before. Here’s how the coronavirus recession is different.
Entire sectors effectively shut down. Travel stopped, restaurants closed, gyms and hair salons went dark, and conferences were cancelled. Employment fell by more than half in the movie industry, personal and laundry services, dental offices, and clothing stores. Broad swathes of the economy stopped completely and suddenly. At the same time, other sectors had to find ways to get food, medical care, household essentials, and utilities to people staying at home.
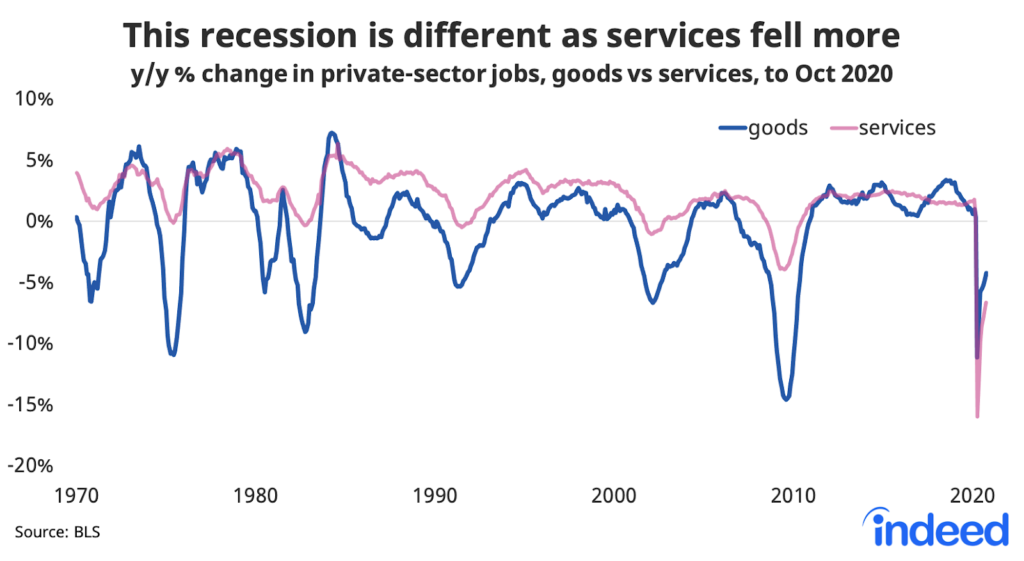
Service sectors suffered most. Other modern recessions led to relatively more job losses in goods-related areas of the economy like construction and mining. In contrast, this recession hit services, especially those that require face-to-face interaction. Big cities fared worst since they have clusters of hard-hit sectors like arts & entertainment. Also, big cities have concentrations of work-from-home sectors like tech and finance, and retail and personal services sectors have suffered more in places where more of their local customers are able to work from home.
Most of the job losses were temporary. When unemployment peaked in April, 78% of unemployed workers reported they were on temporary layoffs — the highest level ever by a huge margin. Temporary layoffs are normally 10-15% of unemployment and their share fell even lower in the Great Recession. But, in this recession, the huge rise of temporary layoffs created lots of uncertainty about whether and how soon people would be called back, and an urgent need for government support to help bridge the crisis.
By October, the temporary share of unemployment had dropped back to 29%. These wild swings have skewed some essential measures of the labor market, like the headline unemployment rate. That exaggerated the severity of the recession in the spring, but also the extent of healing more recently.
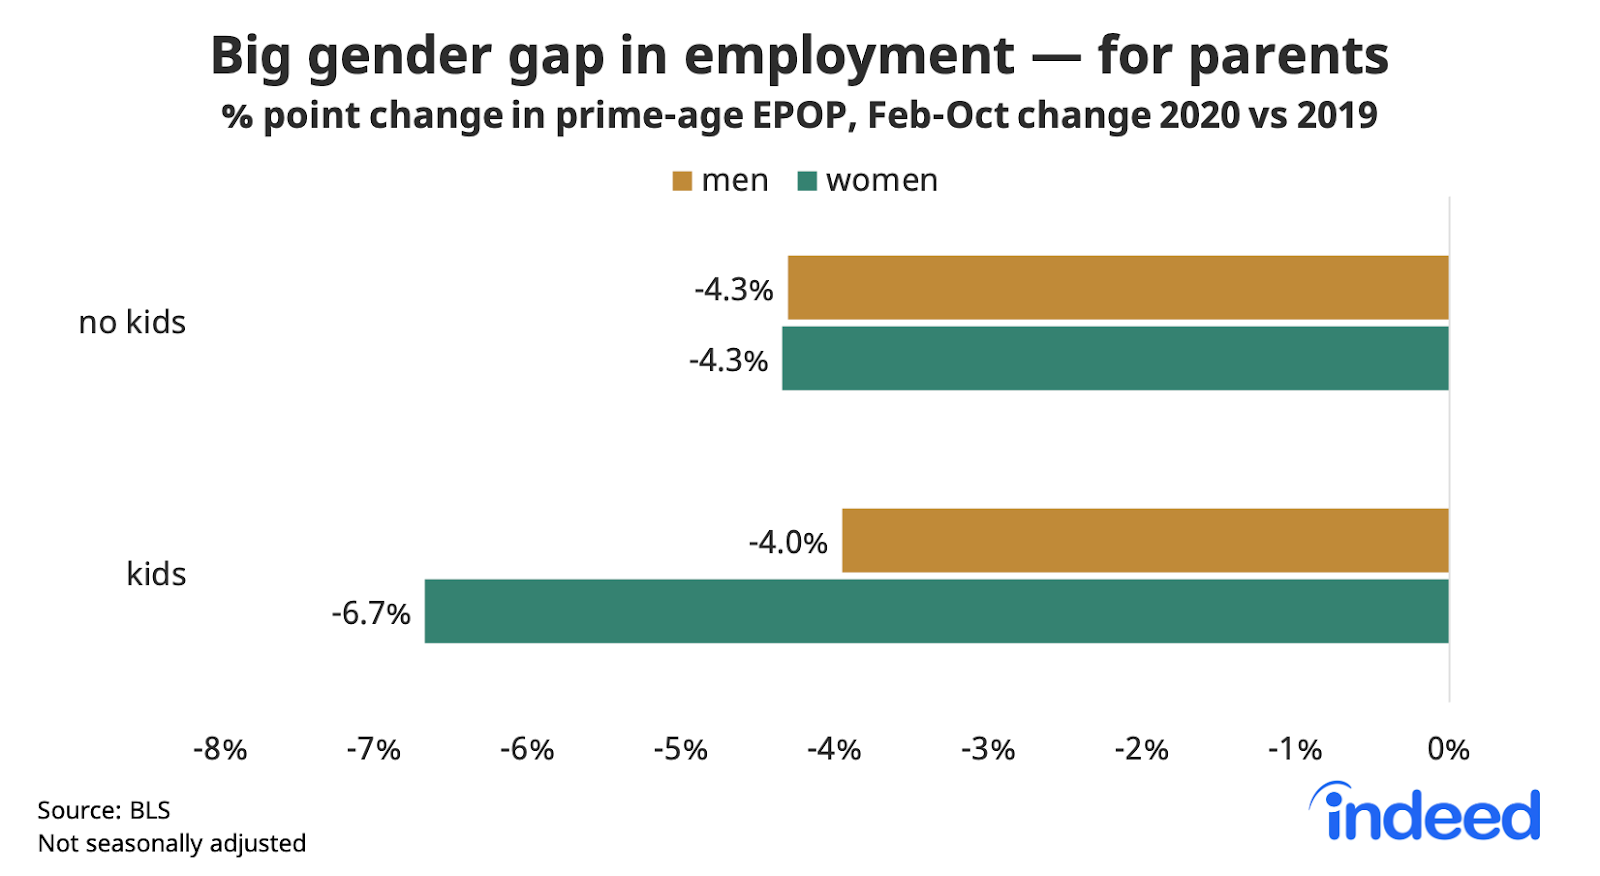
The pandemic hurt labor supply, not just labor demand. Some people have been unable or reluctant to work or search for a job during the pandemic. Those on temporary layoffs might not search if they expect to return to their jobs. Others might hesitate to work at jobs requiring face-to-face contact out of concern for their health. Finally, school and child-care closures have created huge caregiving burdens for parents, especially mothers. Employment fell much more for mothers than for fathers, while there has been no gender gap for childless households.
Yet, even though many people have reasons for not working, the main labor market problem is a lack of jobs, not a shortage of workers.
The four pandemic job types
Job losses during the pandemic have been widespread, but uneven. COVID-19 devastated some sectors like leisure & hospitality. At the same time, others have paused, rebounded, or even come out winners.
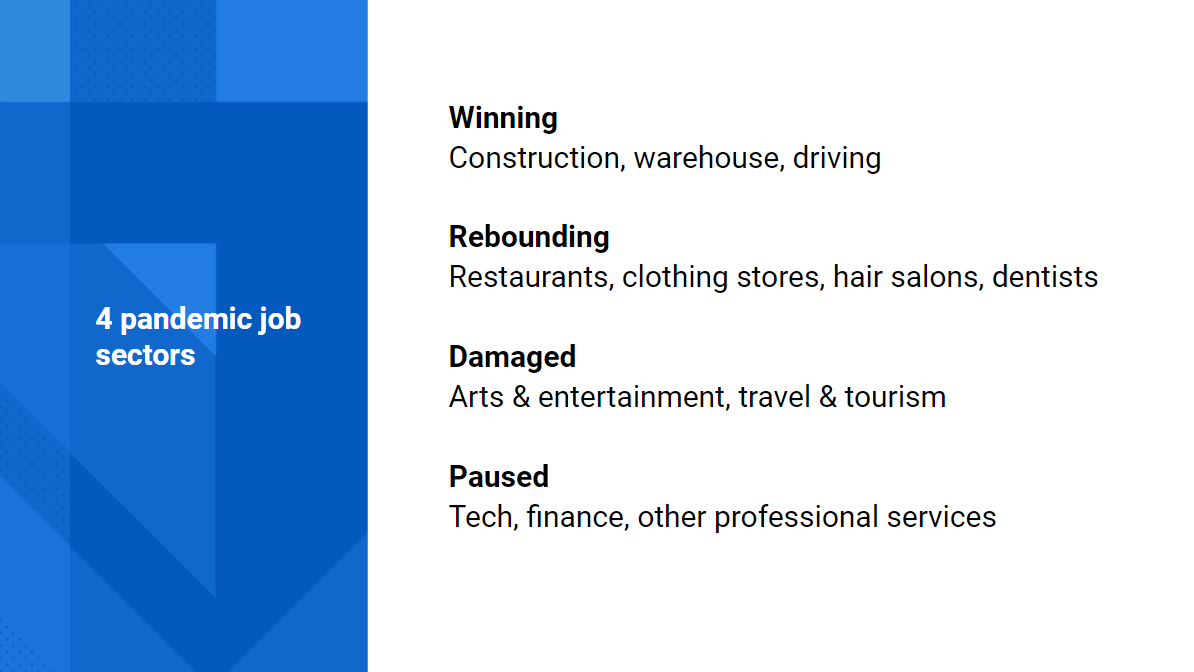
First the winners. Some sectors have done surprisingly well in the pandemic because the economy has shifted toward them. For the most part, these sectors support the stay-at-home economy. According to US government data, employment was at least as high in October as in February for megastores like Costco and Walmart, grocery stores, and home improvement stores, as well as delivery-related services like couriers & messengers and warehouse & storage. And another indicator — Indeed job postings — is above last year’s trend in construction, loading & stocking, and driving as of mid-November.
Second are rebounding sectors, which mostly shut down at the start of the pandemic but have at least partially reopened. Good examples are restaurants and clothing stores, as well as personal service businesses that people rushed to when they reopened their doors, like hair salons and dental offices. These sectors furloughed workers and later recalled them, or they laid off some workers and later hired new ones. These sectors tend to be lower-wage with lots of churn, adjusting workforces quickly as demand moves up and down. Their hiring has picked up even though employment in them is still below pre-pandemic level. However, these sectors are most at risk from future virus surges and containment efforts.
Third are damaged sectors where employment plummeted and has rebounded little. In arts & entertainment, hospitality & tourism, sports, and transit & air travel, job postings and employment remain far below pre-pandemic levels. They’re unlikely to recover before the virus is under control — and perhaps slowly even after that if business capacity and customer confidence take time to rebuild.
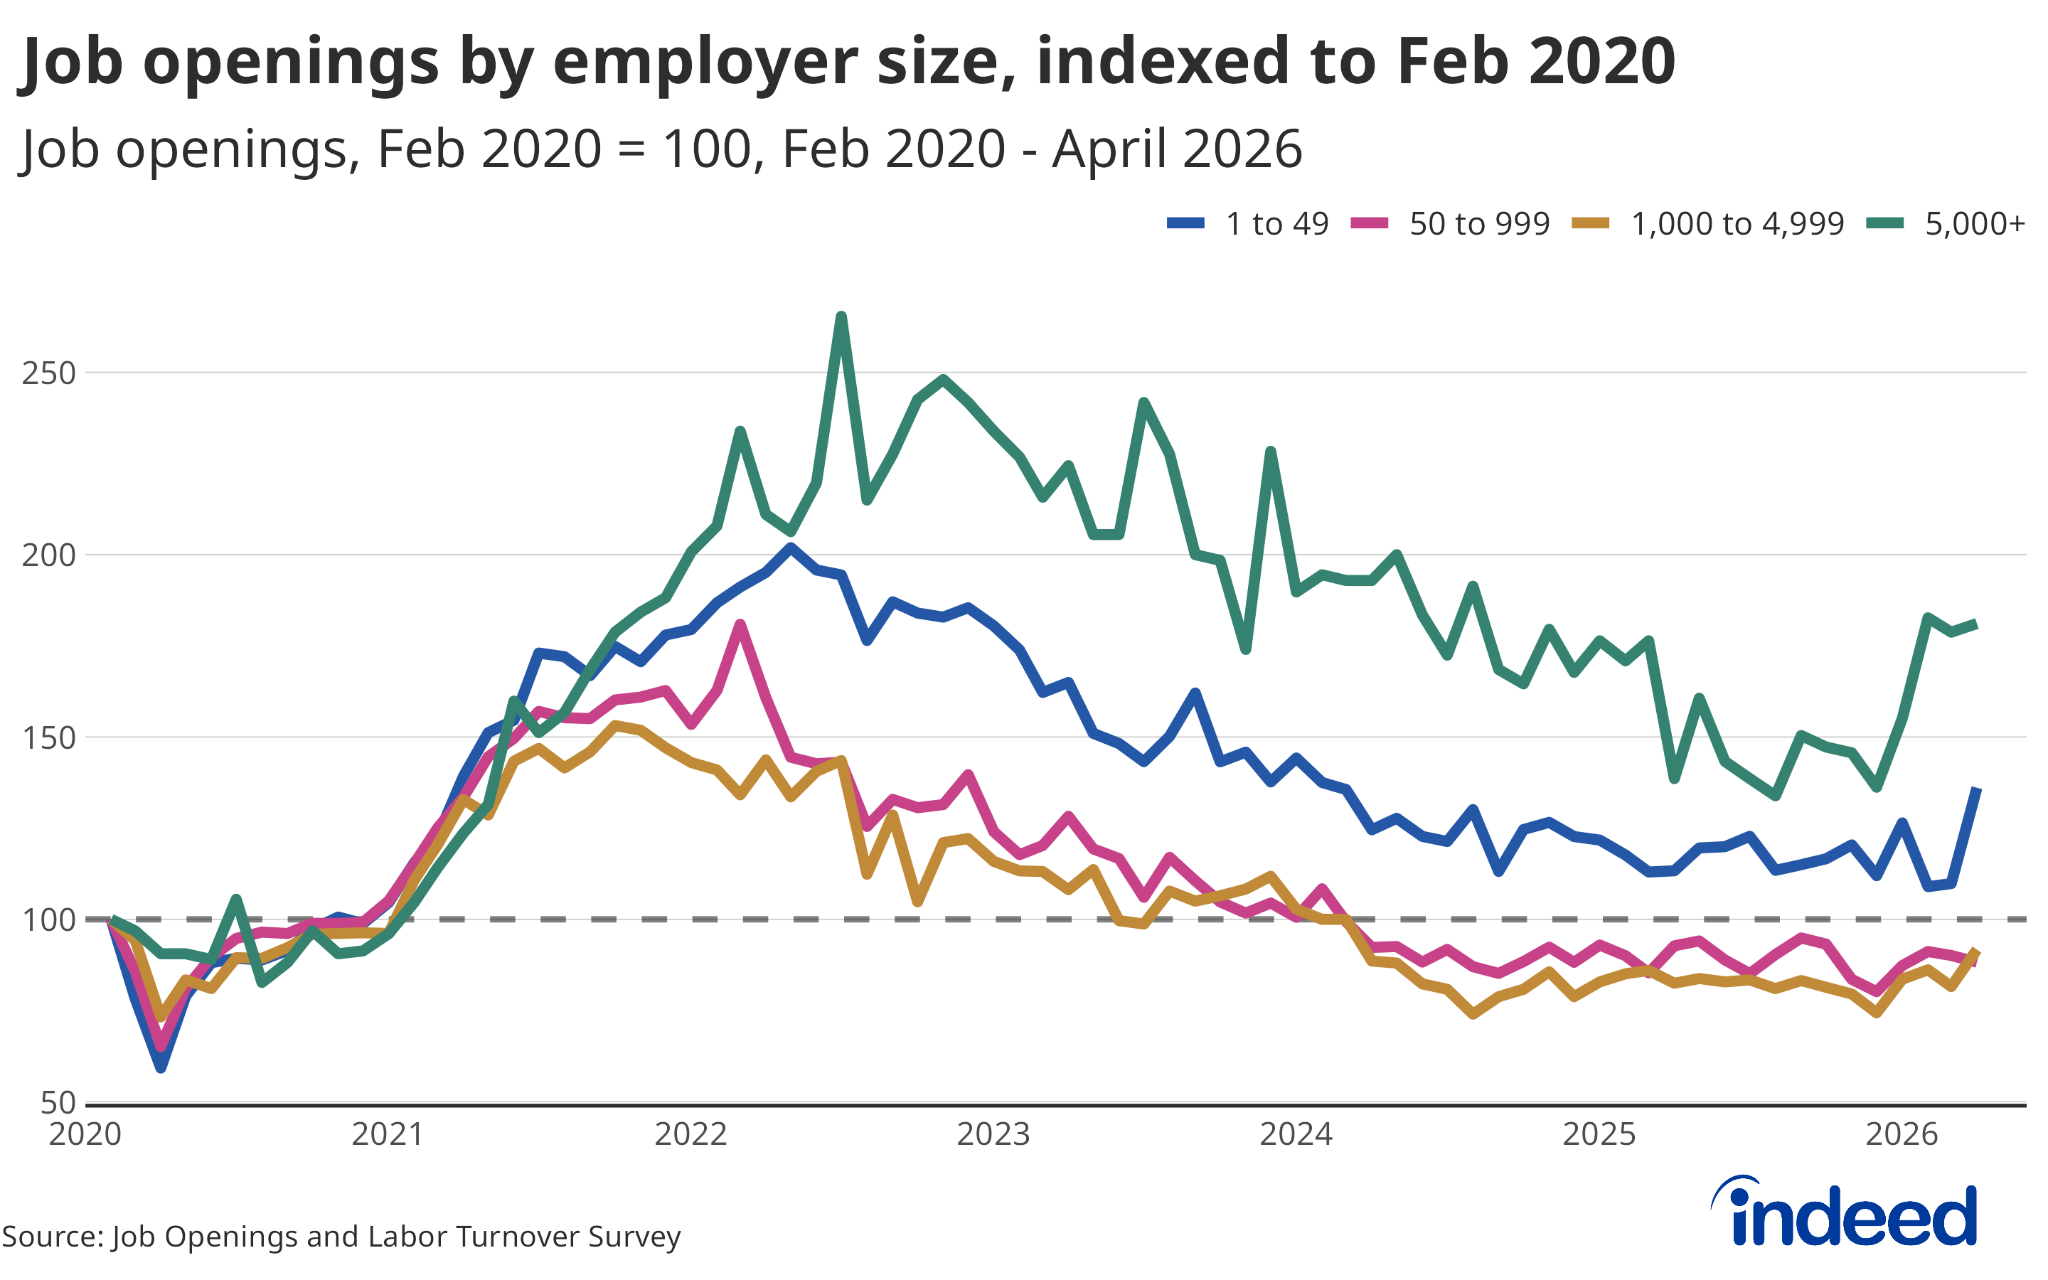
Fourth are paused sectors. These are higher-wage areas of the economy where people can work from home, like tech, finance, and other professional services. Job losses have been relatively modest in these sectors, but job postings have fallen significantly, signaling little firing, but little hiring in them. Because these are well-paid industries, it’s more expensive for employers to find, hire, and train workers. That makes employers more likely to hold onto staff until the economy turns around. In contrast, a restaurant is more likely to lay off people and quickly rehire if business picks up.
These paused sectors explain a paradox in the labor market. Since February, employment has fallen more in lower-wage industries than in higher-wage ones, yet job postings on Indeed are down more in higher-wage jobs. Many lower-wage jobs are in rebounding sectors, which are quicker to fire and hire as demand shifts. Higher-wage jobs are more likely to be in the paused sectors. These weren’t hit as hard by the pandemic, but they have taken a defensive, wait-and-see approach to hiring. In this way, job postings and hiring in these higher-wage sectors are a helpful indicator of longer-term economic confidence.
In the end, the 2020 labor market performed better than feared
The labor market is now in far worse shape than anyone could have imagined at the start of the year — but on much firmer ground than at the lowest point of this crisis. The good news is that key labor market measures are more than halfway back to pre-pandemic levels.
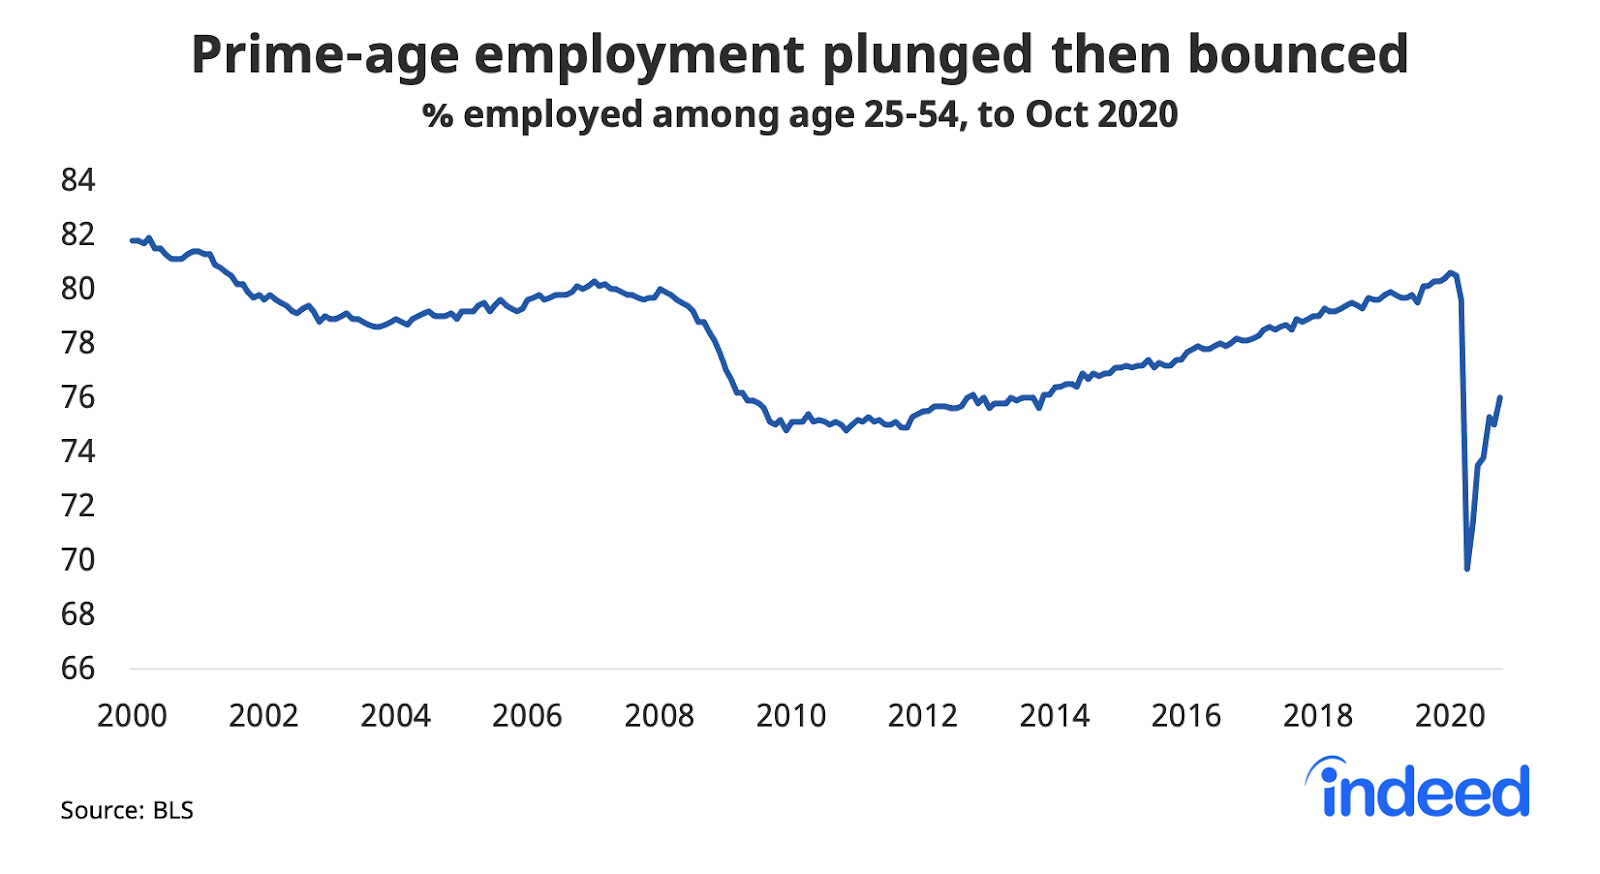
Employment plunged in March and April 14.5% from February. By October, it had recovered more than halfway to 6.6% below February. Job postings on Indeed, after reaching a low on May 1 of 39% below last year’s trend, are two-thirds of the way back to down 13% in mid-November. Similarly, the unemployment rate fell to 6.9% in October after spiking to 14.7% in April, marking a return most of the way back to its February level of 3.5%. Broader measures like underemployment and the employment-population ratio for prime-age workers (aged 25-54) are also more than halfway back from their worst readings. Prime-age employment tumbled in April to 69.7%, far below its Great Recession low of 74.8%. It has since bounced back to 76.0%.
Though the labor market rebound is incomplete, it has nevertheless surpassed expectations. In May, after payrolls plunged and unemployment spiked, the Wall Street Journal panel of economic forecasters projected unemployment would be over 11% in December 2020 and not fall below 7% until the first half of 2022 — a milestone already passed in October. And an Indeed survey found people were more upbeat about their personal financial situation in late September than just before the pandemic, buoyed by rising home and stock market prices, and emergency government programs to boost income.
Plenty of damage remains
Now the bad news. It’s not all as good as it looks. Big increases in jobs aren’t that impressive when they follow a huge decline. Most of the summer and autumn rebounds involved the relatively easy parts. Much of the improvement since April has concerned temporarily furloughed people returning to their jobs and in-person services reopening after shutdowns. The remaining gaps will be harder to close. Already the recoveries in payroll employment, job postings, and the prime-age employment-population ratio are slowing.
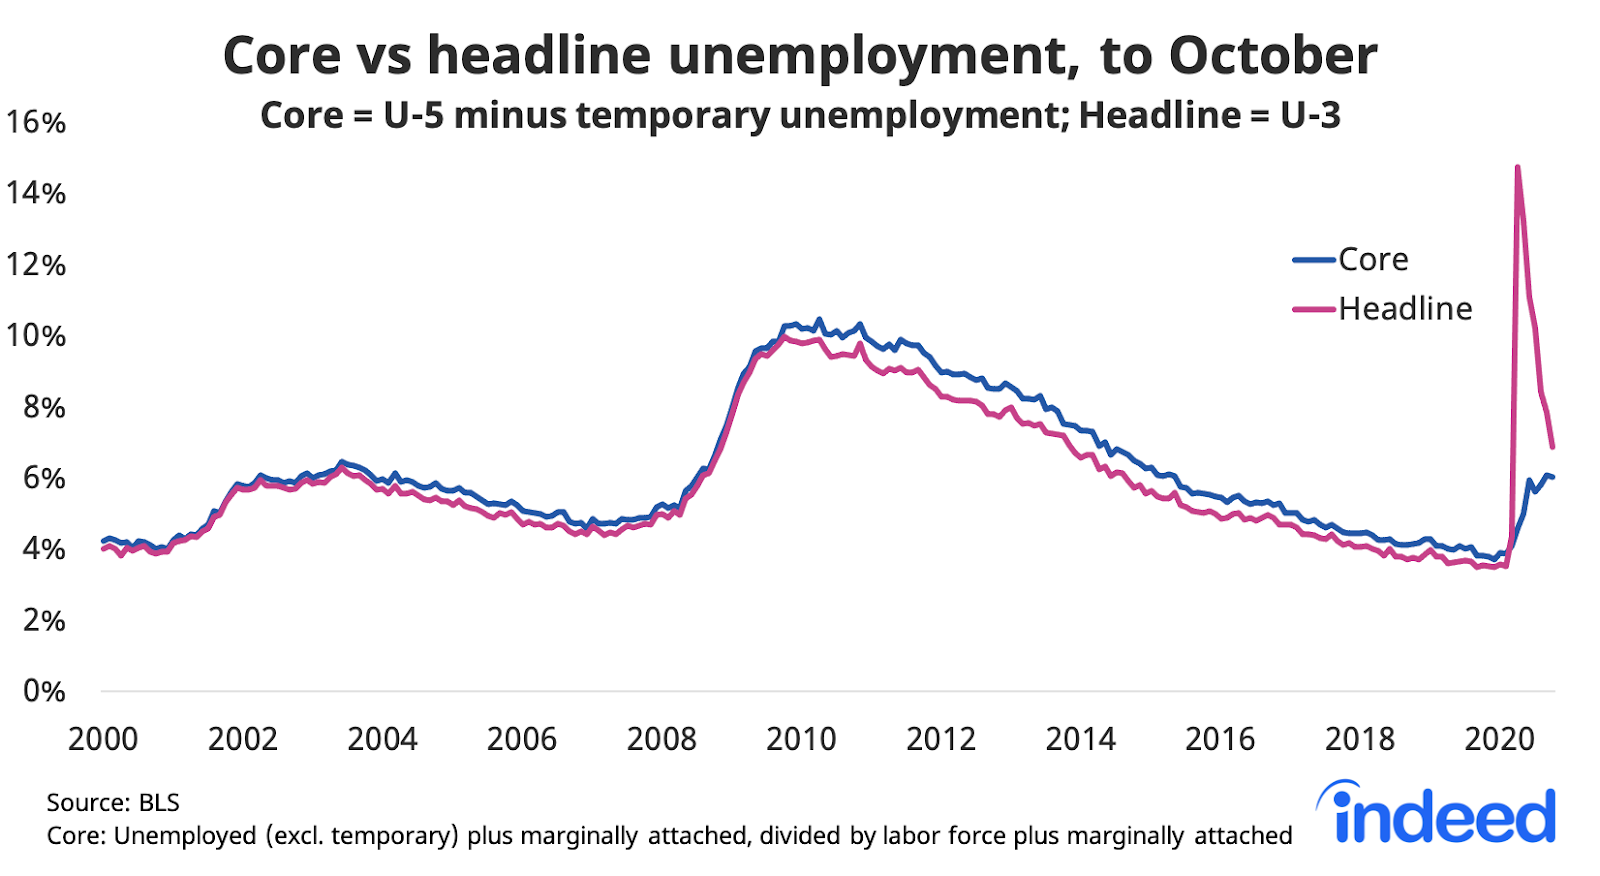
Let’s look instead at measures of the labor market that remove temporary swings. One is the core unemployment rate, which subtracts temporary layoffs and focuses on those who have permanently lost jobs. Even as the rehiring of furloughed workers caused the headline unemployment rate to plunge, the core rate has been stuck around 6% for several months. The core unemployment rate remains much lower than its Great Recession peak in 2010, but it’s still near the worst level of the pandemic.
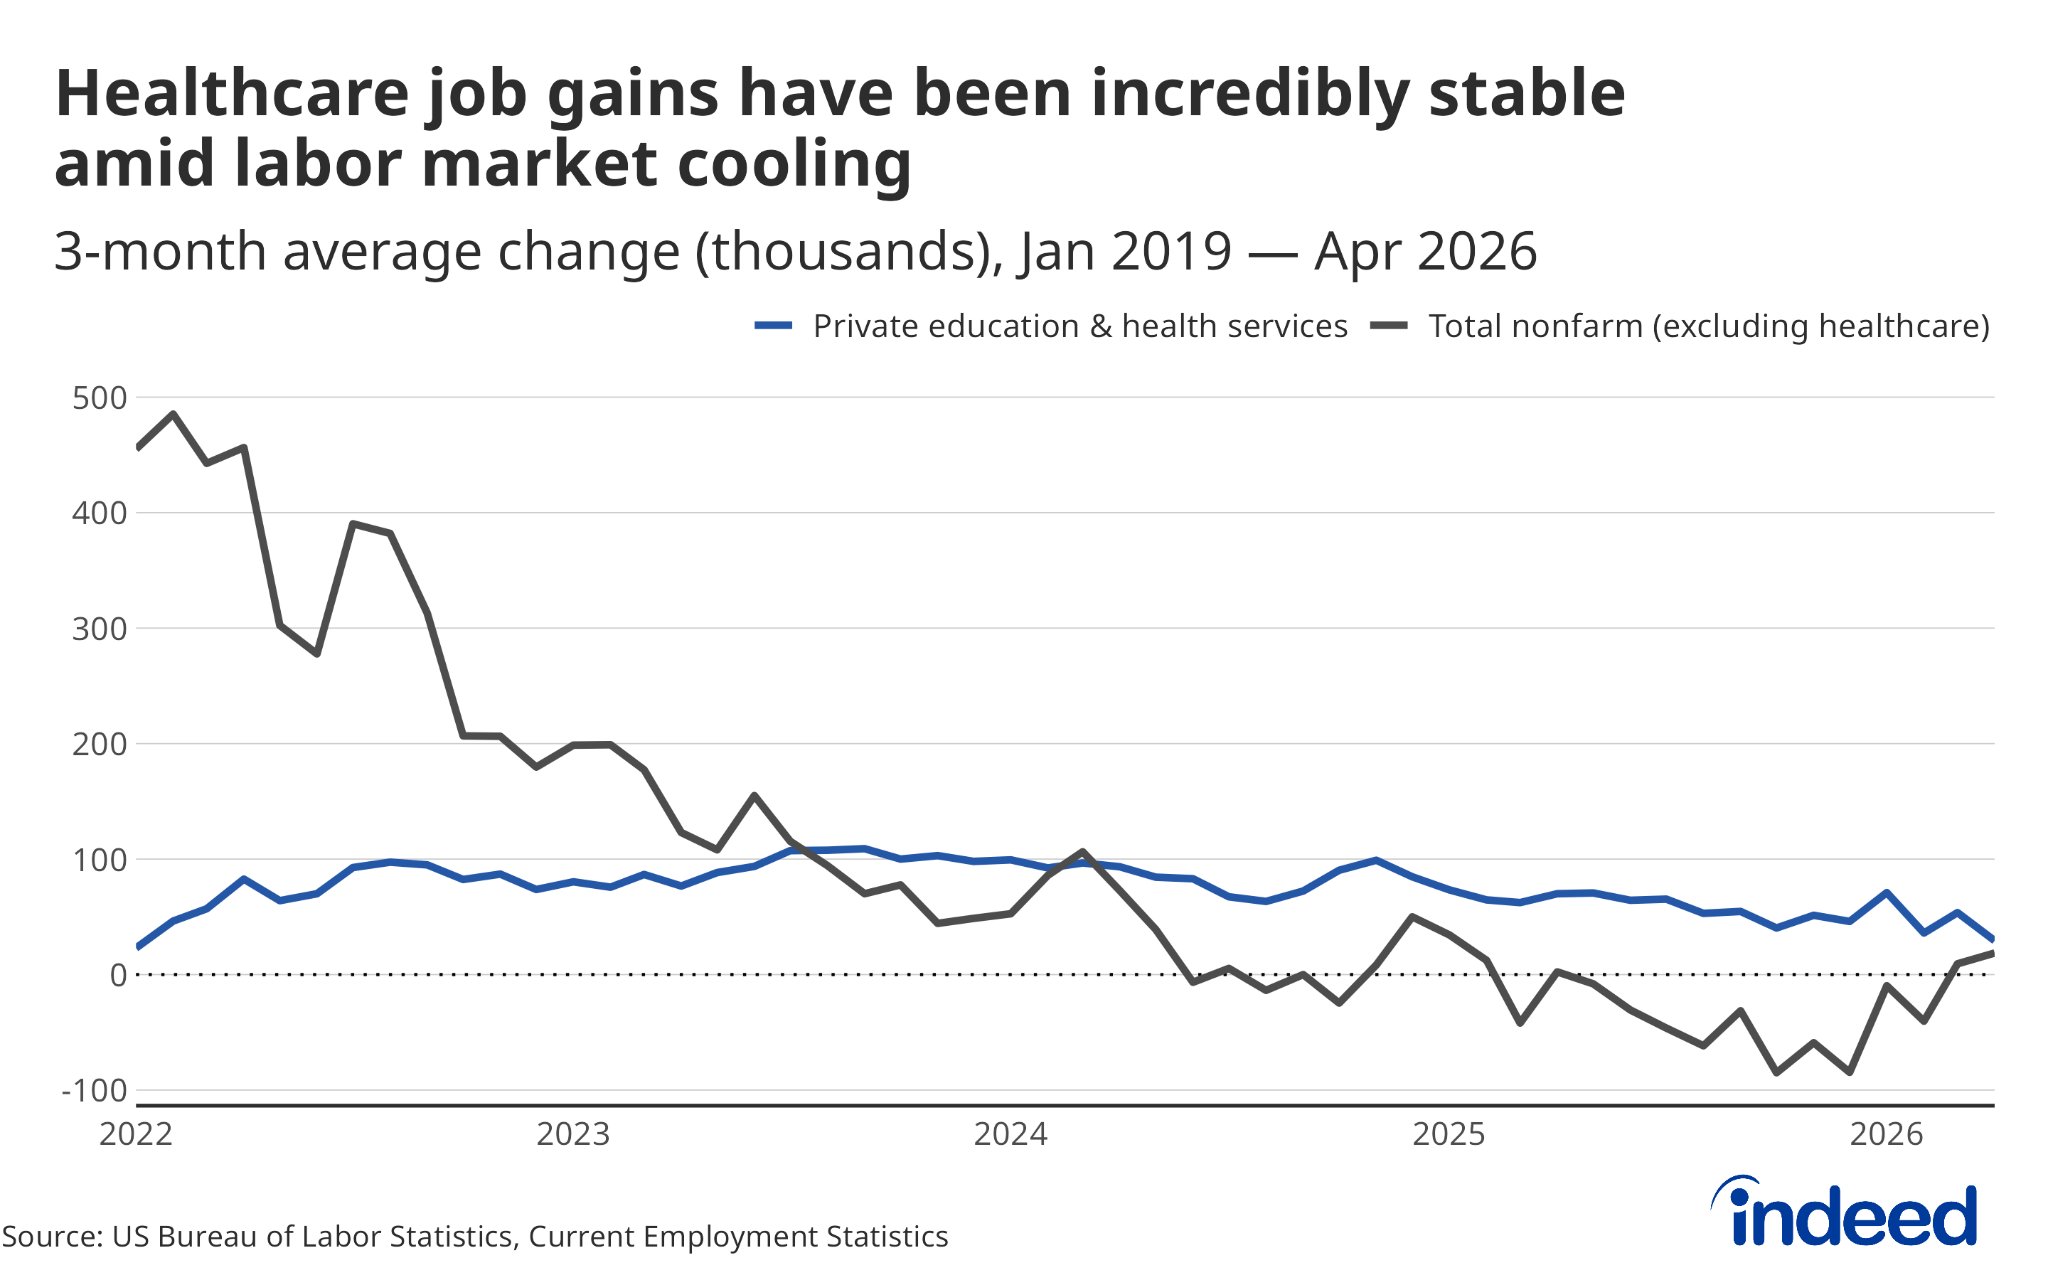
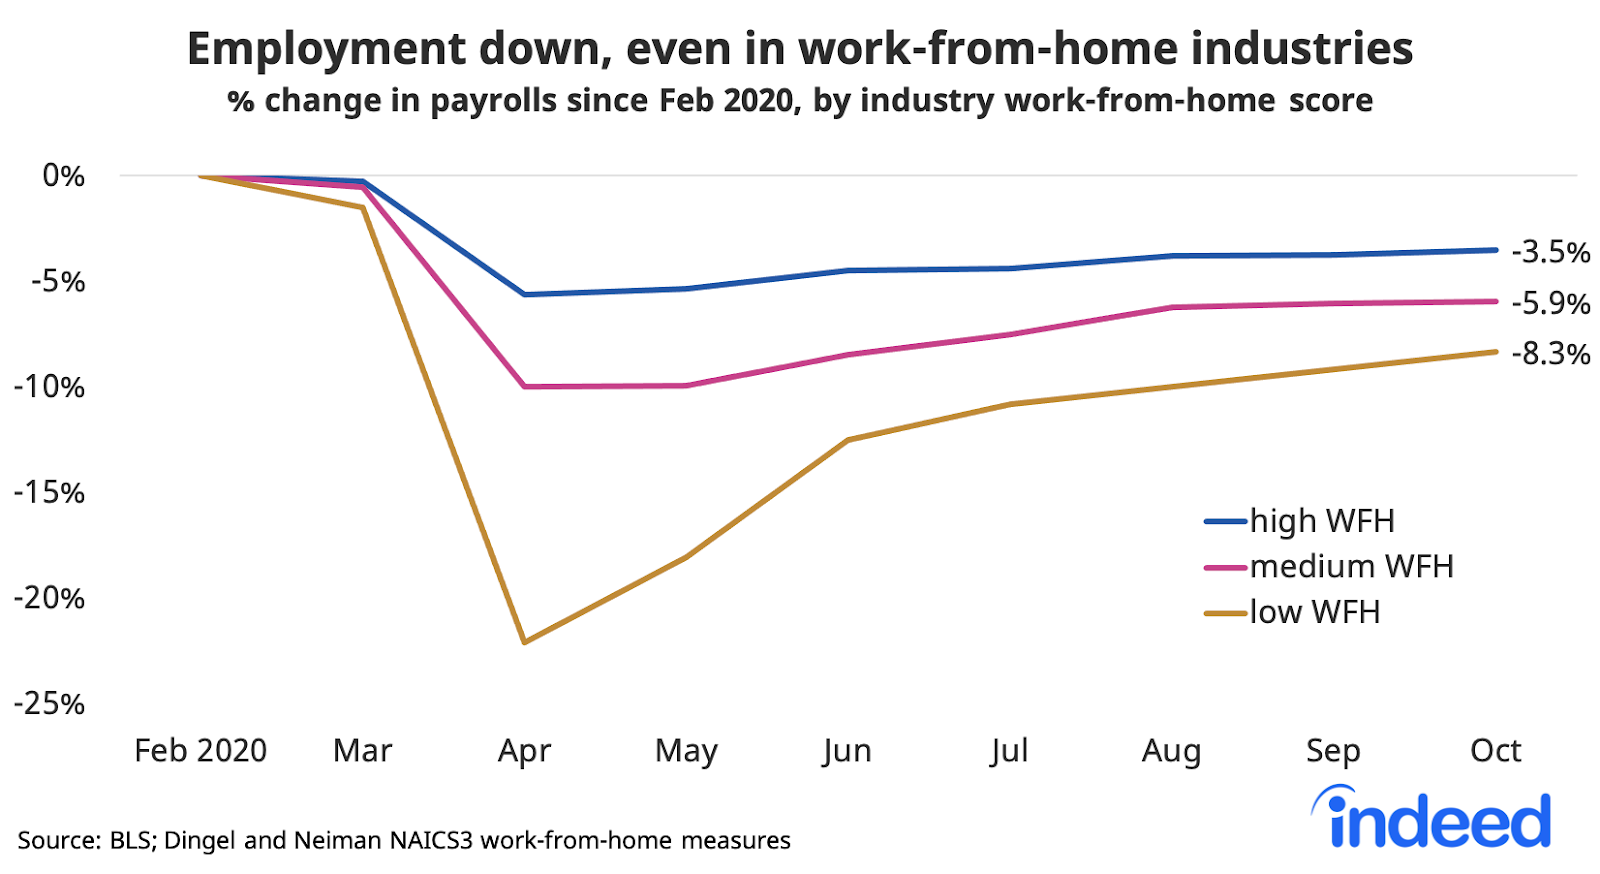
Another indicator of longer-term damage is job losses in industries where most people can work from home and therefore aren’t as directly affected by the pandemic. In high work-from-home sectors like tech, finance, and professional services, employment was 3.5% lower in October than in February. Of course that’s a much milder drop than in low work-from-home sectors like restaurants and clothing stores, but the remote-work sectors have rebounded much less. Jobs in them aren’t yet halfway back from their April low and remain off almost as much from peak to trough as they were in the Great Recession.
Furthermore, despite recent gains, many sectors, places, and people are still clobbered. Employment is down more than 25% in hotels and the recreation sector, and more than 40% in the performing arts.

In September unemployment was over 10% in Las Vegas, Los Angeles, Chicago, and many other metropolitan areas. And, in October, unemployment was 8.8% for Hispanics and Latinos and 10.8% for Blacks and African Americans, well above the overall rate of 6.9%.
Much of America still faces a long road back to the pre-pandemic economy, despite the strong rebound.
What to watch in 2021
First and above all, the 2021 labor market depends on how quickly vaccines, treatments, and containment efforts tame COVID-19. Once the acute phase of the pandemic is over, rebounding job sectors might return to health quickly and the paused sectors can start planning and hiring for a stronger economy. The damaged sectors might still lag if they need time to rebuild capacity by finding new workers or bringing equipment and facilities back into service.
The economy overall won’t snap quickly back to its pre-pandemic path after the acute phase ends. Rather, it will face some chronic pain as paused sectors restart and damaged sectors rebuild. The same Wall Street Journal forecasters who were pessimistic in May are now more upbeat, but they still expect unemployment to be 5.6% at the end of 2021, more than two percentage points above its pre-pandemic level. Unfortunately, this services-led recession is likely to recover more slowly than goods-led recessions typically do.
With unemployment falling but still elevated, the labor market won’t be as tight as it was in the years just before the pandemic. That means more unemployed people per job opening, and less pressure on employers to invest in training or hire from broader backgrounds. Periods of higher unemployment tend to worsen inequalities. Gaps between haves and have-nots, those with less education and those with more education, racial and ethnic groups, and men and women have widened during the pandemic. Unfortunately, they may persist.
A second big question is politics and policy. Already the presidential election has upended economic confidence, with the views of Democrats soaring and those of Republicans sinking. Economic confidence doesn’t always immediately translate into people’s behavior. But the election has changed the calculations about emergency relief spending. Government action is gaining urgency as cases surge and existing pandemic unemployment benefits expire at the end of the year. Government programs earlier this year were instrumental in boosting household incomes and keeping some businesses afloat.
The election also revealed a widening partisan economic divide. The pandemic-induced recession has been worse for Democrats and blue-leaning places, mostly because their job mix is skewed toward harder-hit sectors. But places with a brighter future swung even more toward the Democrats in 2020 than in 2016. Democratic-leaning places have higher educational attainment, a job mix projected to grow faster long-term, and fewer jobs at risk from automation than Republican-leaning places, gaps that all grew wider during this election.
All the same, the pandemic brought some Democratic and Republican attitudes closer together. Our survey found big jumps in support for tariffs, universal healthcare, and universal basic income between early March and late September, with Republican support rising for traditionally Democratic favorites like universal benefits and higher minimum wages. It remains to be seen whether this convergence outlasts the pandemic. With the economic fundamentals of Democratic-leaning and Republican-leaning places pulling farther apart, it might get harder to find common ground on economic policies and priorities.
A third big question is which pandemic shifts become permanent. Let’s look at two: from services to goods and from on-site to remote work.
Both consumer spending and employment shifted from services to goods during the pandemic as people bought pantry ingredients and exercise equipment instead of restaurant meals and gym memberships. This shift might persist if people want to continue cooking, working out at home, and similar activities. Alternatively, spending could go back to pre-pandemic patterns. In fact, we could even be in for a big rebound in spending on services that people deferred or are nostalgic for. All those rescheduled weddings and conferences might cause travel spending to soar — and perhaps people will decide they just pulled forward five years of home improvements and don’t need to make more. It could cut either way, so the goods-vs-services split in spending — and in turn employment — will be a key thing to watch.
The shift to remote work is more likely to endure, though nowhere near the levels reached in the pandemic. In May, 35% of employed workers were teleworking because of COVID-19, according to the Bureau of Labor Statistics. Research estimated that 37% of jobs could be done from home, suggesting that nearly everyone who could work from home in fact was doing so. By October though, the remote-work level had fallen to 21% even though the pandemic was on the rise. Surely that will fall further once the pandemic ends.
Remote work is mostly for the fortunate. In October, 40% of workers with a college degree were teleworking because of the pandemic versus just 6% of workers with a high school degree or less. Remote work might improve as people and their employers invest in home-office setups and remote-friendly processes. But it also might get worse as work relationships fray and people feel pressure to keep up with colleagues or competitors who are back in the office. Remote work might be especially hard on younger workers without professional networks or workplace experience, and on new employees who have never met their co-workers.
Even if remote work doesn’t expand further, it will still profoundly transform the labor market for employers and sectors that embrace it. If a truly national or even global labor market emerges for some occupations, replacing local ones, job seekers would have lots of new opportunities and employers would be able to recruit from a much broader pool of candidates. Salaries might vary based on employee location — or become uniform across all places. Even a modest economy-wide increase in remote work might also affect housing markets if some people move to more affordable neighborhoods formerly too remote for daily commutes.
In all, the labor market recovery should continue in 2021, barring big surprises with the virus or the political scene. The pandemic’s winning sectors might lose ground once we emerge from the stay-at-home economy. But the rebounding sectors should revive and the paused and damaged sectors should start their climb back. Once the acute phase is behind us, the recovery might start to look more like the conventional aftermath of typical recessions, with elevated joblessness and wider inequities, and services once again growing faster than goods sectors. It might not be a return to the tight labor market of 2018 and 2019, when wages accelerated and inequalities narrowed. But after the pain and upheaval of 2020, 2021 might still feel like a relief.