Key points:
- For both Democrats and Republicans, economic confidence has fallen, support for universal healthcare and universal basic income has increased, and there’s more concern that trade hurts jobs.
- Republicans remain more upbeat about the national economy, while Democrats have suffered greater job losses in the pandemic.
- However, some partisan differences have narrowed, with some Republicans adopting more typical Democratic views on inequality and universal benefits.
The pandemic and recession have changed how people think about the labor market and economic policy. Economic confidence has fallen, support for universal healthcare and universal basic income has increased, and there’s more concern that trade hurts jobs.
Partisan differences are pronounced. Republicans remain more upbeat about the national economy, while Democrats have suffered greater job losses in the pandemic. Yet some partisan differences have narrowed, with some Republicans adopting more typical Democratic views on inequality and universal benefits.
These findings are based on two Indeed surveys of American adults. The first was conducted in late February and early March, shortly before the early-warning indicators of unemployment insurance claims and job postings started flashing red. The second was conducted in late September. For comparability, we used consistent language and methodology in the two surveys. Together, they reveal both dramatic changes and persistent truths.
A bipartisan drop in national economic confidence
Perceptions of the economy have plummeted since early March. And no wonder — during the pandemic, unemployment and job losses have been worse than in the Great Recession. Even with the partial recovery since April, job losses remain widespread and unemployment is elevated. The Fed expects it will take years for the economy to fully return to health.
In late September, 34% of people said economic conditions in the country overall were excellent or good, with the rest saying only fair or poor. That’s down from 58% in early March. People were slightly more upbeat about local economic conditions, with 45% calling them excellent or good in September versus 62% in March.
Strikingly, 58% of those responding characterized their personal financial situation as excellent or good in September compared with 55% who said so in March, an increase very slightly below the 5% level of statistical significance. How is that possible with all the economic damage that’s occurred in this pandemic? Incomes have risen thanks to emergency government support like extra unemployment insurance. Meanwhile, rising home and stock prices have made many homeowners and investors wealthier. And, in case you wondered if our survey samples were screwy, unemployment rose among our respondents between March and September in line with government estimates (see methodology note).

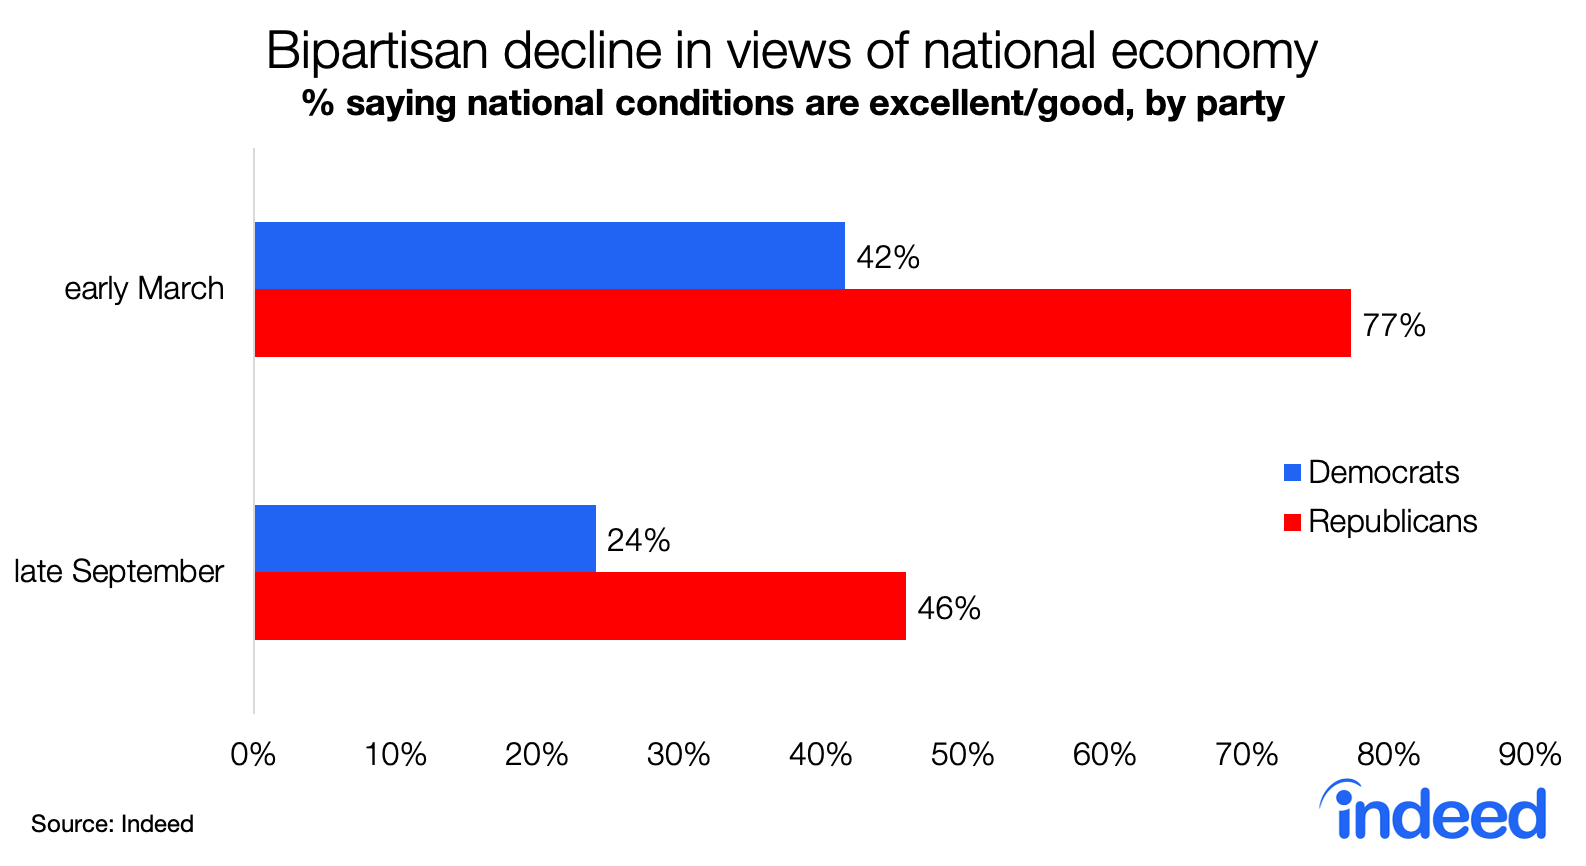
Democrats and Republicans agreed that national economic conditions deteriorated between the two surveys. In fact, the share of Republicans saying national conditions were excellent or good fell from 77% to 46% between March and September — a more-than-30-point slide, bigger than the 42% to 24% decline among Democrats. Republicans remain more positive about the national economy than Democrats, but the dramatic shock to the job market narrowed the partisan gap.
The reality of an uneven pandemic
Partisanship drives differences in economic confidence. Republicans’ views soared and Democrats’ views tanked just after the 2016 election, and these shifts were unrelated to actual changes in economic conditions. But, in this pandemic, reality has aligned with perceptions. By many measures, this recession has been worse for Democrats than Republicans.
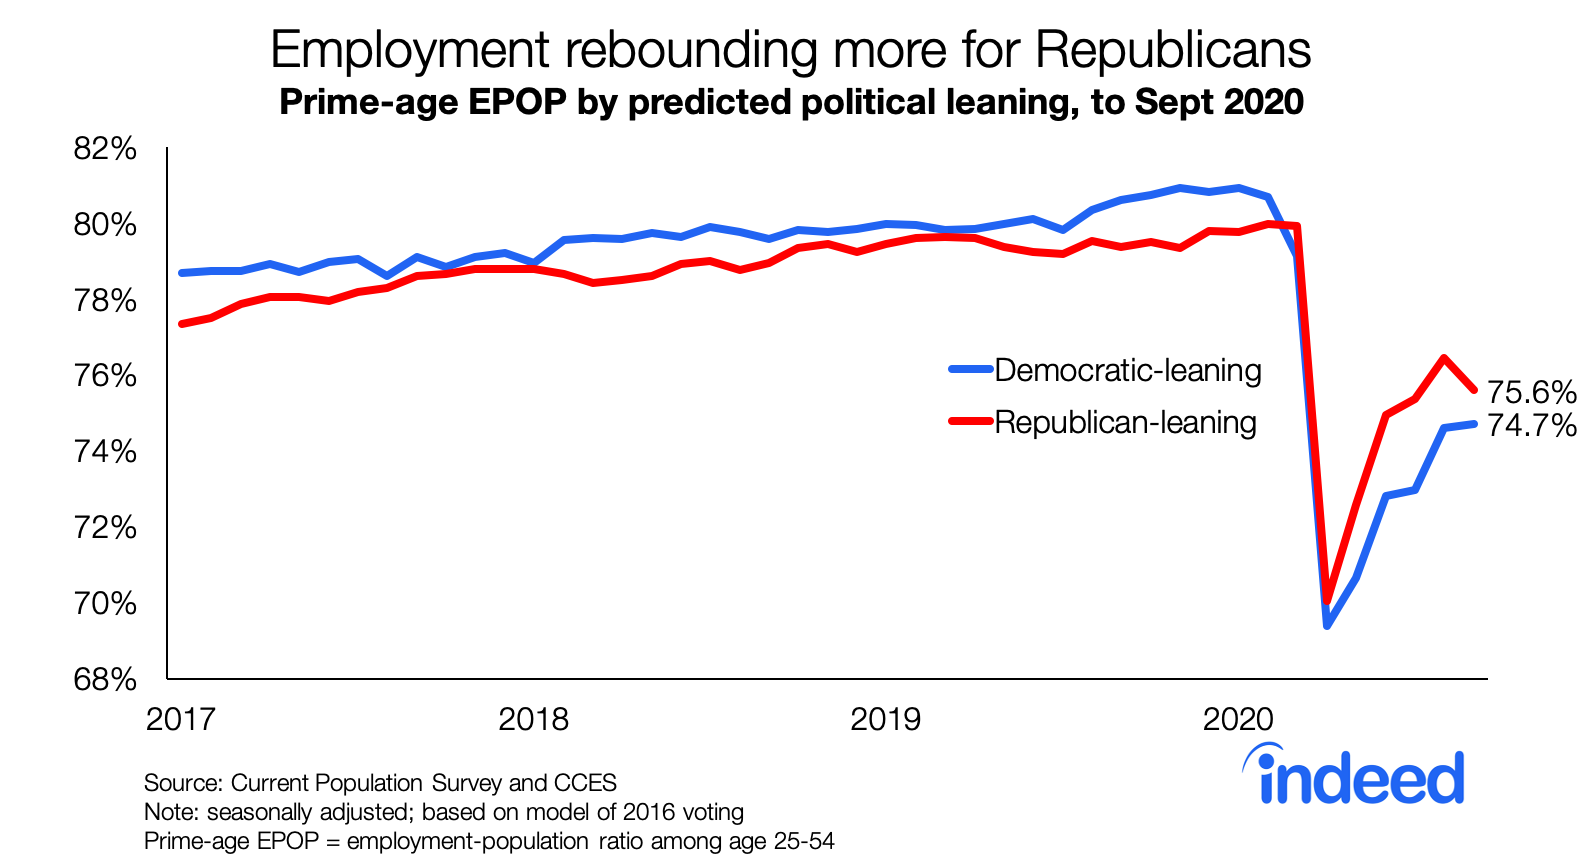
Job losses have been almost twice as large in blue states as in red states. Unemployment was almost three percentage points higher for Democrats than Republicans in September. A broader measure, the share of prime-working-age adults 25 to 54 who are employed, now looks better for Republicans than for Democrats — a reversal from the pre-pandemic trend.
Democrats are doing worse because the pandemic has fallen hardest on sectors and places that lean blue. In this recession, services have lost more jobs than goods-related sectors, unlike all other recessions in recent decades. Services tend to be clustered in bluer places like larger metros and their central cities, while goods industries like manufacturing and mining tend to be in redder places. Plus, school and daycare closures have pushed childcare responsibilities to parents. Employment of mothers has fallen much more than that of fathers, and women are more likely to vote Democratic — adding to the partisan unemployment gap.
Our survey reveals a range of partisan differences in pandemic effects. Democrats were more likely than Republicans to get laid off, work fewer hours, or lose work-related income — in part because the hardest-hit sectors of leisure & hospitality and personal services disproportionately employ Democrats. At the same time, Democrats were more likely than Republicans to work from home more — since work-from-home sectors like professional services, finance, and tech also tend to skew blue.
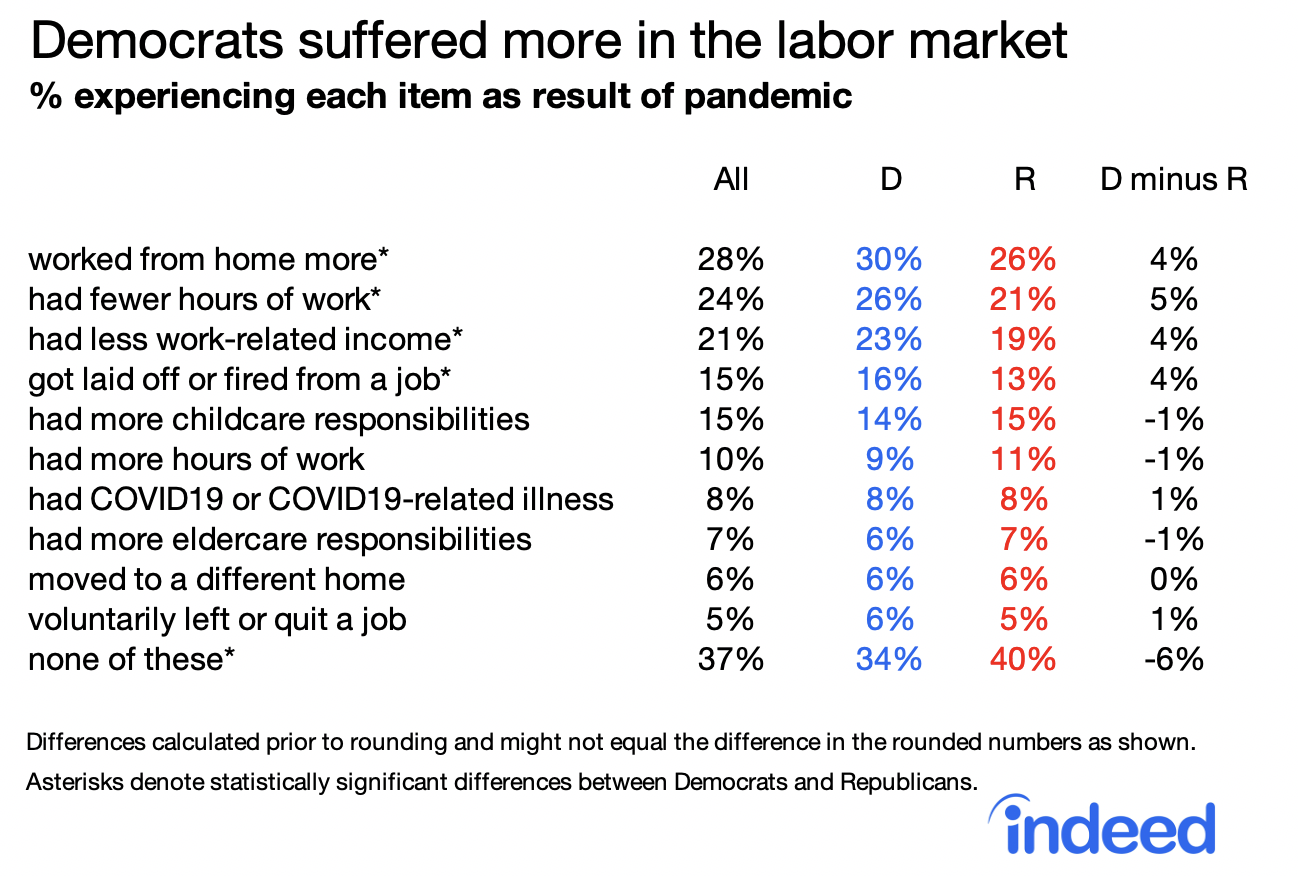
There weren’t statistically significant differences between Democrats and Republicans in whether they or others in their household got sick, had more caregiving responsibilities, or moved to another home. The virus has sickened and killed people in both blue and red America, with Democratic-leaning places suffering more in the spring and Republican-leaning places more in summer and autumn. The economic effects have been more severe for Democrats and bluer places not primarily because of different infection rates or containment policies, but because of where the economic sectors most affected by the pandemic are located and who tends to work in them.
How coronavirus has changed policy views
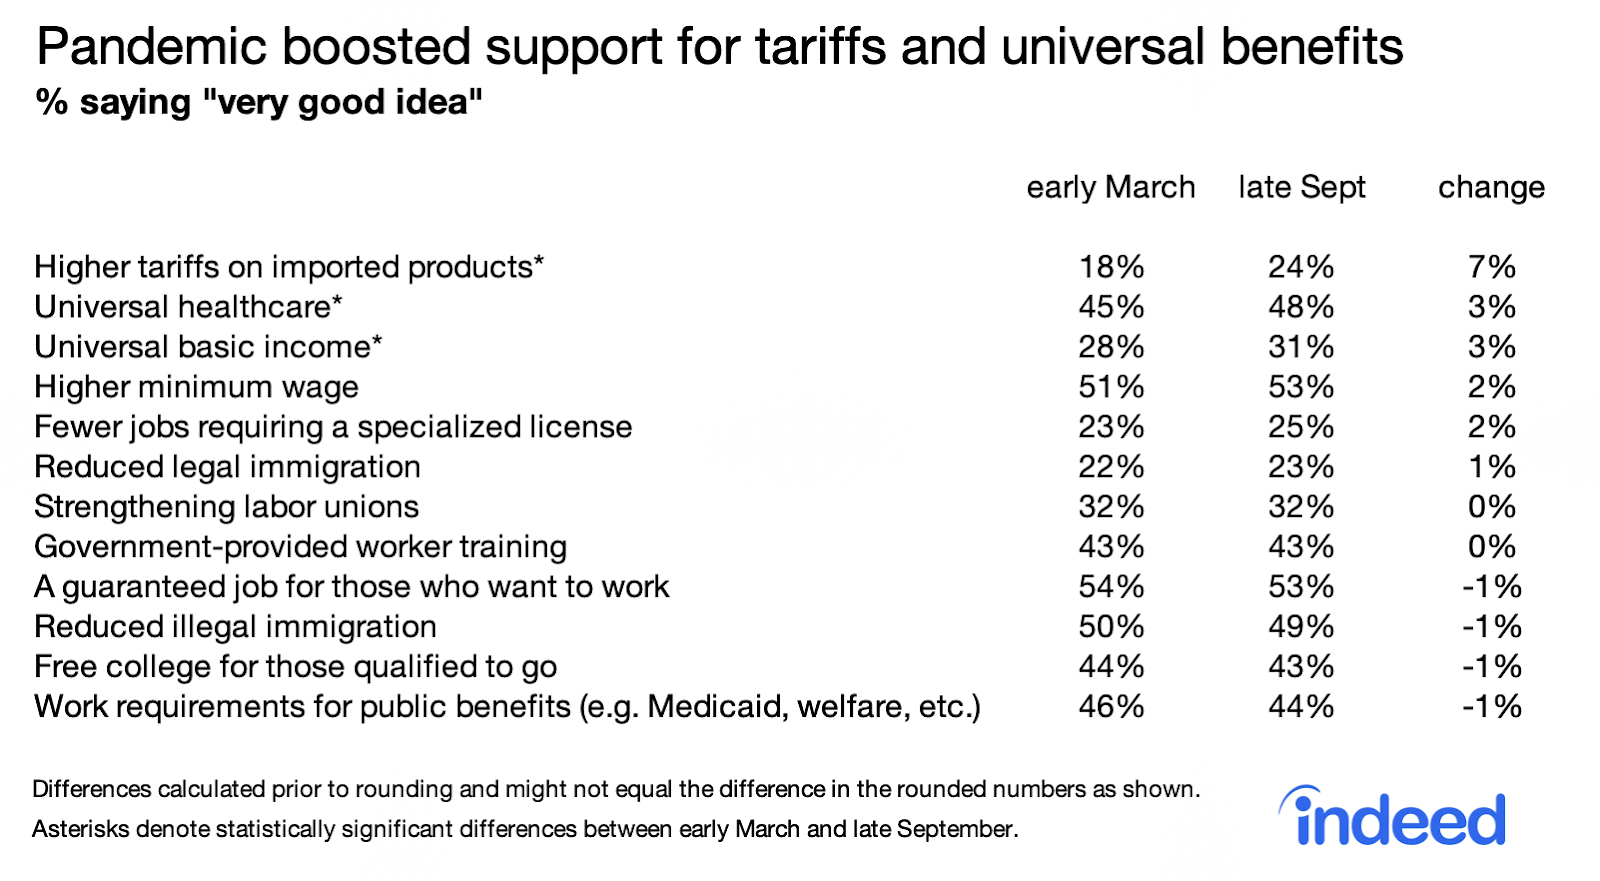
The pandemic has changed people’s minds on some economic policies. Three of the 12 policies we asked about saw a statistically significant change in support.
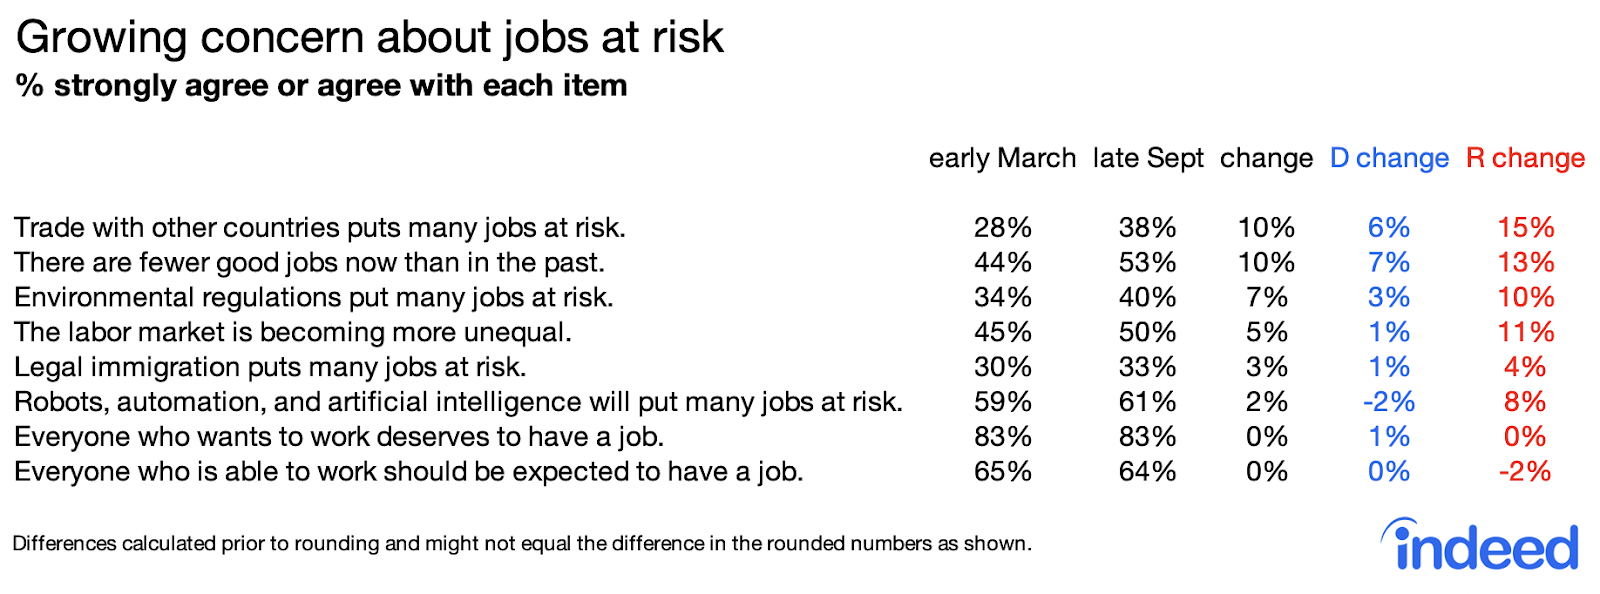
The biggest change was a jump in support for higher tariffs on imported products. In September, 24% of people said higher tariffs were a very good idea, up from 18% in March. Similarly, the share of people who agreed that “trade with other countries puts many jobs at risk” rose to 38% in September from 28% in March. The shares of people who thought environmental regulations, legal immigration, and automation put many jobs at risk also rose, but the increases weren’t as large as for trade. In sum, the pandemic has raised worries about trade and support for tariffs specifically — and worries about job losses in general.
The other notable change was an increase in support for universal healthcare and universal basic income, which rose three percentage points in both cases. The pandemic has created widespread health and economic stress, which might have increased support for these benefits. Alternatively, expanded government benefits like the $1200 stimulus payments and enhanced unemployment insurance have been popular, perhaps boosting interest in broader universal benefits.
Despite rising support for some policies among both Republicans and Democrats, stark partisan differences in views remained. Democrats favored universal healthcare by 33 percentage points more than Republicans in the September survey, while Republicans supported reducing illegal immigration by 35 percentage points more than Democrats.
Overall though, the pandemic has brought the views of Democrats and Republicans closer on some issues. Republican support for both universal healthcare and universal basic income rose six percentage points from March to September versus just one point for Democrats, though Democrats still support these policies more strongly.
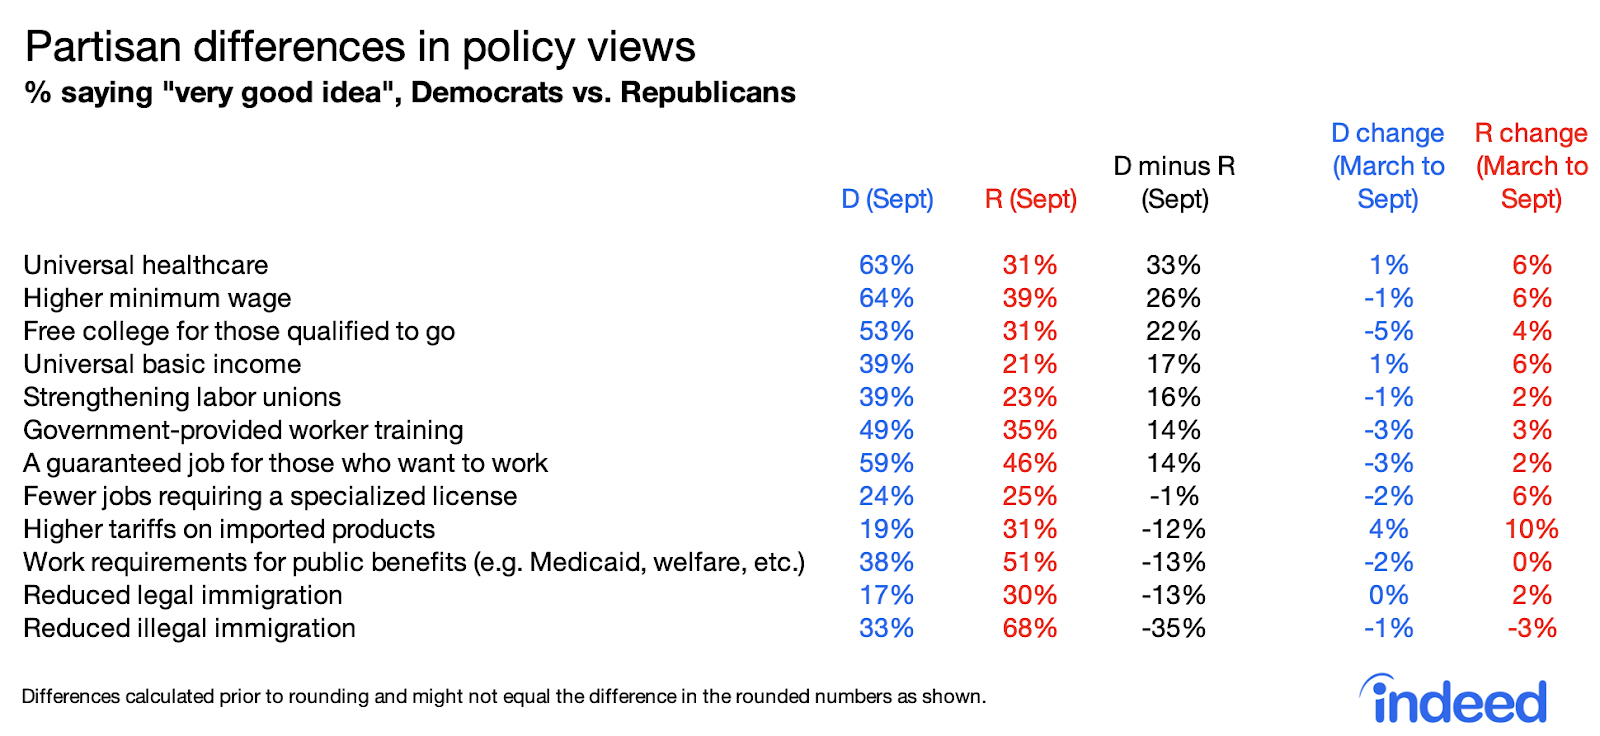
Partisan differences narrowed on other economic questions too. The share of Democrats who agreed that the labor market is becoming more unequal rose to 56% from 55%, but Republican agreement rose to 43% from 32% — an 11 percentage point jump that cut the partisan gap almost in half.
It’s far too soon to say whether these shifts in policy support will outlive the pandemic. The growing interest in universal healthcare and universal basic income, as well as heightened concern about trade and greater desire for tariffs, could reverse as the economy heals. And, of course, the November election could bring dramatic shifts in economic confidence and policy support, setting the stage for policy changes.
Methodology
This blog post is based on two online surveys of US adults age 18+, conducted by Indeed. The first was done from February 21 to March 6 with 2000 respondents and the second from September 21 to 28 with 4004 respondents. Weights were applied to each survey in order to match respondent distributions across age, educational attainment, race/ethnicity, and sex with the 2020 Current Population Survey’s Annual Social and Economic Supplement.
The same weighting scheme was applied to both samples. But, as an additional check, we compared the rise in unemployment in our survey with unemployment data from the Current Population Survey as published by the Bureau of Labor Statistics. Our survey asked about unemployment differently than the Current Population Survey, but, like the CPS, included temporary layoffs. The share of our survey respondents who were either unemployed temporarily or unemployed and looking for work rose from 4.9% in late February and early March to 9.4% in late September. BLS reported that unemployment not seasonally adjusted rose from 3.8% in February to 7.7% in September, not accounting for a misclassification issue that slightly understates the true increase in unemployment. Because of different definitions, the levels don’t line up perfectly. But our surveys do show a seven-month increase in unemployment, similar to official data.
All respondents were classified as either Democrats or Republicans based on the party they identify with or lean toward for independents and others.
All sums and differences are calculated before rounding. Thus, reported rounded sums and differences might not equal the sums and differences of reported rounded numbers.