Key points:
- Personal financial advisor, physician, and real estate broker and sales agent are among the occupations with the widest pay ranges.
- Pay inequality within occupations is not primarily driven by worker education levels, demographics such as race or gender, or even an occupation’s median wage.
- Instead, other factors — such as sky-high pay for superstars — could be fueling pay disparities in certain occupations.
- Workers making career decisions should think not just about typical wages in an occupation, but also about its range of pay.
When we talk about “good” jobs, we’re usually referring to the average pay workers make within an occupation. But average pay can mask huge variations. Workers should think about their willingness to tolerate a range of salaries in the occupation they pursue and not just focus on what the typical worker makes. The typical wages they see in salary lists aren’t necessarily what their pay will actually be.
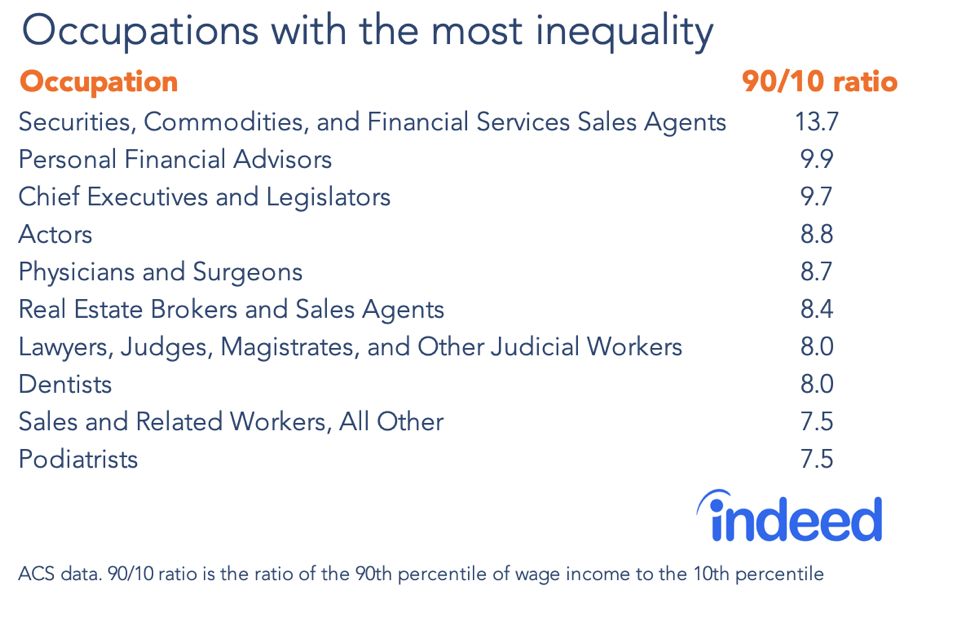
We’ve determined which occupations have the most inequality in annual pay and which have the least based on an analysis of US Census Bureau data. Among the occupations with the widest pay ranges are personal financial advisor, physician, and real estate broker and sales agent.
In itself, occupational pay inequality shouldn’t scare job seekers away. To take an extreme example, chief executive is an occupation with high inequality. But, of course, many CEOS are very happy with their compensation. Workers should think about their willingness to tolerate a range of salaries within their chosen profession and not just focus on what the typical worker makes.
Inequality within occupations is not primarily about workers’ education levels, demographics such as race or gender, or even the median wage in that occupation. Instead, other factors — such as sky-high pay for superstars — could be skewing pay ranges.
Which occupations have the most inequality in pay and which the least?
The occupations with the highest inequality include a wide range of professions, such as dentist; actor; and securities, commodities, and financial services sales agent. Financial and sales occupations — which may have year-to-year earnings volatility — have especially high inequality. In addition, many higher-wage jobs in the healthcare industry are on the most-unequal list.
The occupations with the tightest pay bands include some mid- and lower-wage jobs in healthcare, such as nurse practitioners, phlebotomists, and occupational therapists. Postal service jobs also have narrower pay ranges.
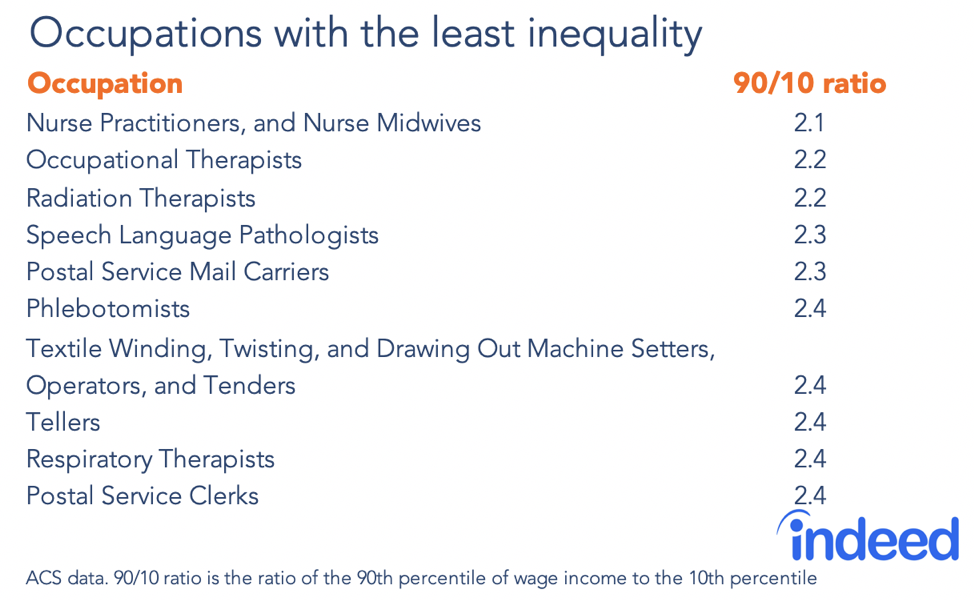
Overall, an occupation’s inequality isn’t correlated with its median wage. In other words, just because an occupation is lower paid doesn’t mean salaries fall in a narrow range. Similarly, just because an occupation is higher paid doesn’t mean that pay ranges widely. For instance, the median wage for securities, commodities, and financial services agents and radiation therapists are both about $80,000. But the former is the occupation with the highest inequality, while the latter is one of the least unequal. Workers should remember that the typical wages they read about in salary lists aren’t necessarily a guarantee of what their wages might turn out to be.
What role do worker educational levels and demographics play?
We know that factors like education level and demographics such as race or sex are related to an occupation’s median wage. But are they related to inequality within an occupation?
The overwhelming majority of pay inequality in an occupation doesn’t appear to be driven by education or demographic characteristics. After adjusting for worker characteristics, average pay inequality in an occupation barely drops. So while worker characteristics such as education, race, gender, age, and industry play a role, it’s a small one.
These results are not to say that education, race, gender, age, and industry do not affect workers’ economic outcomes. But they do show that inequality in an occupation remains relatively similar even after accounting for worker demographic characteristics in that occupation.
These results are consistent with other literature that emphasizes how important occupation is in determining workers’ economic circumstances. For instance, occupation and industry differences between men and women explain about half of the gender pay gap because men are more likely to work in occupations with higher pay. The gender pay gap after women give birth is also affected by the occupations women move into. Black workers are also more likely to end up in lower-paid occupations.
What contributes to wider pay range in a profession?
Since an occupation’s pay inequality changes little after adjusting for worker characteristics like education, other factors could be causing the disparity, such as:
- Large variations in year-to-year income, for example, in jobs with commissions or variable bonuses.
- A low likelihood of success for most workers, but jackpots for a few.
- High pay for superstars.
- Differences within occupations, such as dermatologists versus general practitioners in the physician occupation
- Unequal profits which could mean workers who end up at a superstar firm get outsized pay (think of a chief executive at a superstar business versus the CEO of a typical company).
Consider the occupation of actor. Most workers in these occupations have a low likelihood of success. But a few big exceptions, such as movie stars, collect enormous sums. And income in an occupation such as sales can be highly variable — a high earner one year can become a low earner the next year.
The fact that demographics do not account for most occupational pay inequality shows the importance of the job choice workers make in determining their economic situation. Some people may be fine in an occupation in which earnings range widely. Others may want an occupation with lower inequality, giving them confidence that their earnings will be close to the median. Job seekers should look at the full range of pay in an occupation before making a decision.
Methodology
We analyzed 2013, 2014, 2015, 2016, and 2017 American Community Survey 1-year data on annual wage and salary for full-time, full-year workers. We only included occupations with more than 100 observations. To determine how observables affected dispersion of wage and salary income in an occupation (standard deviation), we predicted the expected log wage from a regression with controls for age, sex, education, race, and industry. We did not control for location because of statistical power issues. We then looked at the residuals from that regression and how the standard deviation changed once those controls were added. Regressions were done separately by occupation to allow the returns to factors such as education to vary for each occupation. On average, inequality by occupation was about 12% lower accounting for these controls. Weighting by the size of the occupation, it was only 11% lower. Taking the average of the differences by occupation, it was about 6% lower.
Accounting for these observable factors led to a standard deviation correlated about 94% with the standard deviation of residuals from a regression on log wage with no controls, suggesting that while these observables impact worker wages overall, they have less effect on inequality in an occupation. As a check, we ran correlations for inequality in an occupation as measured by unadjusted standard deviation with the share of workers in each demographic group. None of the correlations were strong. Different measures of inequality (90-10 ratio, 75-25 ratio, gini, and standard deviation) were all highly correlated with each other (above 80%). Wages were trimmed at the 99.5th and 0.5th percentile in each year and state.
Demographics were generally correlated with the median percentile in an occupation. Their effect on inequality appeared to be minimal.
Higher-paid occupations also did not appear to be more unequal. Overall, an occupation’s median wage was only correlated about -10% with its 90-10 wage ratio.