The unemployment rate is below 4% and wage growth is beginning to accelerate. This solid growth is the backdrop to the fast-approaching midterm elections. As Indeed’s Chief Economist Jed Kolko has written, the labor market recovery has crossed partisan lines, even though the midterms are unlikely to be dominated by economic issues.
To dive deeper, we analyzed economic changes at the Congressional district level using recently released 2017 Census statistics. From 2016 to 2017, economic changes were largely similar across all Congressional districts, whatever the political profile—competitive, solidly Democratic, or solidly Republican.
Specifically, we found economic conditions in competitive districts were no worse than those in solidly Democratic or Republican districts and, by some measures, these competitive districts were doing better economically.
Competitive districts had unemployment rates more similar to solidly Republican districts and median incomes similar to solidly Democratic districts.
The key question is how the strong economy will affect Congressional races in November. Normally, the economy doesn’t seem to matter much for midterm elections. As Paul Krugman has noted, nationwide job growth through November of midterm election years is uncorrelated with the change in seats held by the White House party. The midterms are more likely to be determined by national non-economic issues such as immigration and the Supreme Court, and how people feel about President Trump.
Nonetheless, voters do list the economy as among their top concerns. It could be, though, that likely voters are responding to economic conditions in their community or to long-run economic trends like automation or globalization. In competitive Congressional districts, the impact of tariffs and recent tax policy changes may vary widely—and the political repercussions could differ from place to place. While the nation as a whole is experiencing strong economic tailwinds, individual congressional candidates need to speak to the specific issues that are meaningful to voters in their districts.
District-level economic conditions
For this analysis, we used political ratings from The Cook Political Report, which rates Congressional districts as solid Republican, likely Republican, lean Republican, toss-up, lean Democratic, likely Democratic, and solid Democratic, with the five middle districts considered competitive. The three district groupings—solid Republican, competitive, and Democratic —are roughly equal in number. We did a separate analysis in which we defined competitive districts as the middle three groups—lean Republican, toss-up, and lean Democratic—but the results were not significantly different.
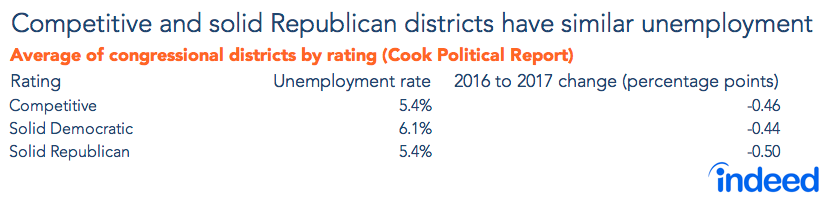
In competitive districts, the unemployment rate declined nearly 0.5 percentage points from 2016 to 2017 to an average of 5.4%. Solid Republican districts had a similar unemployment rate of 5.4% and equally large declines. But solid Democratic districts had a higher average unemployment rate of 6.1% with a similar decline.
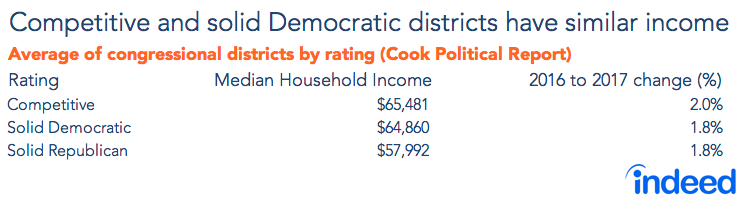
The median household income in competitive districts was $65,481 in 2017 and rose 2.0% in 2017 from the year before, adjusted for inflation. Income growth was essentially identical across all three district groups. But the starkest difference was in income levels. On average, solid Republican districts had median incomes about $7,000 lower than competitive or solid Democratic ones.
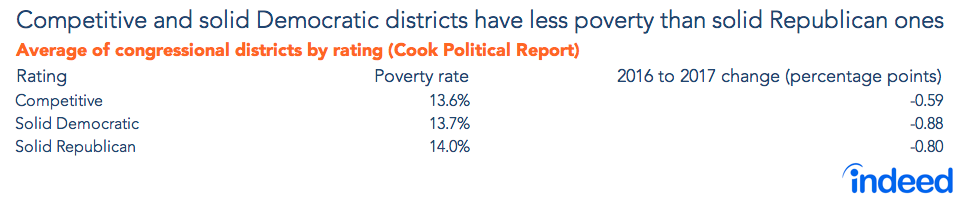
The average competitive district had a poverty rate of 13.6% in 2017, about the same as the typical solid Democratic district. But competitive districts had a smaller decline in poverty rates—just 0.6 percentage points—than noncompetitive districts. Solid Republican districts had slightly higher poverty rates and, alongside solid Democratic districts, posted the largest year-over-year poverty-rate declines—between 0.8 and 0.9 percentage point.
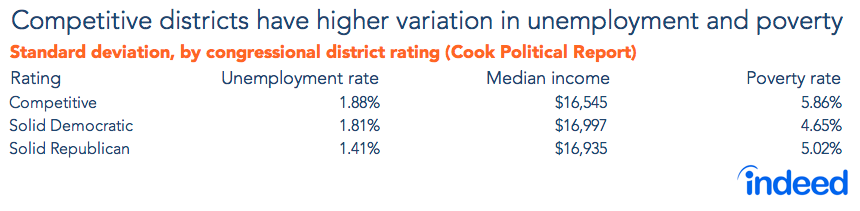
When comparing competitive districts to solid blue or red ones, variation in district economies is just as important as relative changes in unemployment, income, and poverty. Competitive districts have much higher variation in poverty rates. Like solid Democratic districts, competitive ones have more variation in unemployment rates than Republican districts. But these battleground districts have lower income variation (see table in the Appendix).
By and large, national issues like immigration and the Supreme Court are the prime focus this November. Economic issues may be important, but their political effect is likely to differ from district to district. Issues like the cap on deductions for state and local taxes, tariffs on specific industries or goods, or changes to the Affordable Care Act may affect different competitive districts in varying ways. In particular districts, the salience of these economic issues could cut through the otherwise frenzied national discourse and have real electoral impacts.
Methodology note
Congressional ratings come from The Cook Political Report as of October 16, 2018. Competitive districts are those that are toss-ups, lean Democratic, or lean Republican, as well as those that are likely Democratic or likely Republican, as those could potentially become competitive. Census data comes from the 2017 and 2016 American Community Surveys (1-year estimates). Median household income growth for 2017 was deflated using the 2017 Consumer Price Index Research Series (CPI-U-RS) inflation reading of 2.2%. The term “variation” is the standard deviation of the statistics presented, which are reported in the following table: