People move to find better opportunities. Even though mobility has declined in recent decades, jobs are the top reason people make longer-distance moves. Across the US, local markets differ and that means moving opens new options. One of the most important differences is how easy it is to find work. Today, the unemployment rate ranges from over 8% in several inland California metros to under 2% in Honolulu, Madison, WI, and Ames and Iowa City, IA. Low unemployment boosts local wage growth and, in theory, should draw newcomers.
And yet, the latest US Census Bureau population estimates, released this morning, show that many tight labor markets—where unemployment rates are especially low—aren’t drawing people in. Even though, on average, the working-age population grew faster in places where unemployment is lower, in some markets with low unemployment the population of that group barely budged. In fact, in a few tight markets—including Dubuque, IA, Sheboygan, WI, Honolulu, Roanoke, VA, and Manchester, NH—the working-age population fell.
Why don’t these tight metros attract workers? The reasons vary. In some, a high cost of living may be keeping people out. In others, long-term economic challenges and uncertain future opportunities are disincentives. Furthermore, growth patterns don’t change much over the long run. For the most part, today’s fast-growing metros are the same ones that have grown fastest in recent decades. And those that are growing slowly—or not at all—are usually ones that have been on that track for a long while.
The broad view: labor market tightness and population growth
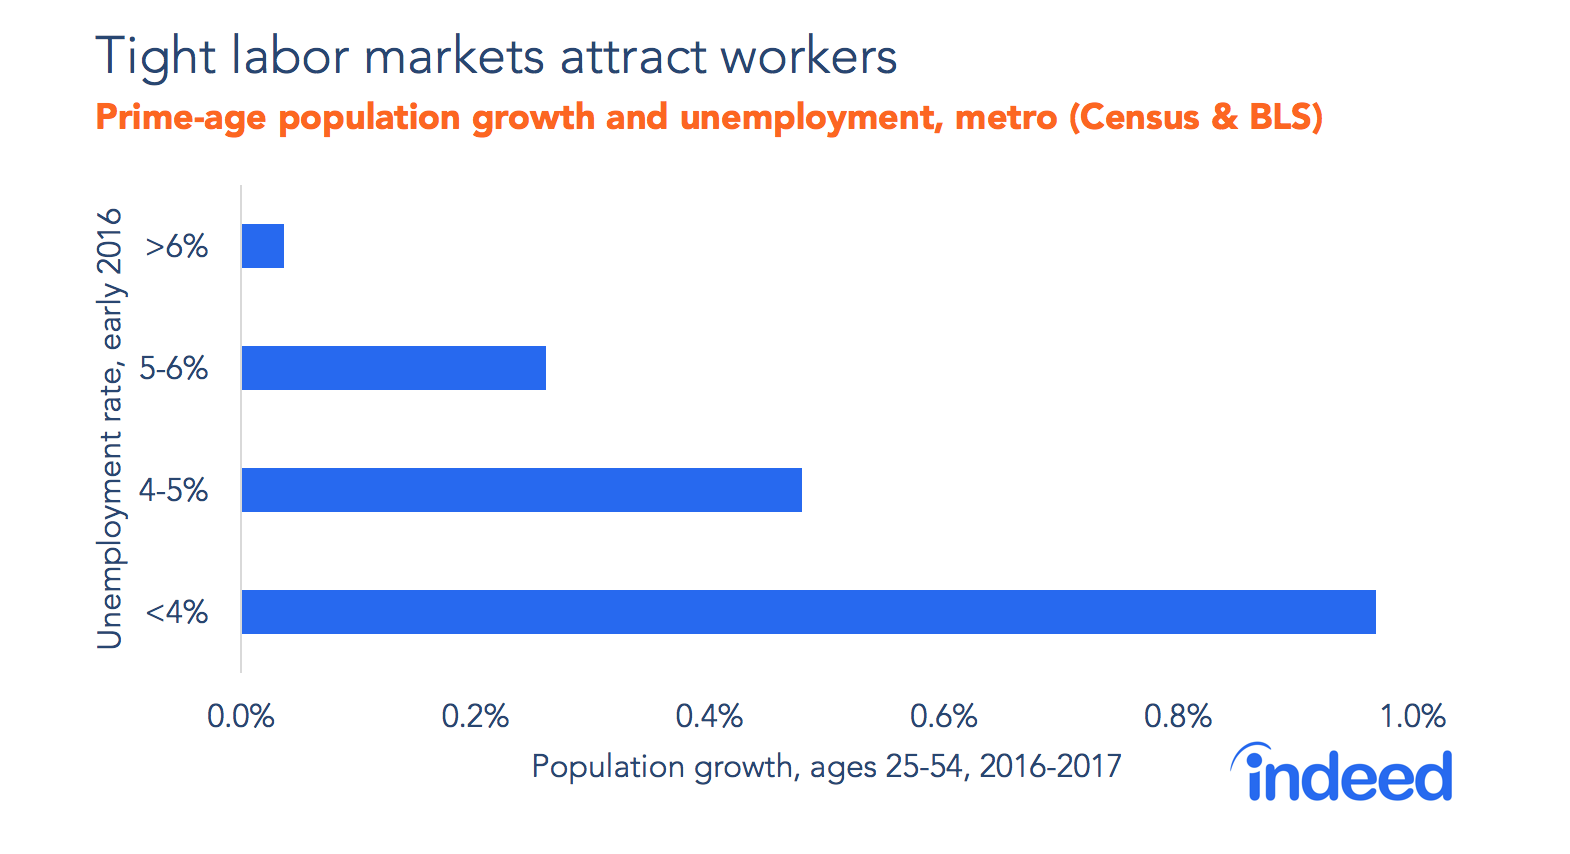
Overall, from mid-2016 to mid-2017, the working-age population grew faster in metropolitan areas where unemployment was low in the first half of 2016. (See note for sources and methodology.) In metros with unemployment below 4%, the working-age population grew almost 1%. In some especially tight markets, such as Austin and Provo-Orem, UT, the population grew substantially. By contrast, in metros with unemployment above 6%, the working-age population hardly increased.
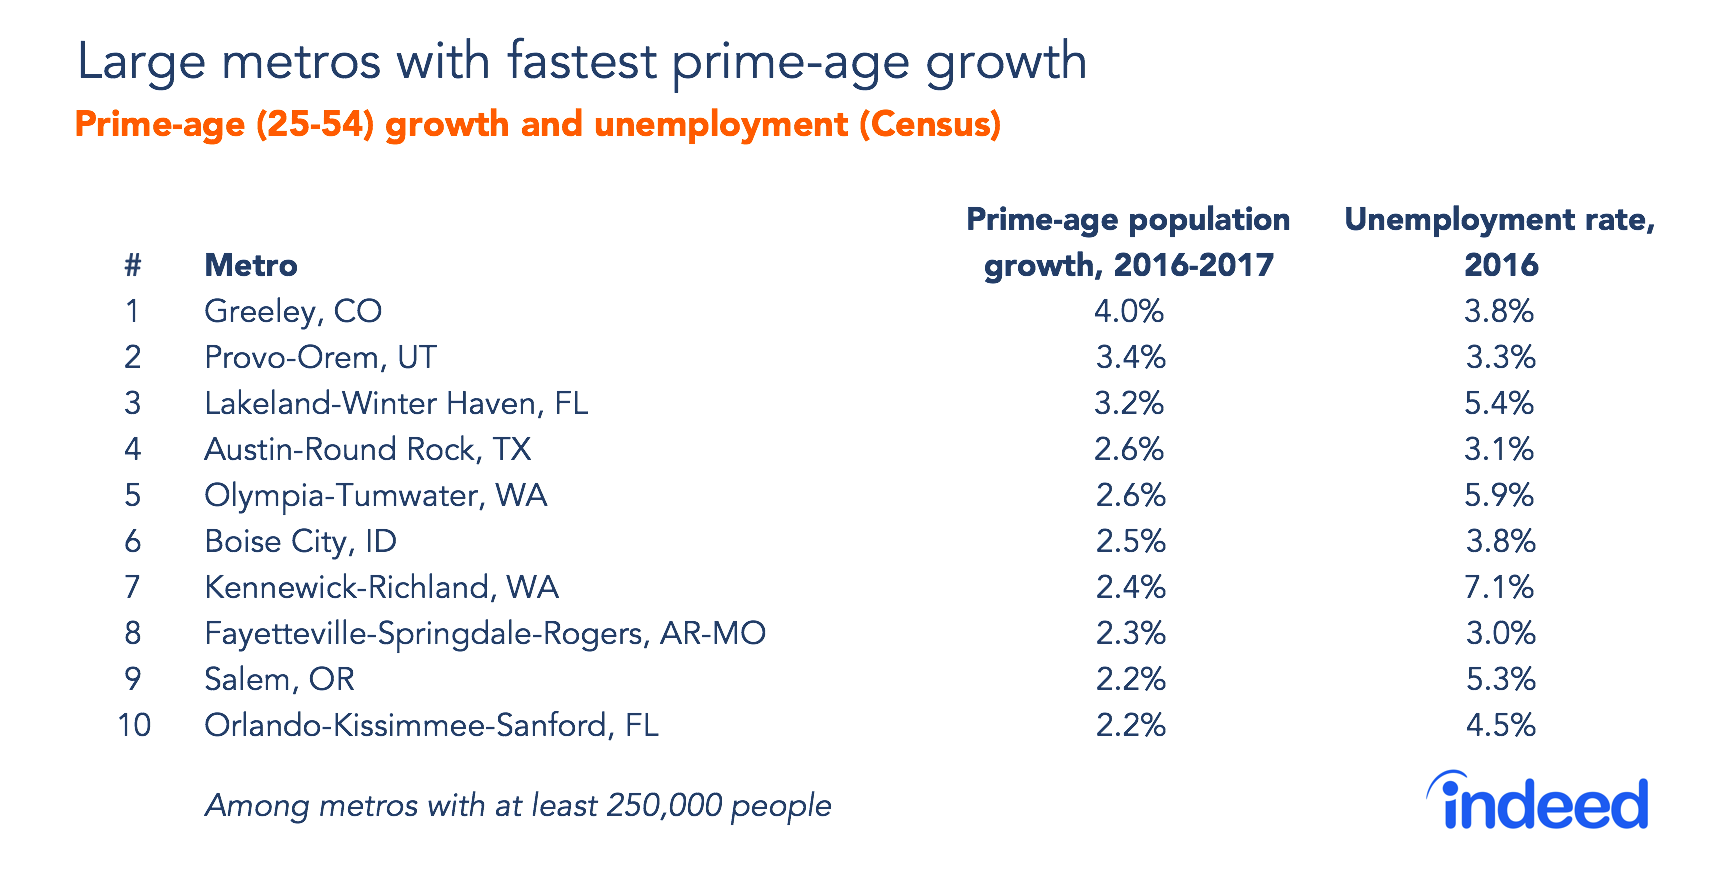
However, even though tighter markets grew faster on average, lots of metros bucked the trend. Metros in inland California, such as Bakersfield and Merced, where unemployment rates are among the highest in the country, grew faster than the national average. And the metros with the fastest-growing working-age population include not only very tight labor markets like Austin, but also metros with higher unemployment rates such as Lakeland-Winter Haven, FL, and Olympia and Kennewick in Washington State. The bottom line: There’s a relationship between local unemployment rates and working-age population growth, but it’s weak.
In other words, a low unemployment rate may help draw people, but it’s far from the only reason people move.
Housing costs keep people out of some tight labor markets
Let’s take a closer look at tight labor markets where the working-age population grew slowly or even fell.
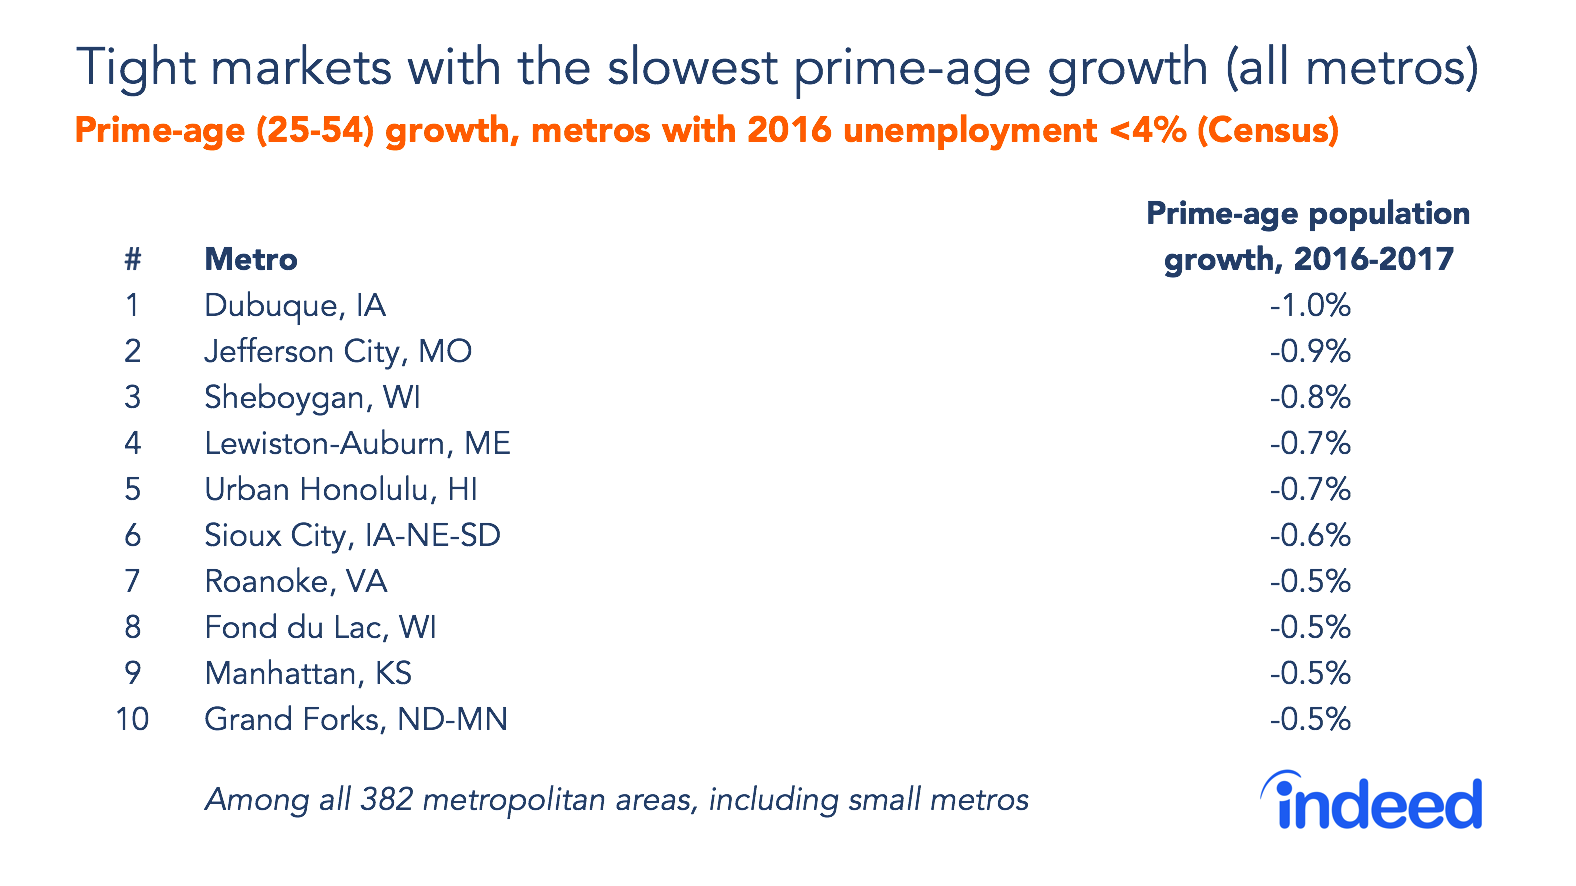
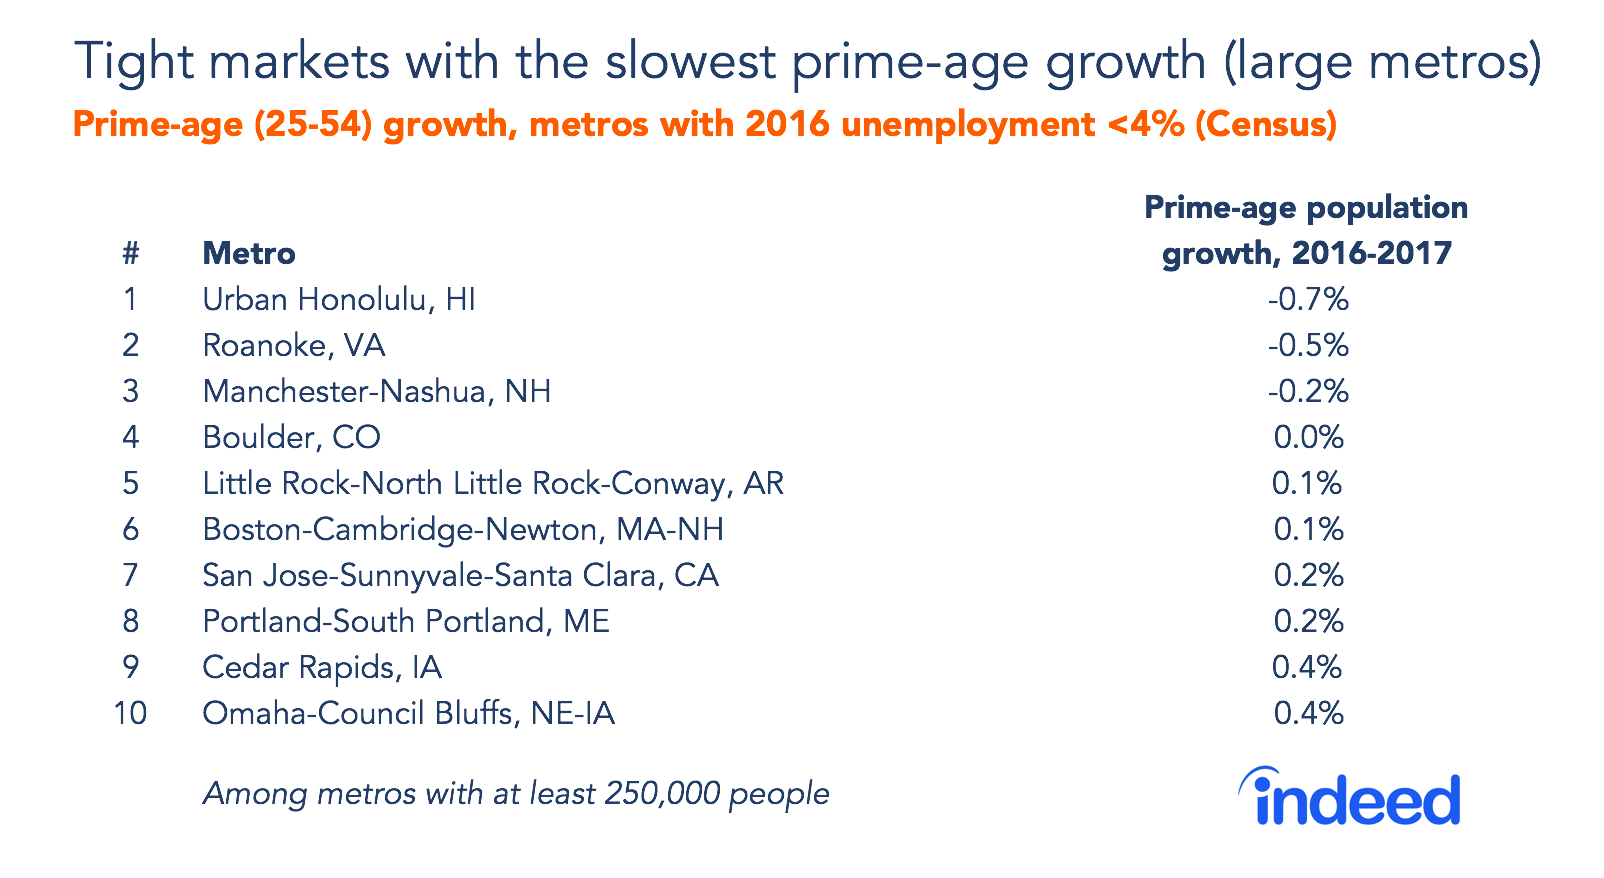
Roughly one-fifth of metros had unemployment rates below 4% in early 2016. Of those strong labor markets, the working-age population shrank most in Dubuque, IA, Jefferson City, MO, and Sheboygan, WI. In fact, seven of the 10 tight markets with the biggest working-age population losses are smaller metros in the Midwest and Great Plains.
Among larger metros with tight labor markets that grew slowly, many are expensive. Two—Honolulu and San Jose—are among America’s most expensive metros. Manchester, NH, Boulder, CO, and Boston also have living costs above the national average. Numbers 11 and 12 on the slow-growth, tight markets list—Washington, DC, and San Francisco—are notoriously pricey metros. Thus, high cost of living keeps people out of some tight labor markets—an observation consistent with academic research findings that high-cost housing discourages people from moving to productive local markets.
High housing costs have a flip side. They can push people to nearby metros that are more affordable—even if those nearby metros have relatively high unemployment. In Las Vegas, Spokane and several inland California metros, the working-age population grew well above the national average despite local unemployment above 6%. Although these inland western metros aren’t that affordable by national standards, they’re much cheaper than their Pacific Coast neighbors.
Today’s tight markets might not offer future job growth
Housing costs aren’t the whole story. Dubuque, Jefferson City, and Sheboygan are all relatively affordable tight labor markets, but their working-age populations are shrinking. What else is going on?
Let’s zoom in further, comparing affordable tight markets that aren’t attracting workers, such as Dubuque and Sheboygan, with affordable tight markets where the working-age population is booming, such as Provo and Boise, ID. One key difference between the Dubuques and the Boises is future local job prospects. On average, the tight markets attracting workers have a more favorable mix of occupations for future growth than the tight markets that aren’t attracting workers.
This makes sense. People considering a move for better opportunities should have an eye to the future. Moving is costly—and Americans move less than they used to. Some people can pick up, move to a boom-and-bust fracking town, and then move on a year or two later, but most people want to put down deeper roots. Their time horizon is longer. People with those priorities should factor in not just current market conditions as reflected in the unemployment rate, but also future economic prospects. Places with the lowest unemployment rate today aren’t necessarily those with the best prospects for future job growth.
Of course, when deciding to make a move, even people of working age consider more than the current state of the local labor market. Quality of life, community, weather, and amenities can all matter—and these don’t necessarily change with the ups and downs of the economy. In fact, with few exceptions, the places where the working-age population grew quickly in the past year are those where growth has been strong over many decades. That might give pause to Wichita, the state of Vermont and other places that are paying people to relocate there. These efforts might make little dent in their growth patterns. Tight labor markets that have traditionally grown slowly might continue to struggle. But places that attracted people in the past will probably continue to do so.
Methodology
Data on prime-working-age population growth are for July 1, 2016 to July 1, 2017, and are from the US Census Bureau’s Population Estimates program, released June 21, 2018. Unemployment rates are the average for January through June, 2016, and are from the US Bureau of Labor Statistics. Because population growth affects local labor supply and unemployment rates, we compare unemployment rates to subsequent population changes. Unemployment rates are generally lower today than in 2016. Cost of living data are from the Bureau of Economic Analysis. Occupational-mix-projected growth is explained here.
The analysis covers the 382 metropolitan areas as defined by the Office of Management and Budget in 2015. Of these, 185 had a population of at least 250,000 as of the 2010 Census. The prime working-age population (25-54) grew 0.48% from 2016 to 2017 in metropolitan areas and 0.35% nationally. The overall population grew more–0.82% in metropolitan areas and 0.72% nationally–thanks to the faster-growing senior population.
This analysis uses the change in the prime-age population rather than the change in population due to migration, which the Census published for local areas in March 2018. The Census reports migration rates only for the population overall, not by age group. In some metros, a notable share of migration is retirees, whose moving decisions wouldn’t be affected by the same labor market dynamics as those of working-age adults. Across all metros, the correlation between the all-ages migration rate and the change in working-age population is 0.80. The gap is highest for metros with high shares of retirees such as Naples, FL, and Myrtle Beach, SC. The key findings in the analysis hold even if the all-ages migration rate is used instead of the working-age population change.
More detailed results:
- The correlation between the unemployment rate and working-age population change is -0.13 for all metros and -0.16 for metros with at least 250,000 people. Both are statistically significant at the 5% level, but of weak magnitude.
- In a regression of working-age population change on several variables, among metros with under 5% unemployment, the coefficients are negative for cost of living and positive for occupation-mix-projected growth, both statistically significant. Other controls include the unemployment rate and the log of metro population. Cost of living and occupation-mix-projected growth are themselves strongly positively correlated.
- The correlation with 1980-2016 all-age population growth is 0.65 for 2016-2017 prime-age population growth and 0.73 for 2016-2017 all-age population growth for all 382 metros. These correlations are 0.70 and 0.76 respectively for metros with populations of at least 250,000.