As 2016 ends, the U.S. labor market is in its best shape since the recession, with nearly every measure of the market at its most favorable level in years. At the same time, economic confidence has improved only slightly in recent years (though it jumped after the election). Concerns about the job market are widespread, and not just among Donald Trump’s voters who want to bring back manufacturing jobs but also among Silicon Valley types who are worried that automation and the gig economy could mean the end of work as we know it.
With the sustained and continued recovery, why do job-market worries persist? For starters, recent labor data aren’t quite as good as they first appear. Plus, the overall U.S. numbers hide big differences across industries, regions, and demographic groups, some of whom are faring badly. And finally, now that the labor market is far from the acute crisis of the recession, the market’s chronic conditions are easier to see and perhaps more possible to address.
Where the U.S. Labor Market Stands
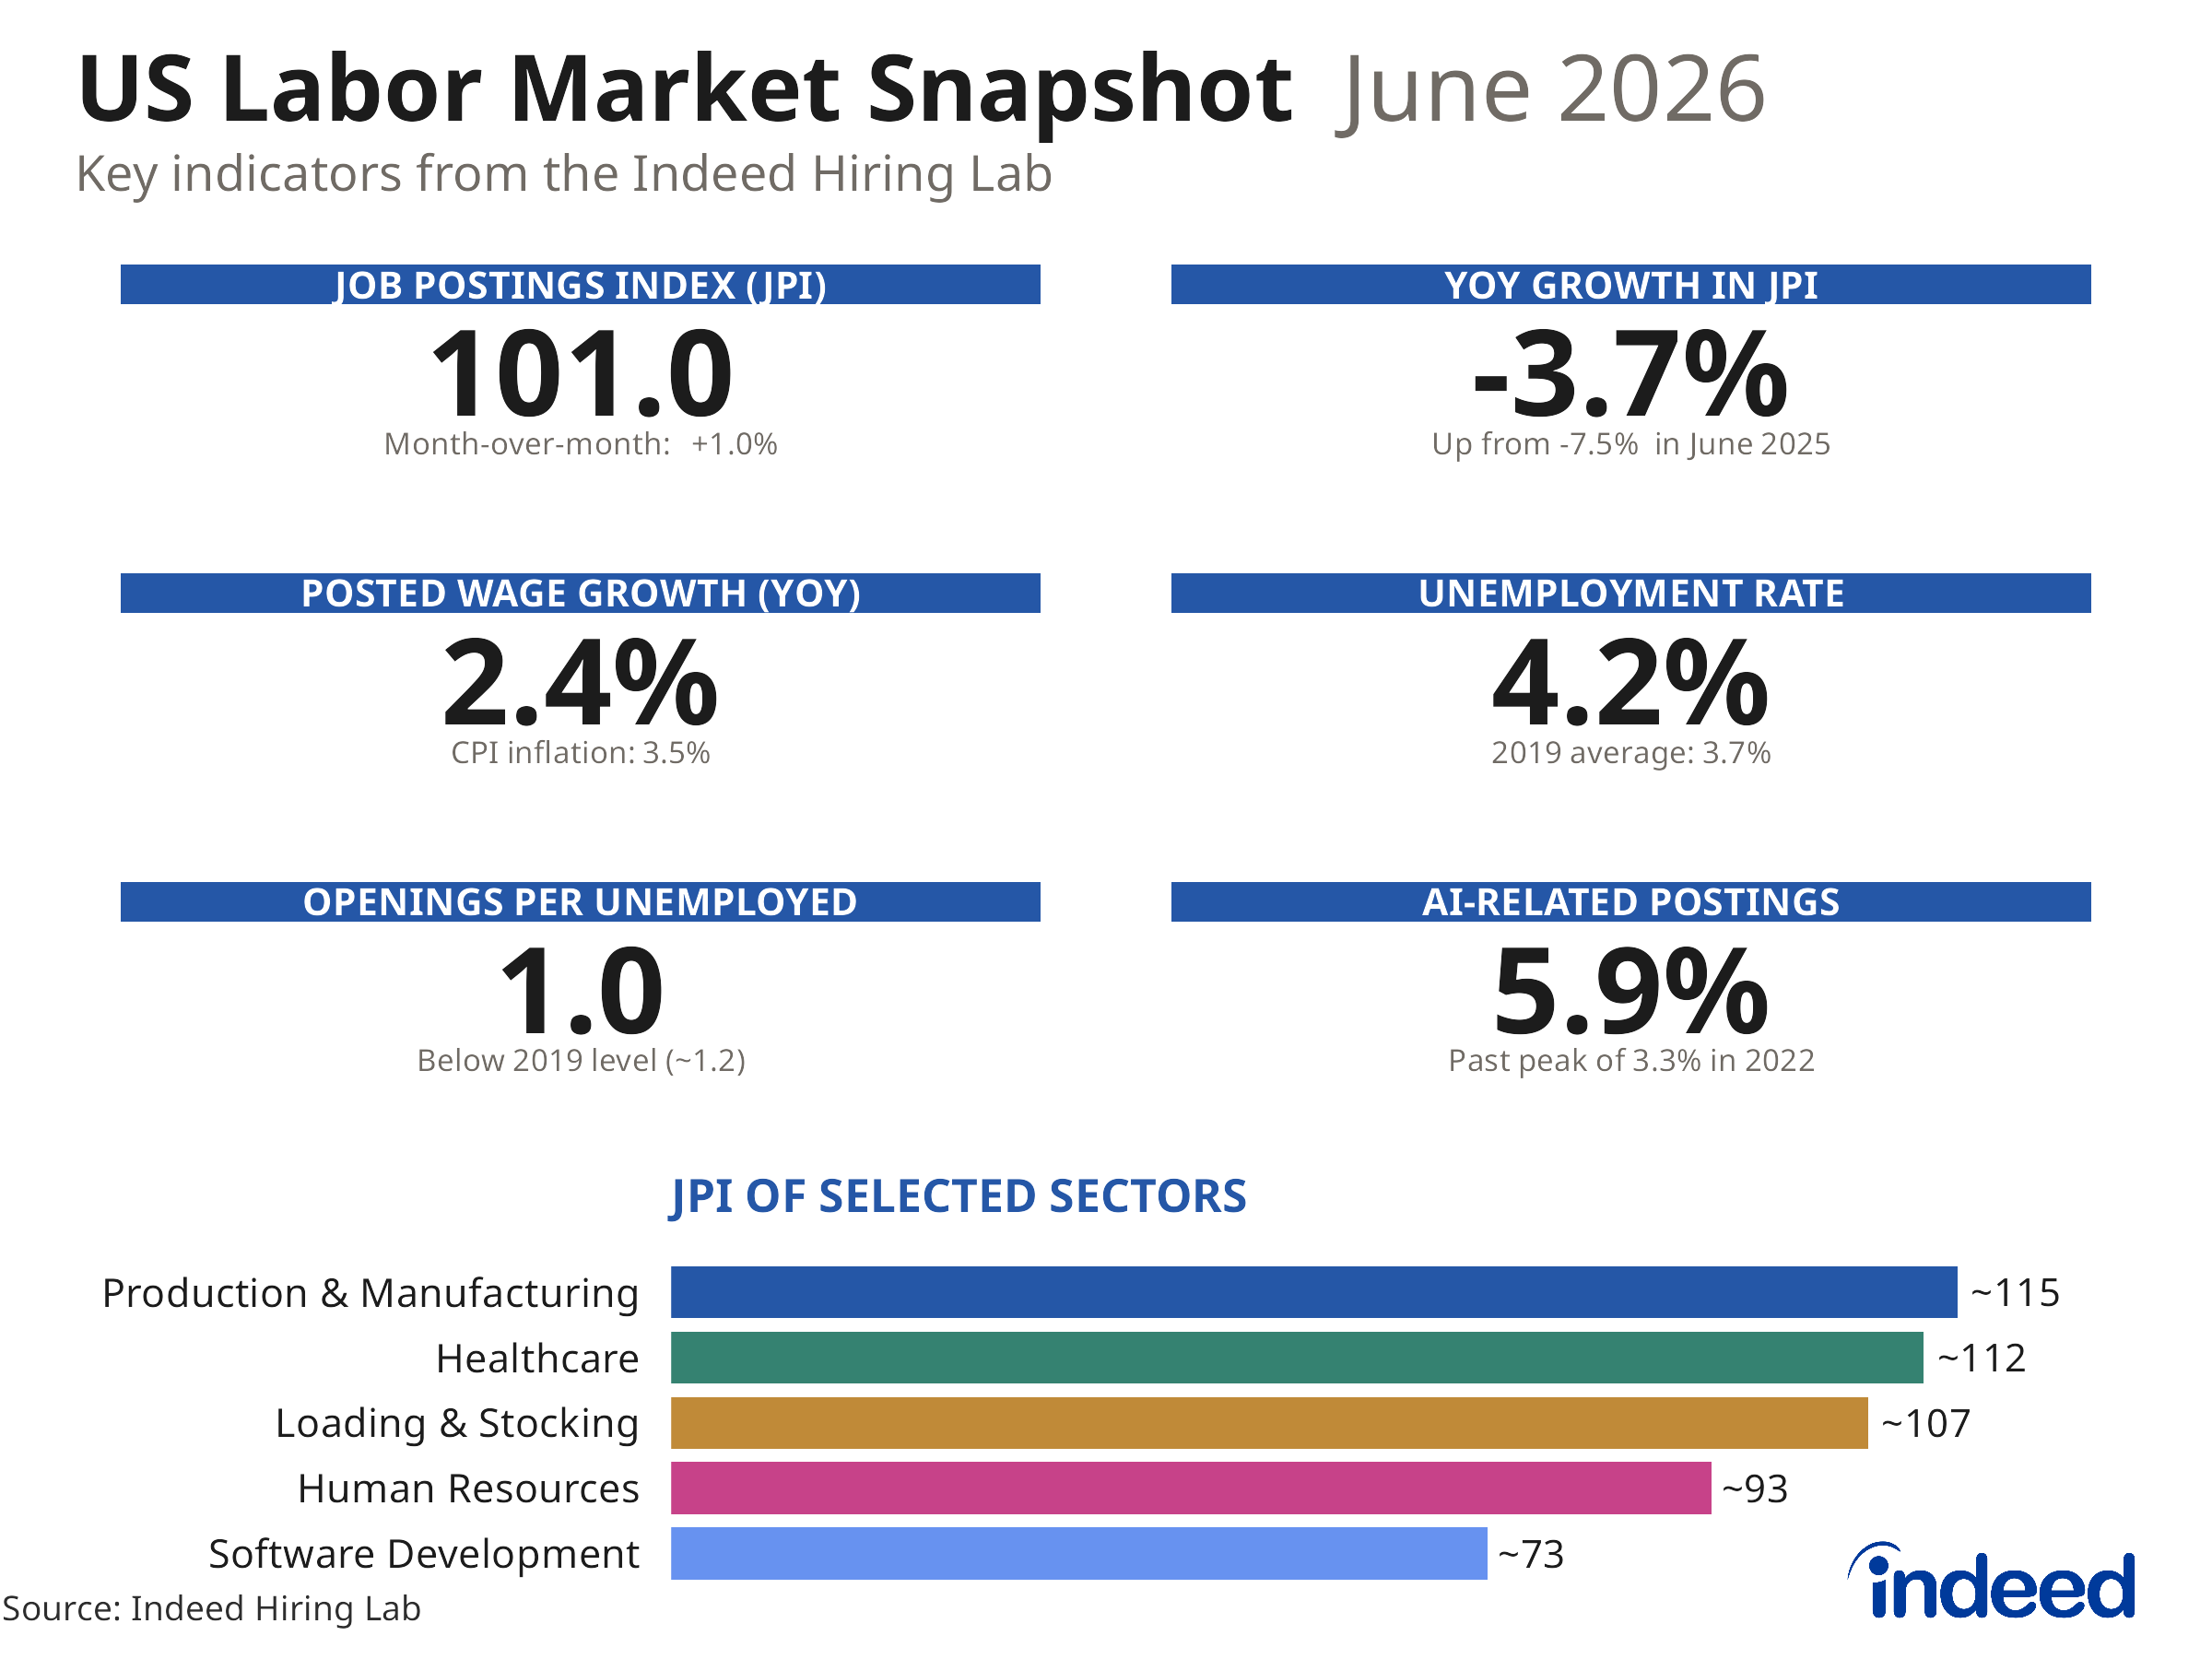
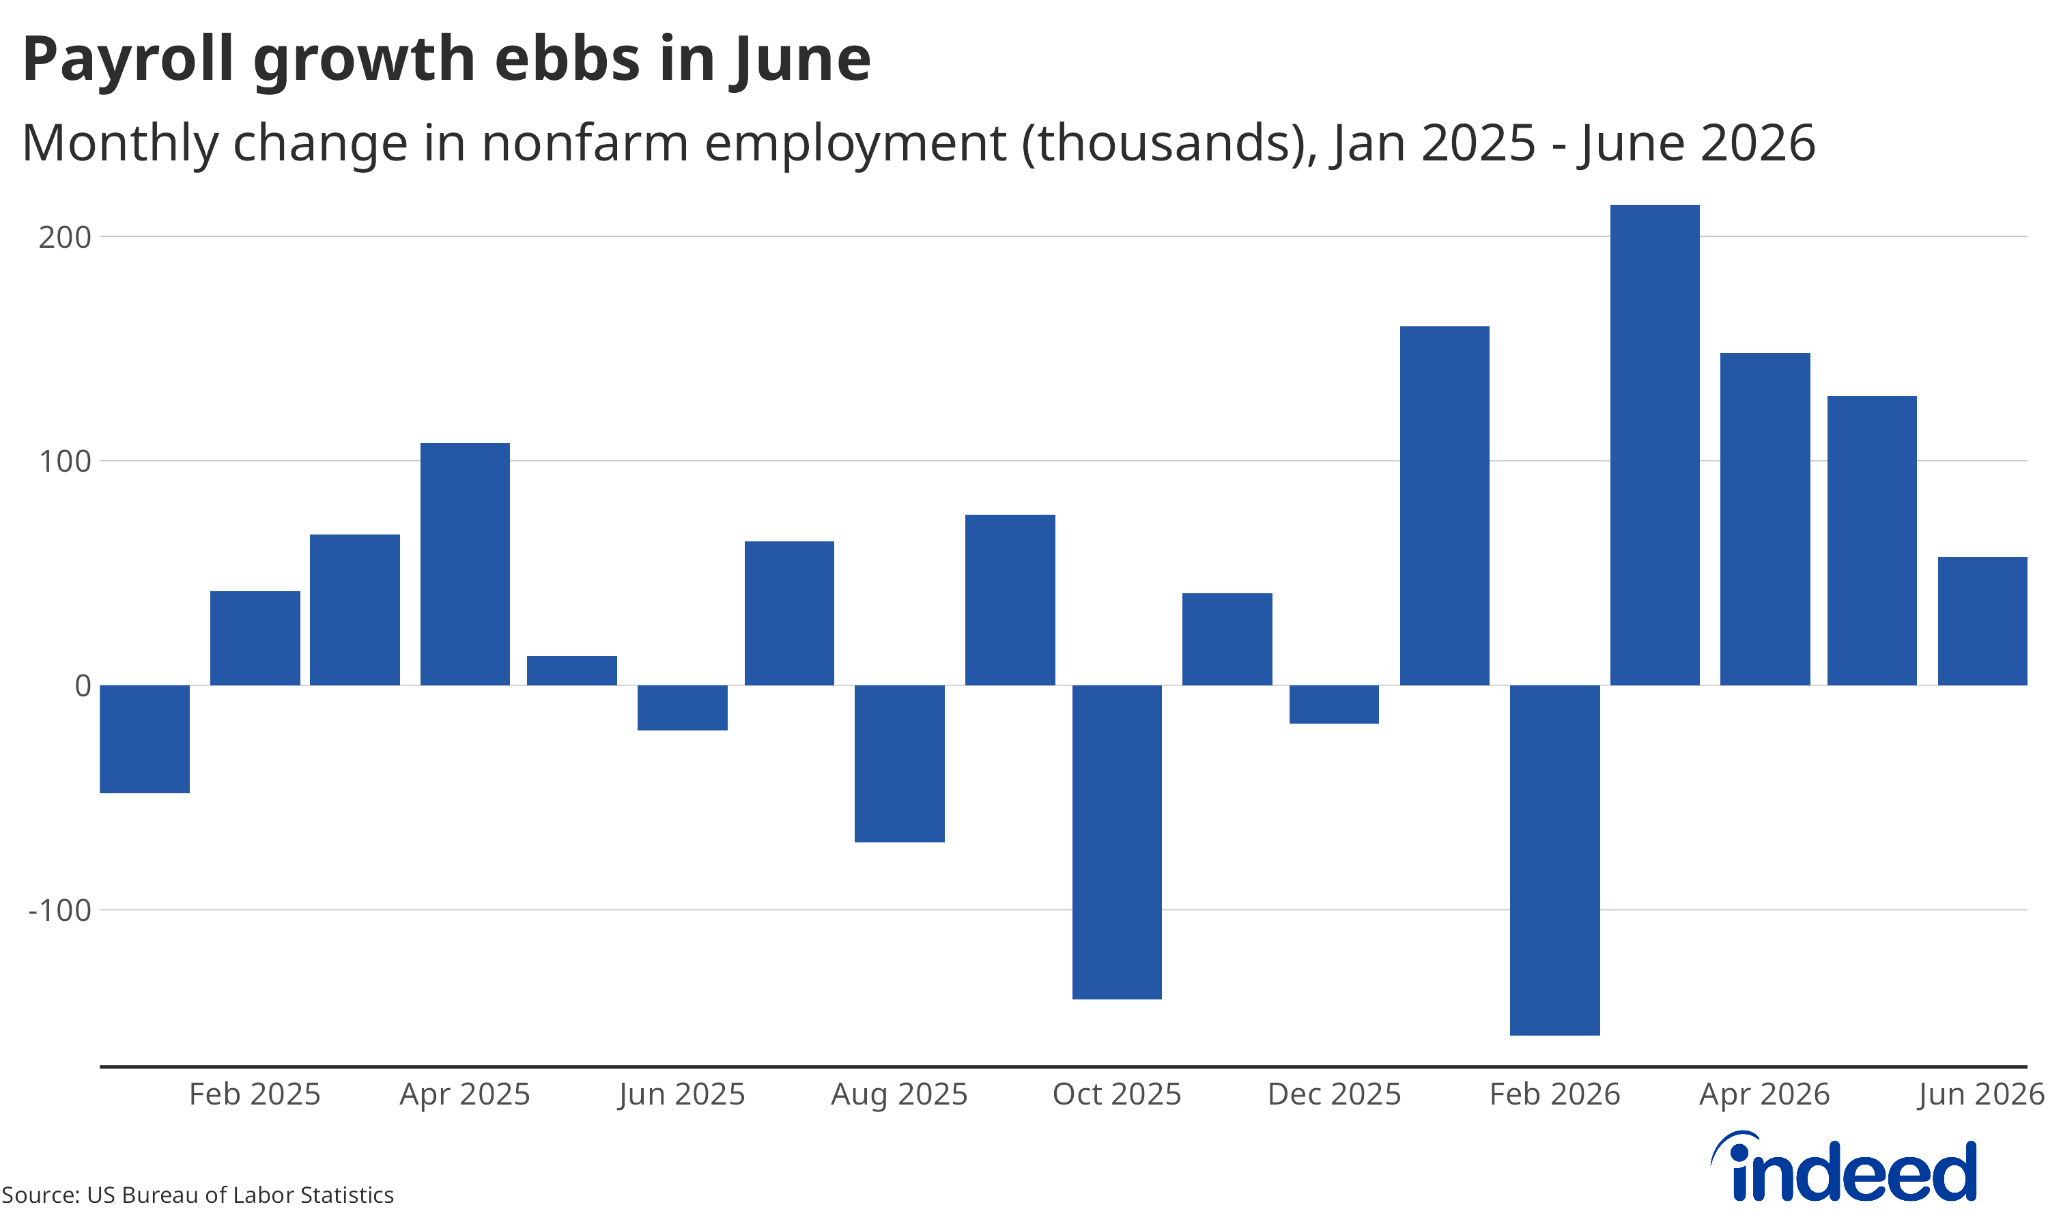
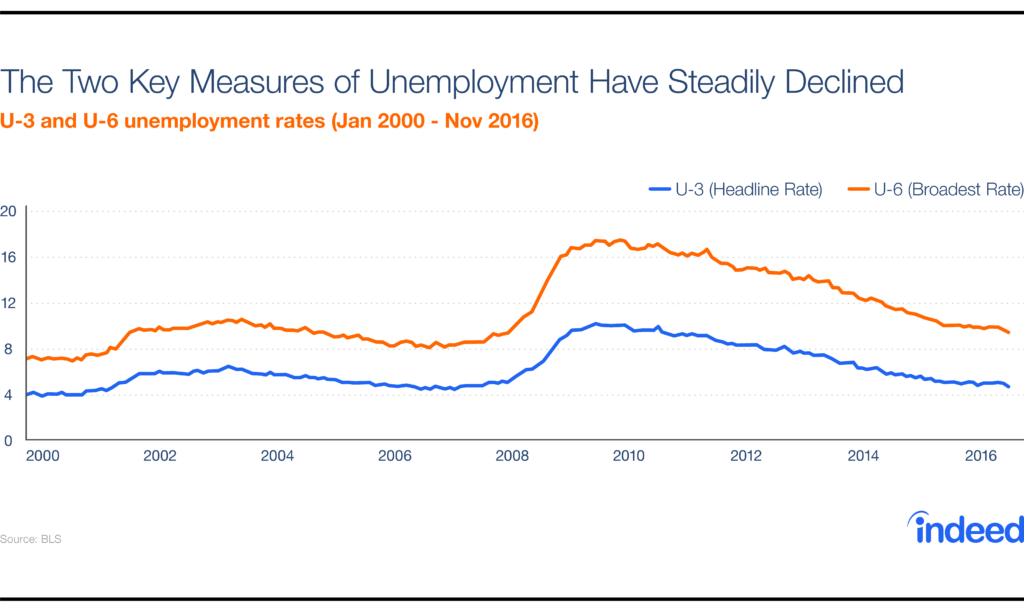
Let’s start with the good news: the U.S. economy added an average of 180,000 jobs each month in 2016 through November, which is well above the approximately 60,000 monthly jobs needed to keep pace with the growth in the working-age population. While average monthly payroll growth was lower in 2016 than 2015, it’s expected and natural that job growth would slow as the economy returns toward normal and has less room to recover. Thanks to years of job growth, the unemployment rate has fallen to 4.6%—its lowest level since August 2007 and also slightly below the Federal Reserve’s expected long-run level of unemployment of 4.8%. A broader measure of employment that includes discouraged workers and some under-employed workers (the U-6 rate) is back down to its April 2008 level.
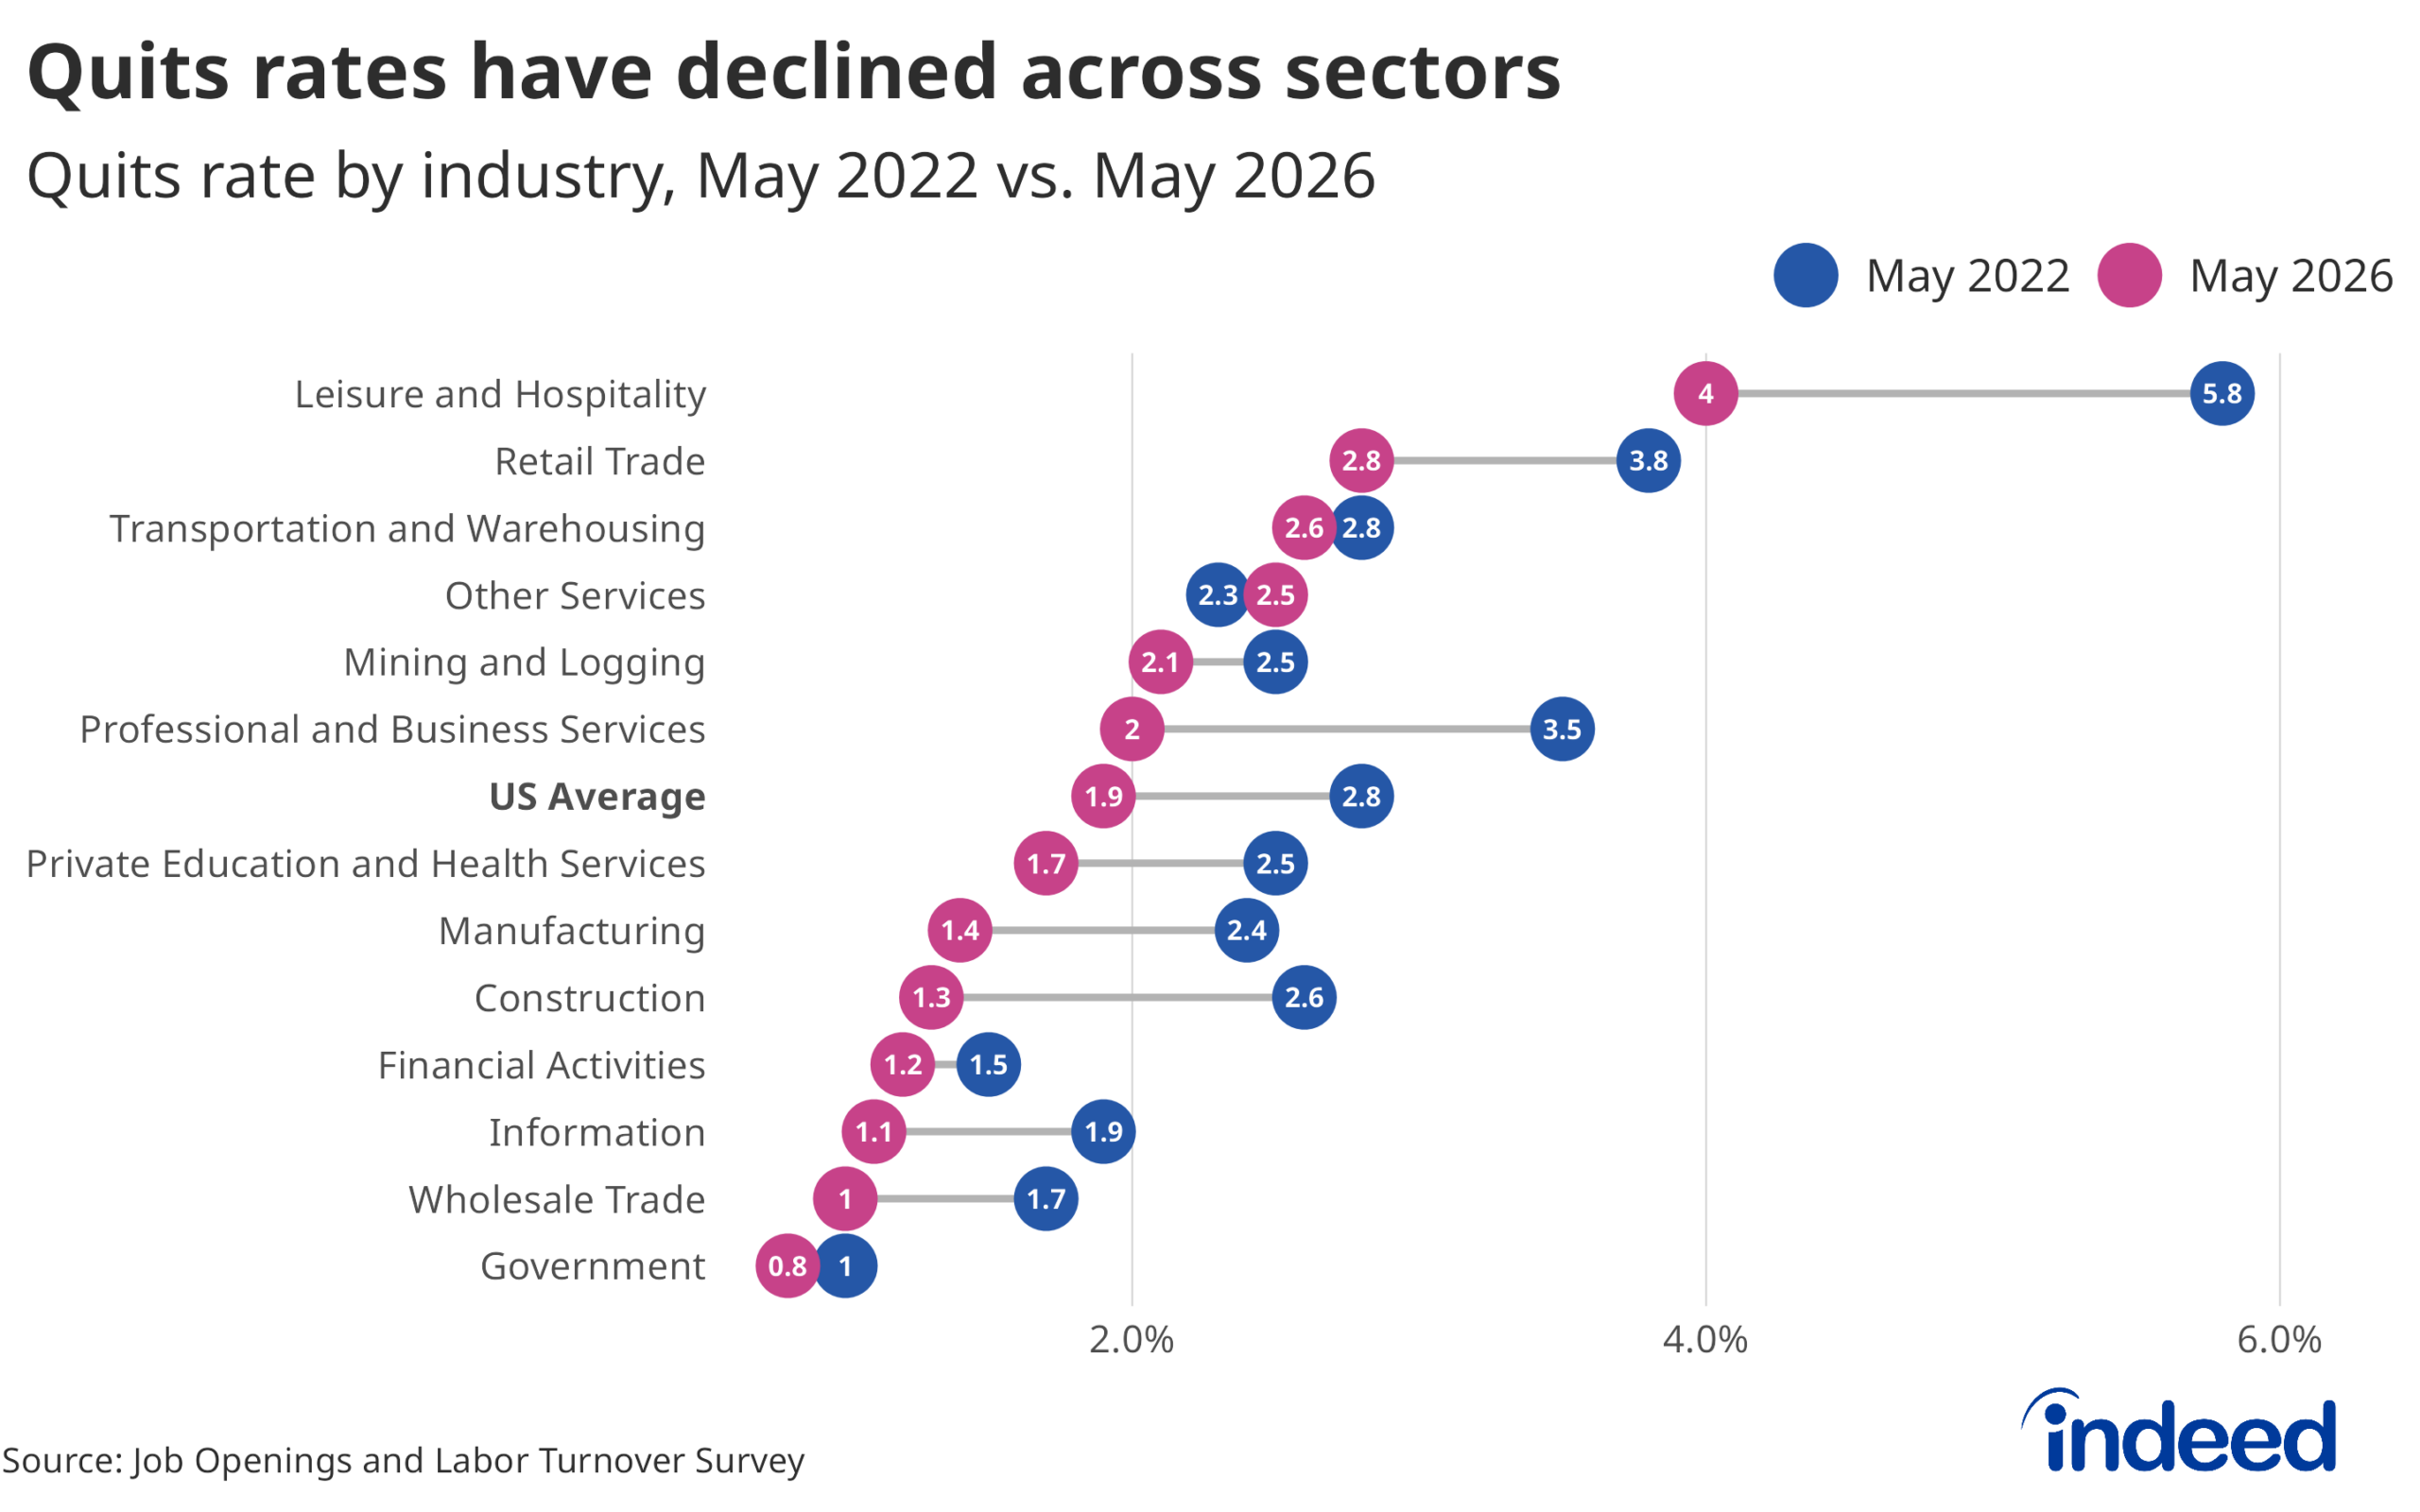
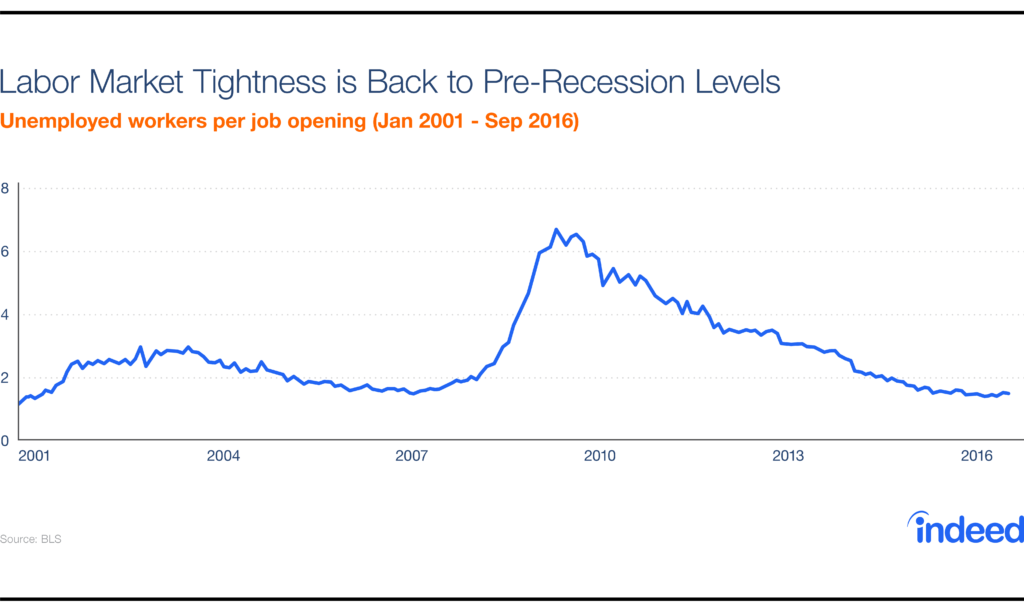
Workers are benefiting from the job-market recovery. Hourly earnings increased 2.5% in the year to November, an acceleration over previous years. Together, higher earnings and increased employment contributed to a jump in household incomes in 2015. Median wages, adjusted for inflation, reached a record high in the third quarter of 2016. People looking for jobs have more to choose from, with fewer unemployed people per job opening; plus, more people have the confidence to leave their jobs, with quits outnumbering layoffs by the largest margin in over a decade.
Though the labor market is at its strongest point since the recovery began, some critical measures are worse today than before last decade’s recession. The low unemployment rates mask two troubling trends.
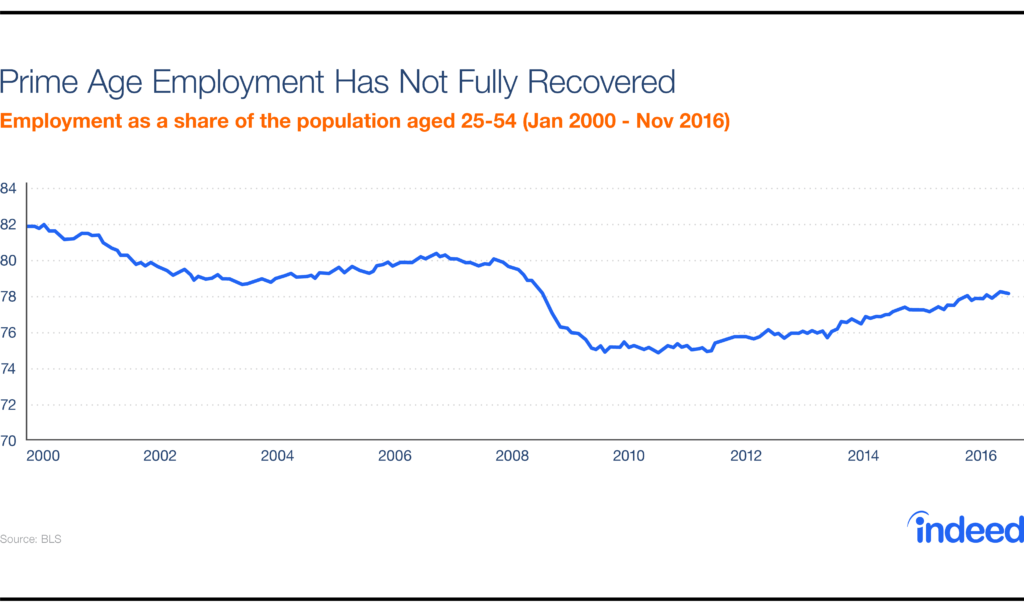
First, unemployment spells have lengthened. Among those who are unemployed, 24.8% have been without work for at least six months, compared with 17.5% in August 2007, when the overall unemployment rate was the same as today. Furthermore, the prime-working-age employment-population ratio, which stood at 78.1% in November, is below its pre-recession level. In fact, compared to its low of 74.8%, this ratio has recovered only three-fifths of the way back to where it was ten years ago. That’s because more working-age adults—especially less-educated men—have dropped out of the workforce. Economists have been examining various explanations for this long-term trend, which is worse in the U.S. than in other rich countries; research has suggested that serious health conditions, incarceration rates and even video games all may play a role. With low unemployment and rising wages going into 2017, next year will be the real test of whether a stronger labor market will bring people back into the workforce.
Three Big Questions Facing the U.S. Labor Market
Three big questions are on our minds for 2017. First, what will happen to the sectors, places, and people who are struggling in the labor market? Second, what will President-elect Trump mean for jobs? And third is the longest-range question: will automation and new “gig economy” platforms mean the end of work as we know it?
1. Will labor-market gaps widen or narrow?
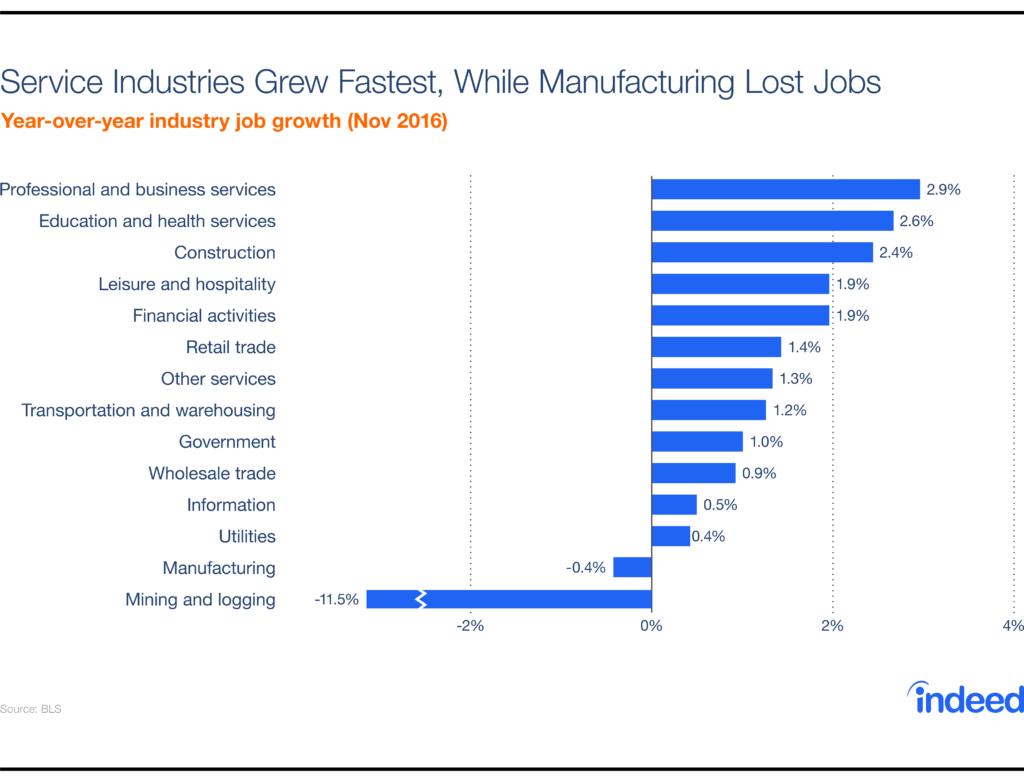
The national job numbers hide huge differences across sectors, local markets, and demographic groups. The decades-long shift from manufacturing to services continues: over the past year, professional and business services and education and health services were the fastest growing sectors, while manufacturing shrank. While some of the big swings in 2016—like the jump in construction and huge drop in mining—are corrections to short-run booms and busts, most reflect longer-term trends. The Bureau of Labor Statistics (BLS) expects health care to be the fastest-growing industry over the next decade while manufacturing will lose jobs, according to its latest ten-year employment projections.
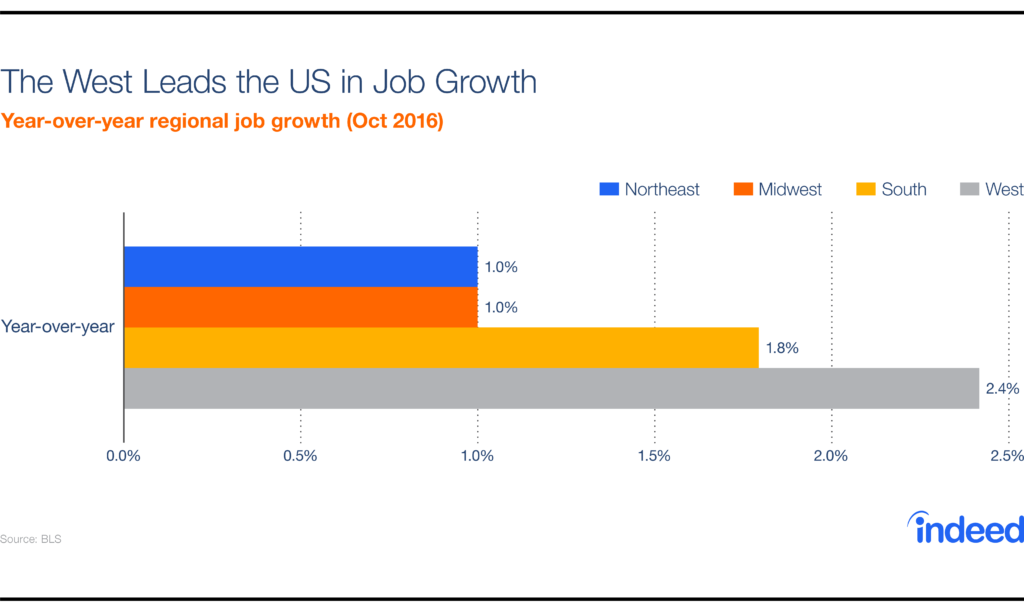
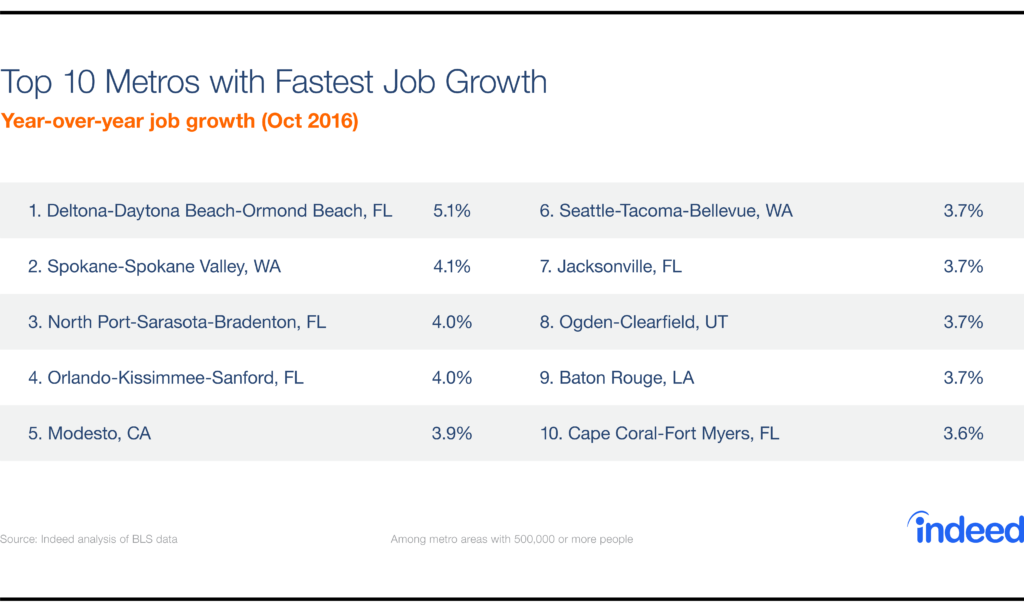
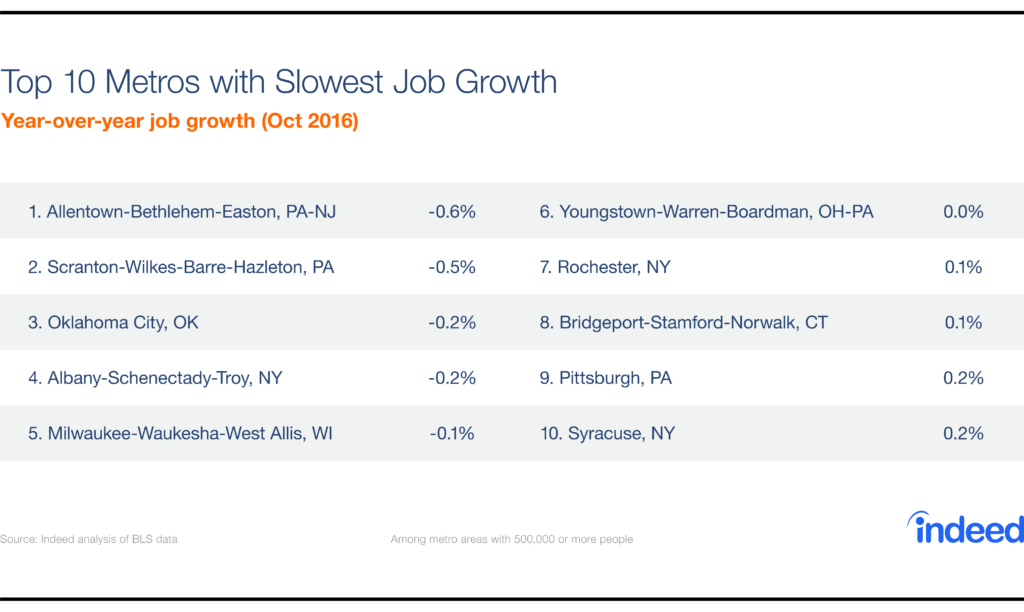
Because many industries are clustered geographically, differences in industry growth contribute to differences in regional and local job growth. Within the U.S., the differences are dramatic. Over the past year, job growth in the West and South outpaced that in the Northeast and Midwest. The fastest-growing local markets, such as Orlando and Seattle, are growing at more than twice the national average, while some metros, particularly in upstate New York, Pennsylvania, and Ohio, are struggling to add jobs, according to the BLS. Not only does job growth range widely across metros, but income inequality across metros has been rising as well.
Finally, the labor market looks totally different depending on your education level. Unemployment ranges from 2.3% for college graduates to 7.9% for those without a high school diploma. People with college or advanced degrees have had bigger wage gains and are less likely to work in shrinking occupations. Income, unemployment, and the risk of your job disappearing also vary by race, ethnicity, and sex, though the picture is more complicated: African-Americans and Hispanics have higher unemployment and lower incomes than whites, and women continue to earn less than men, but white men are the group most likely to work in shrinking occupations.
Differences in the labor market—especially geographic differences—are closely connected to the 2016 election, as Trump was stronger where the economy is weaker. That leads us to the second big question facing the labor market …
2. What effect will Trump have?
While it’s too soon to say how President Trump will affect the labor market, his campaign themes suggest some guesses, and the effect will go far beyond the temporary spike in Americans searching for jobs in Canada on election night.
First, a more nationalistic approach that reduces immigration and trade could slow overall economic growth while creating winners and losers within specific sectors and regions of the economy. Places and industries hurt most by trade (the “China shock”) could benefit, while industries that employ lots of immigrants could suffer, including those that rely on STEM (science, technology, engineering, and mathematics) workers. (All five of the most popular search terms used by international job-seekers for U.S. jobs on Indeed are tech-related.)
Second, a push to invest in infrastructure could boost employment in construction and related industries and add to overall economic growth. However, the labor market for construction workers is already tight: the unemployment rate for construction workers in November was as low as it was at the peak of the housing bubble last decade. That could hold back Trump’s infrastructure plans, push up wages and project costs, or draw workers back into construction from other sectors.
Beyond that, there are lots of wildcards. President Trump might gut the Affordable Care Act, but has also proposed paid maternity leave and support for child care. The recent deal to prevent Carrier from moving some jobs to Mexico illustrates that Trump understands that saving middle-class jobs has wider political appeal than promoting entrepreneurship or reducing poverty. And it’s unclear how the healthy labor market will play out politically: on the one hand, a president inheriting a growing economy has the luxury of dealing with longer-term challenges rather than having to tackle immediate crises (as President Obama did upon taking office in 2009). On the other hand, the recent good economic news sets the baseline against which Trump’s economic performance will be judged, and it will be tough to sustain these levels of job growth and falling unemployment for the next four years, especially when the aging population and slowing productivity are likely to hold back growth.
3. Is it the end of work as we know it?
As the recession recedes and the recovery stabilizes, two big uncertainties about the future of work have moved to center-stage: (1) the increase in freelancing, contracting, and other “gig” work, and (2) the threat that automation will make more jobs obsolete. Recent research, writing, and conferences on these uncertainties suggest some possibilities for the future of work.
On the so-called “gig economy,” there has indeed been a significant increase in the share of workers who make their living by freelancing, contracting, and doing on-demand tasks. Older workers are more likely to be in these alternative work arrangements than younger workers, and their participation has increased the most. Most of these people are independent workers by choice, not out of necessity. Only a sliver of them are using true online platforms like Uber and TaskRabbit; these “gig workers” tend to have another, primary source of earnings and use gig work to smooth out the ups and downs in their income. Those who do rely on independent work often lack the job security, benefits, and protections that traditional full-time workers have; if independent work becomes more widespread, labor laws might have to catch up.
Automation poses a bigger threat to the future of work and has inspired more radical responses. Researchers disagree on how many jobs are at risk of being automated by computers, robots, or other machines: estimates for the U.S. range from 9% to 47%. While manufacturing captures the public imagination and political debate over lost jobs, most of the jobs in occupations likely to shrink over the next decade are in fact service jobs, like bookkeepers and fast-food cooks, including higher-paying jobs like nuclear technicians and computer programmers. Automation won’t take all the jobs immediately, and technological innovations can create jobs and expand employment even as they replace other jobs. Still, concerns about automation and job loss have kickstarted proposals and experiments for a government-provided “basic income” to support people in a world where there’s not enough work to go around. The prospect of future job losses has inspired some big thinking about the meaning of work (here and here) and what a world with less work might look like (here and here).
As we watch the numbers next year, those are some of the big questions that will be on our minds. Fortunately, the U.S. job market enters 2017 in better health than in many years. But the recovery has been uneven and incomplete, and it remains to be seen whether the new administration and continued technological changes can help more Americans, across all sectors and regions, get back to work.