
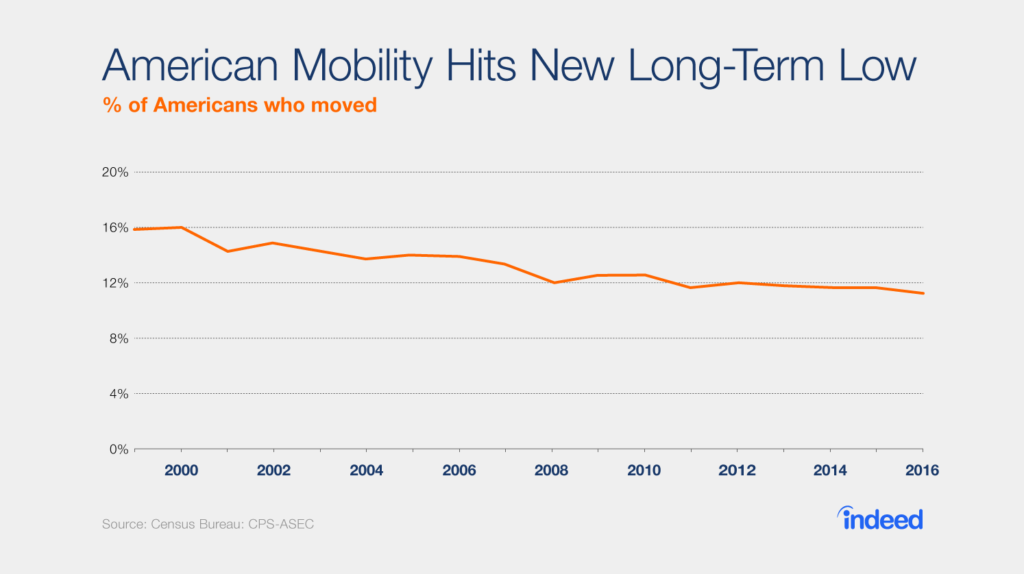
Would you move for a new job? Every year, about 1 in 9 Americans does. That may sound like a lot, but people in the US are actually much less mobile than they used to be. Throughout the 1980s and 1990s, 1 in 6 Americans moved annually. Prior to the mid-1970s, it was closer to 1 in 5.
This downward slide continues. The latest Census data, hot off the virtual presses as of yesterday, reveal that overall American mobility hit a new low in the year leading up to March 2016. Over this past year, 11.2% of the population moved, a decline from 11.6% in 2015 and from 16.1% in 2000 — the lowest level since 1948, when the Census started reporting annual mobility rates.
Significantly, however, job-related moves were nearly unchanged over the same time period. That’s the surprise in the new mobility data and is especially important for how mobility affects the economy. Job-related moves, more than overall mobility, are an indicator of how dynamic the economy is. Let’s take a closer look at these job-related moves.
Crunching the numbers on job-related moves
Many sectors of the economy do better if people move more often. For instance, moving companies, real estate agents and furniture retailers benefit directly when mobility increases. But moving for job-related reasons carries extra economic importance: it is an indicator of how dynamic the economy is overall.
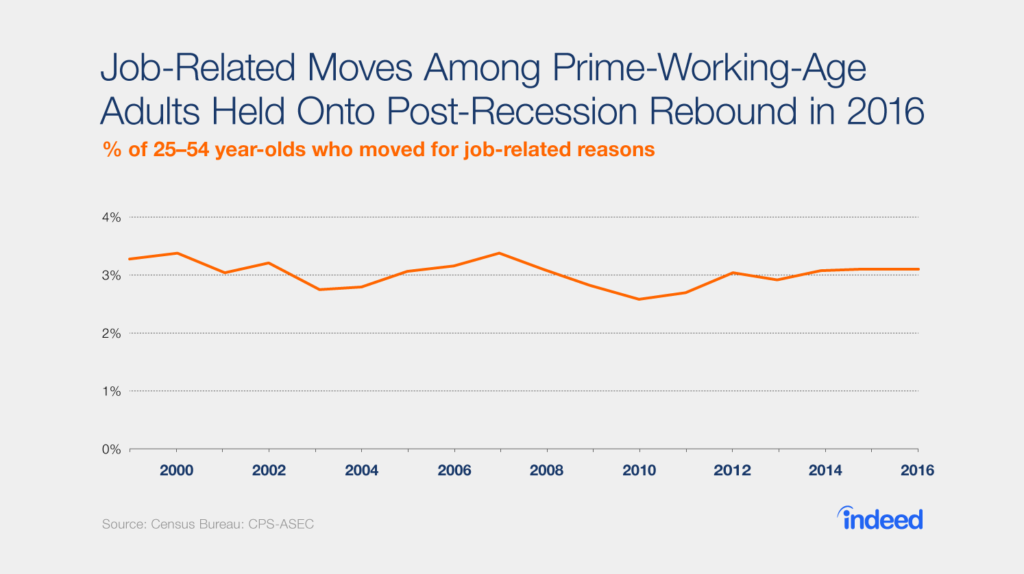
What does the trend in job-related moves look like? There are two ways to look at this. One is to use the Census’ “reason-for-moving” question. This gives a direct answer but has a couple of drawbacks: first, it has only been part of the survey since 1999, and second, the Census captures only the “main reason” for moving — even though people could have multiple reasons for doing so.
These caveats aside, responses to this question show us that the share of 25–54 year-olds who moved for job-related reasons held steady in 2016 at 3.1%. That’s near the average level for the 1999–2016 period and has been almost unchanged since 2012.
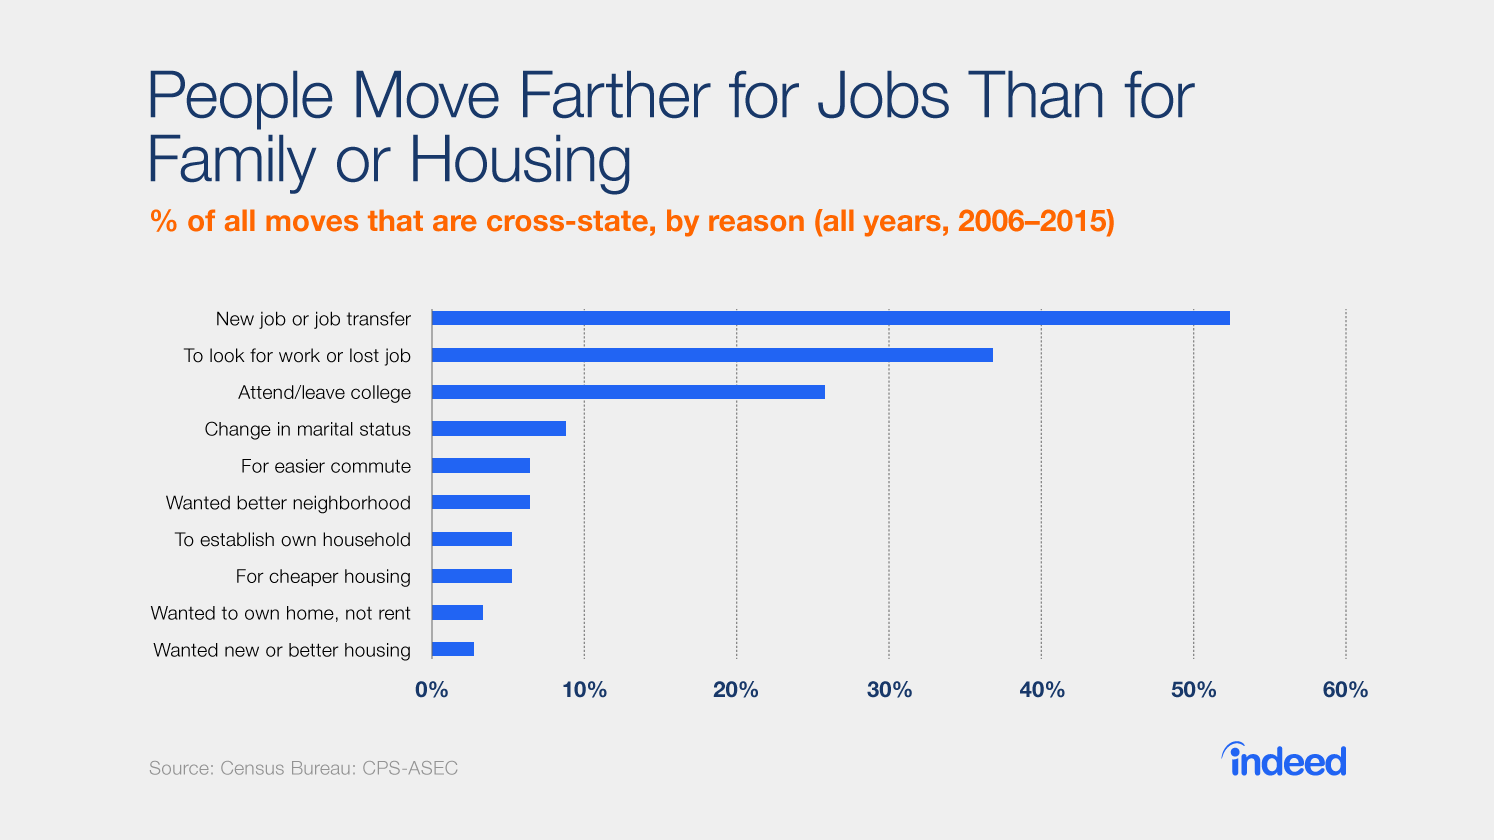
To get a comprehensive view of whether people are moving for work, we can also look at cross-state moves, which are disproportionately job-related: among moves that were for a new job or job transfer, 52% were moves to a different state; 37% of moves were made to look for work. By contrast, less than 10% of moves for housing-related reasons and family-related reasons were cross-state.
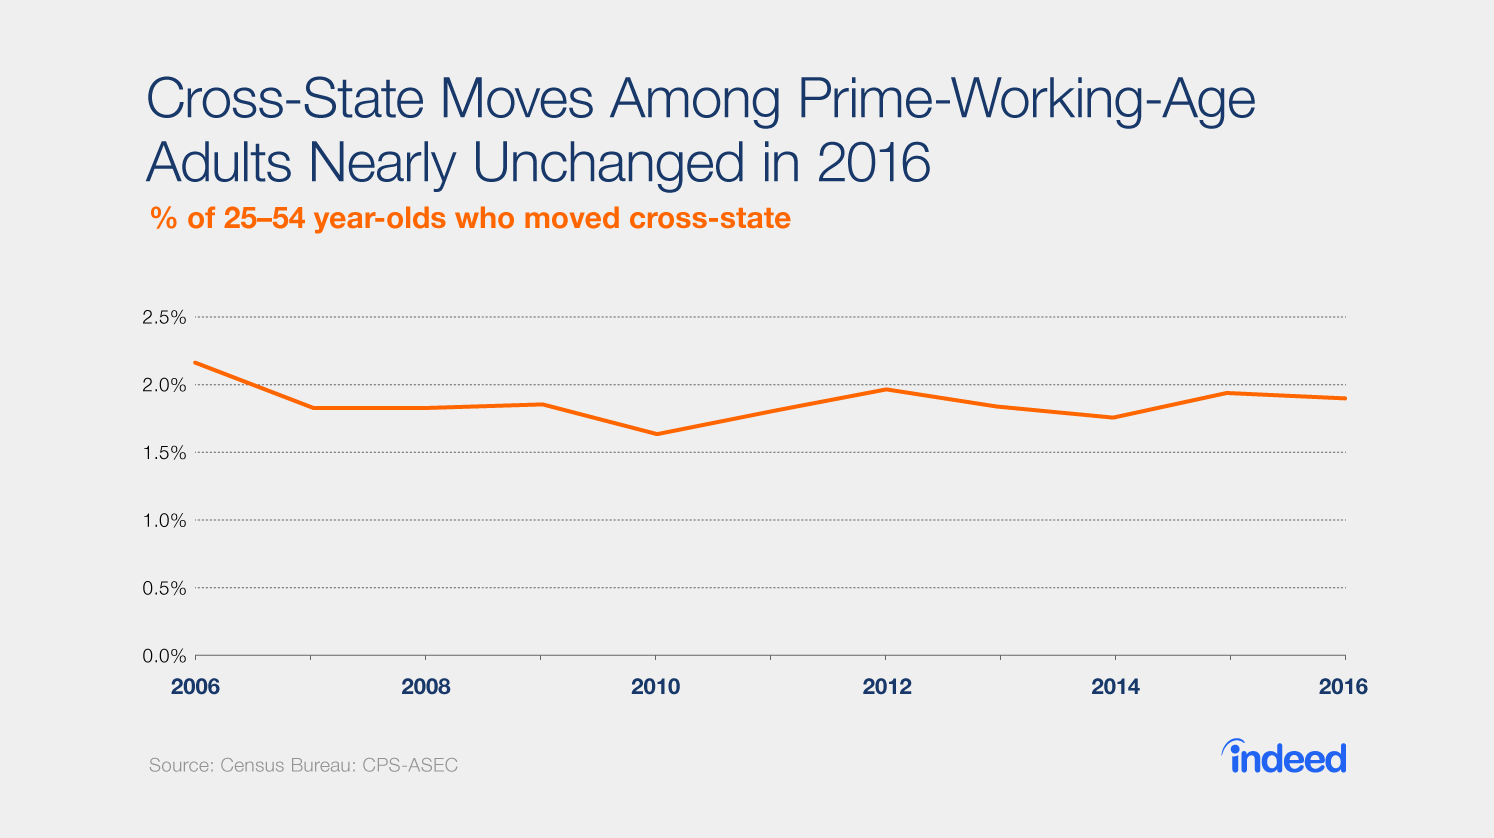
By restricting our view to prime-working-age adults — 25–54 year-olds only — we can exclude young adults moving long-distance for college and older adults who are no longer in the labor force: doing this makes cross-state moves an even better proxy for job-related moves. This shows us that the share of 25–54 year-olds who moved cross-state was 1.9% in 2016, unchanged from 2015 and near the average for the period 2006–2016.
These two measures — job-related moves and cross-state moves — tell a consistent story. Prime-working-age adults are moving for jobs today at roughly the same rate as the past few years, and slightly ahead of the dip in 2010 and 2011. Thus, whereas overall mobility, for all reasons and among all age groups, dropped in 2016 and is notably down from 2006, prime-age job moves have held up since 2006 (based on cross-state moves) or even 2000 (based on job-related moves).
Even so, job mobility, like overall mobility, was higher in earlier decades: the cross-state mobility rate for 25–54 year-olds was closer to 3% until the mid-1990s compared with less than 2% today.
What the latest mobility data mean for economic dynamism
The long-term decline in mobility is a puzzle. Academic research has found that it’s not simply due to demographic shifts; nor was it triggered by the recession. The decline in geographic mobility is part of a broader decline in economic dynamism: less job creation and destruction by firms, and workers less likely to move from job to job.
There are possible explanations for the long-term trend — such as higher housing costs, or state regulations — but no smoking gun. And it’s not even clear whether the decline in mobility is a bad thing. While it might reflect higher barriers to moving to opportunities in other places, it might also reflect that the economic advantages of moving relative to staying put have declined.
But if the decline in dynamism should be cause for alarm, then the 2016 mobility data at least offer some hope. The overall drop in mobility in 2016 was primarily due to fewer housing-related and family-related moves, as well as fewer within-county moves. Job-related moves — whether measured directly or proxied by cross-state moves — held up in 2016, are above their low point during the recession, and are in line with averages over the past decade. Mobility held up better for the longer-distance, job-related moves — and these are a better reflection of economic dynamism.