
Key points
- Growth in posted wages continued to slow in December 2022.
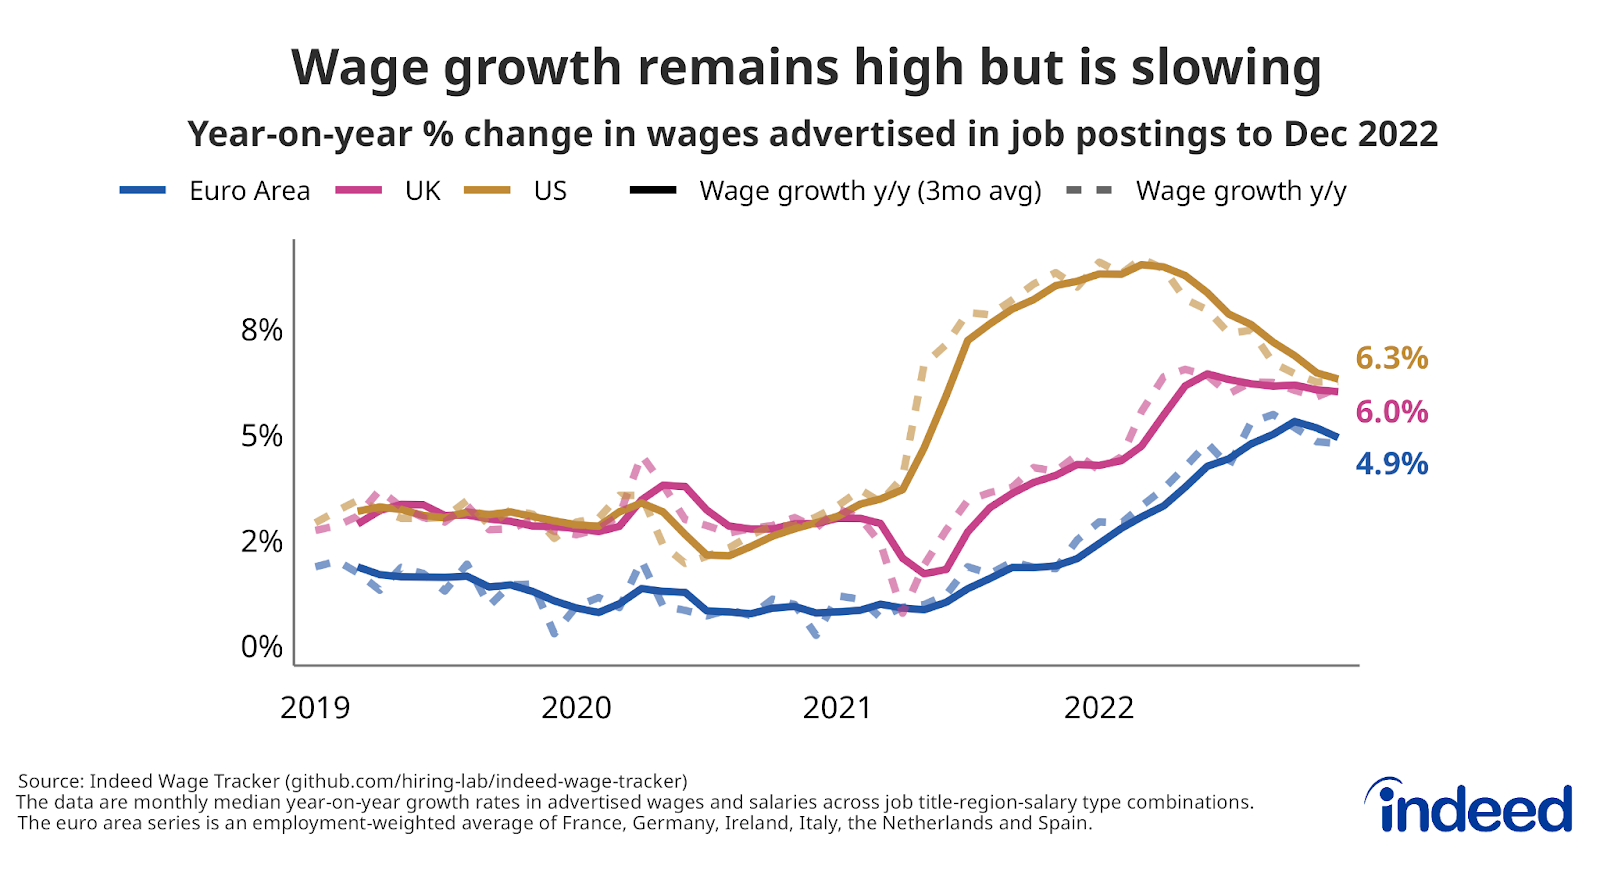
- In the UK, wages grew 6% year-on-year in December 2022, down slightly from 6.1% in November 2022.
- In the euro area, average wage growth across the six countries we track fell from 5.2% in November to 4.9% in December, its second decline in 20 months.
- Posted wages are still growing faster than before the pandemic, but growth rates have fallen below their 2022 peaks and remain well below inflation in the UK and euro area.
The Indeed Wage Tracker measures growth in wages and salaries advertised in Indeed job postings in eight advanced economies: France, Germany, Ireland, Italy, the Netherlands, Spain, the UK, and the US. Our research paper describes the data and methodology.
Wage growth is no longer accelerating
In December 2022, year-on-year growth in posted wages remained high at 6% in the UK and 4.9% on average across the six euro-area countries we track. These growth rates are well above their pre-pandemic December 2019 figures of 2.8% and 1.1% but they are down from their 2022 peaks of 6.4% and 5.3%, respectively. The decline is even more pronounced in the US.
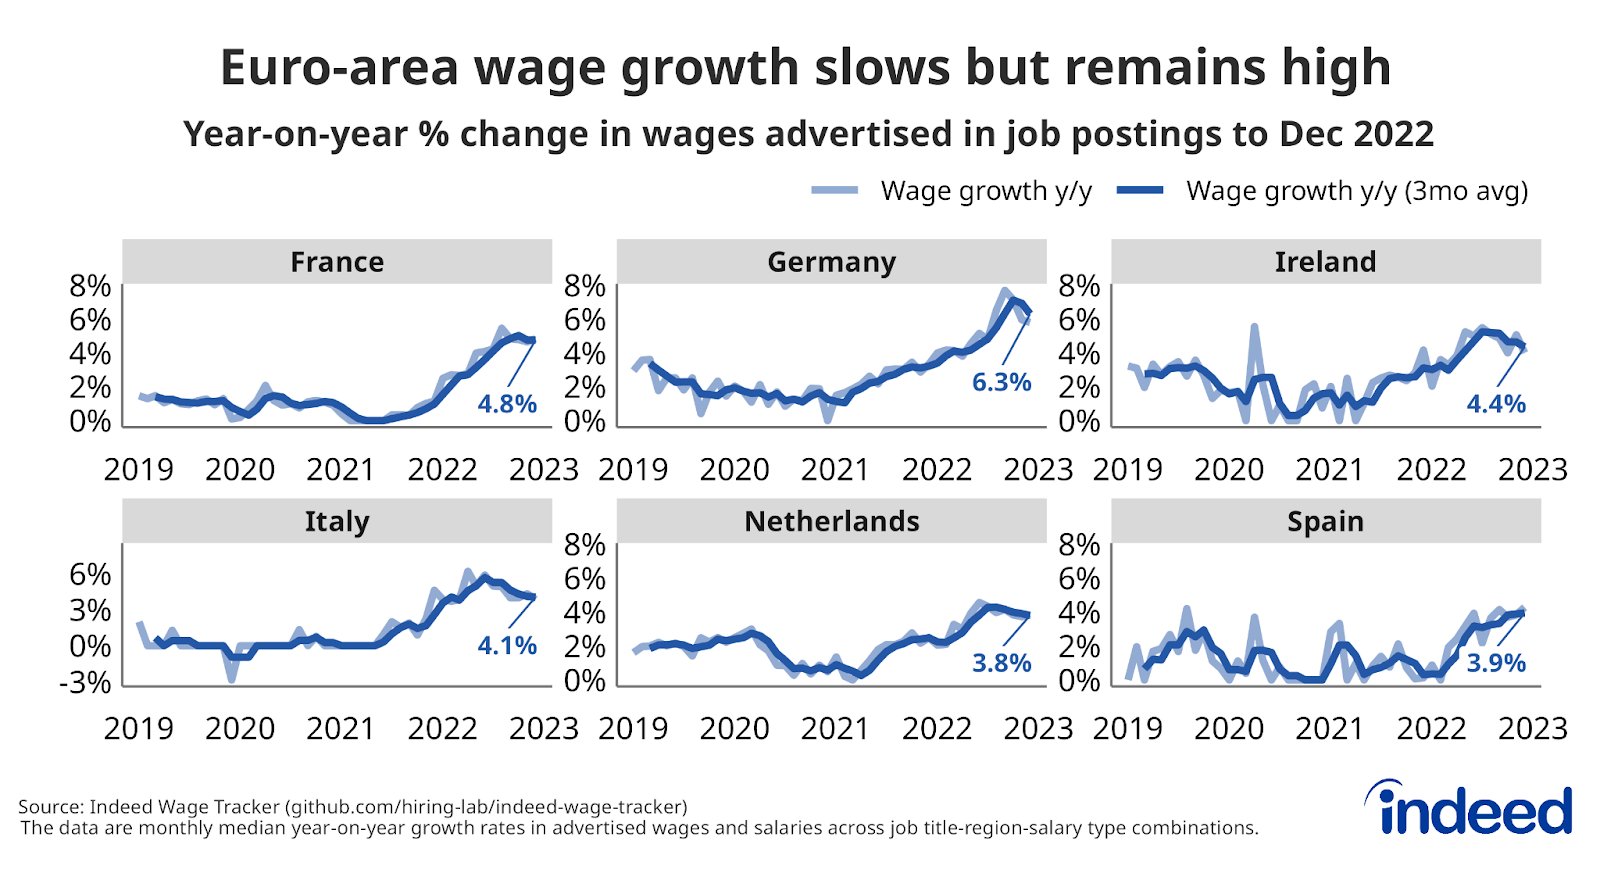
In the euro area, Germany continues to lead with 6.3% year-on-year growth in posted wages in December. However, this is down from 6.9% in November. Wage growth also appears to have peaked in France, Ireland, Italy, and the Netherlands, but shows no sign of slowing in Spain.
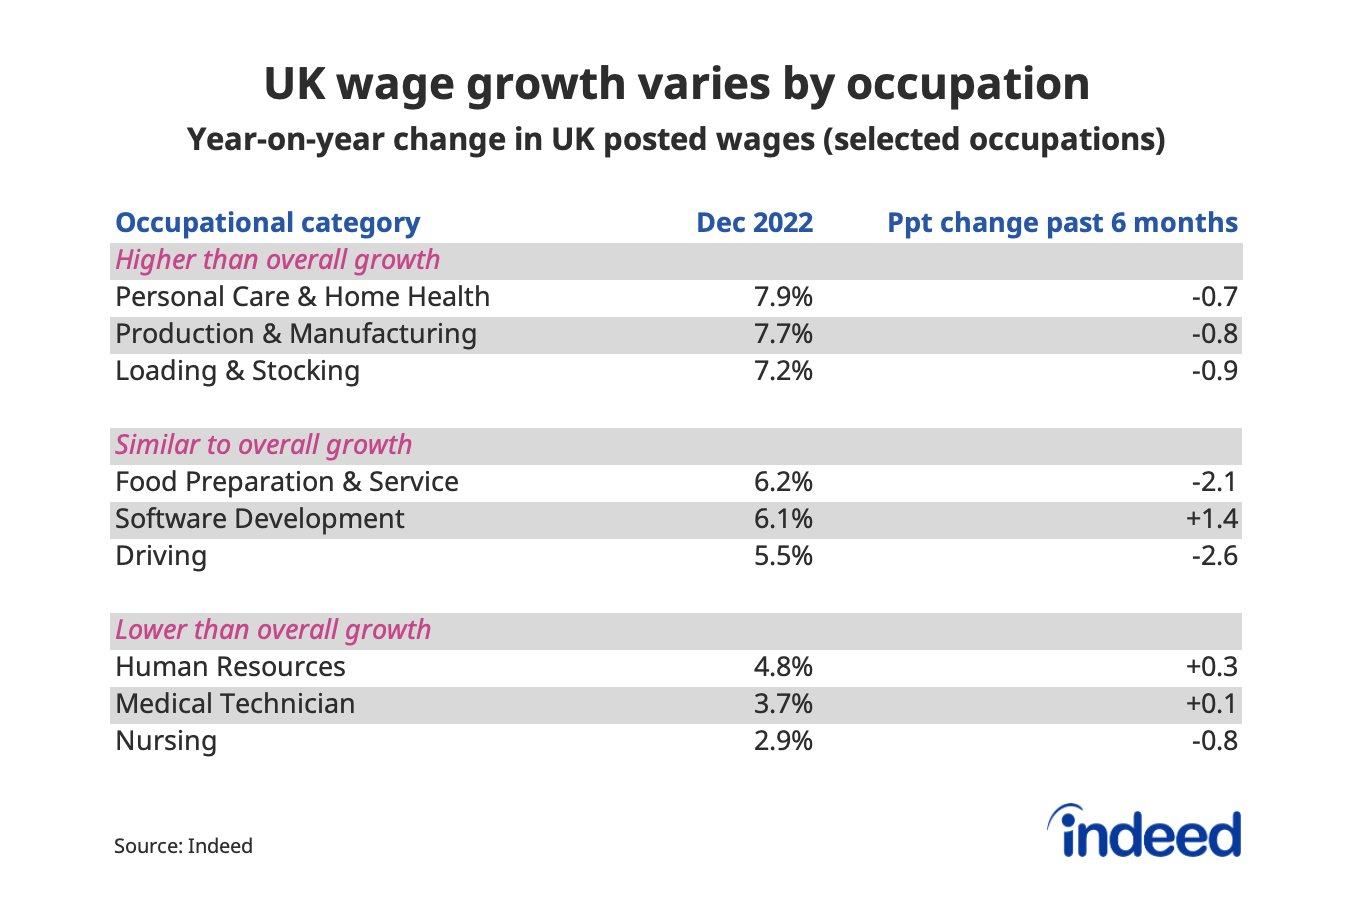
Wage growth varies by occupation
Wages in various occupations have grown at different rates. In the UK, for instance, personal care and home health jobs saw an increase of 7.9%, while nurses only experienced a 2.9% growth. Despite the slowdown in the labour market in the past six months, the majority of occupations have still seen posted wages grow at a higher rate than before the pandemic.
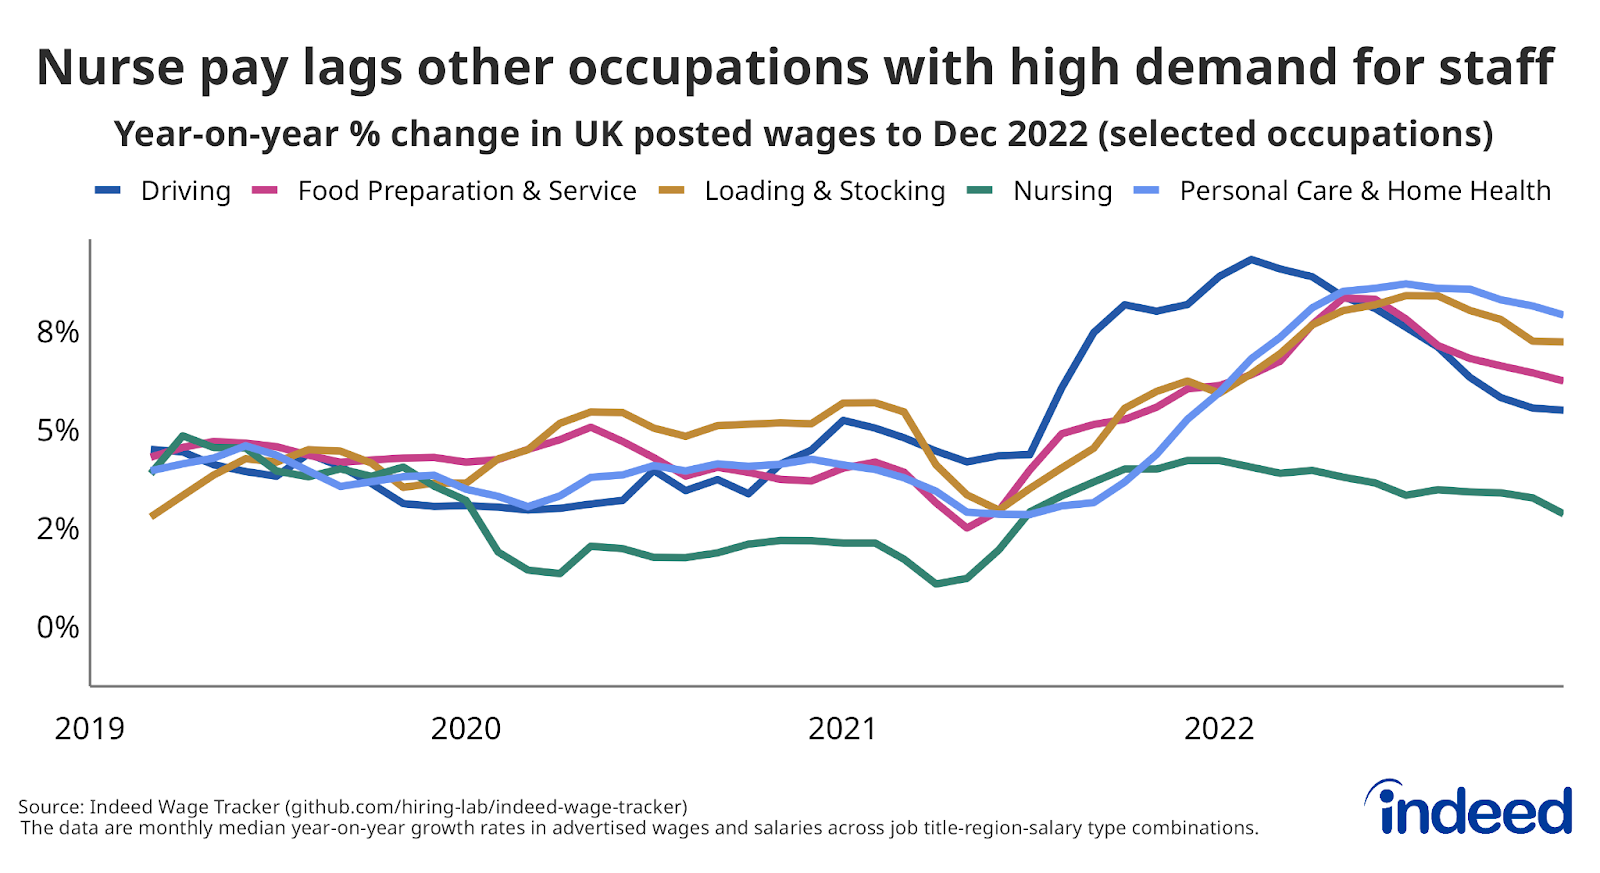
Out of the 27 large occupational categories that represent at least 0.5% of all UK job postings, nursing has the lowest year-on-year pay growth of just 2.9%. Despite a high number of job vacancies, wage growth for nurses has been slower compared to other occupations that have also seen high demand for workers during the pandemic, such as driving, food preparation and service, loading and stocking, and social care.
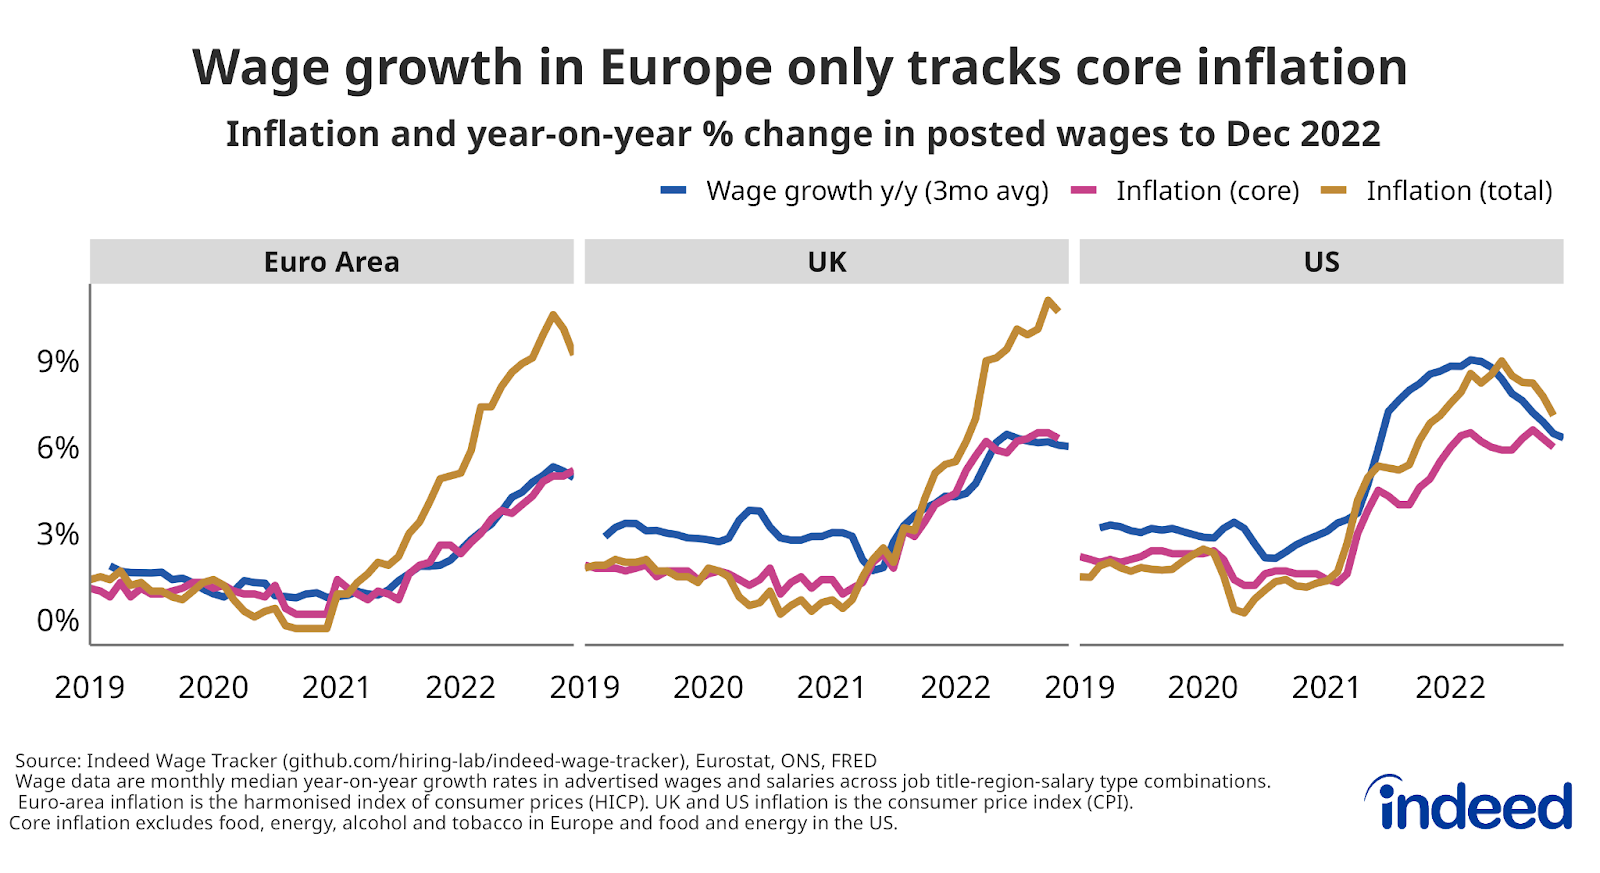
While high, UK and euro area wage growth remains well below inflation
Posted wage growth appears to have peaked at a rate well below total consumer price inflation in the UK and euro-area countries. Instead, wage growth is tracking core inflation, which excludes food and energy prices.
The Indeed Wage Tracker suggests post-pandemic wage growth has peaked. While it is still too early to say with certainty whether wage growth will continue to slow, we will keep watching this trend, as well as its implications for real wages and monetary policy, as we head into 2023.
Methodology
To calculate the average rate of wage growth, we follow an approach similar to the Atlanta Fed US Wage Growth Tracker, but we track jobs, not individuals. We begin by calculating the median posted wage for each country, month, job title, region and salary type (hourly, monthly or annual). Within each country, we then calculate year-on-year wage growth for each job title-region-salary type combination, generating a monthly distribution. Our monthly measure of wage growth for the country is the median of that distribution. Alternative methodologies, such as the regression-based approaches in Marinescu & Wolthoff (2020) and Haefke et al. (2013) produce similar trends.
The euro-area figures are an employment-weighted average of growth rates in France, Germany, Ireland, Italy, the Netherlands, and Spain. The weights for the most recent months are revised periodically as new employment figures are published by Eurostat. We updated the weights for Q3 2022 in January 2023.
More information about the data and methodology, as well as additional country-specific wage growth results, are available in our accompanying research paper, ‘Wage growth in Europe: evidence from job ads’, published in the Central Bank of Ireland’s Economic Letter series.