
Key Points
- Labour market will start from a strong position to weather economic downturn in 2023
- Hiring conditions could remain fairly challenging despite recession
- No end in sight for the real-terms pay squeeze
Five encouraging signs for the UK labour market:
- Job postings continue to show resilience and have reached a new post-pandemic high
- Signs of workers over 50 returning to the labour force — does that signal the start of a ‘Great Unretirement’ due to cost of living pressures?
- Pay pressures may have peaked — more real wage compression to come in the short-term but little sign of a wage-price spiral taking hold
- Redundancy notifications remain low for now, as employers hold on to workers
- Balance of power may not shift too far away from candidates even in a downturn, supporting retention of more flexible working models
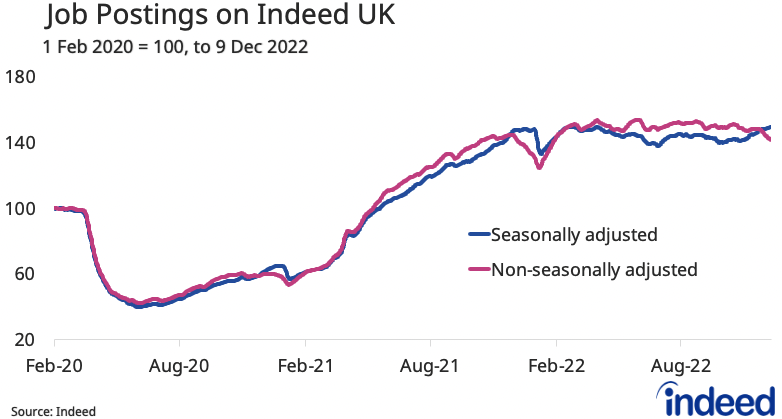
Though the UK economy is starting to struggle, signs show the labour market remains strong. Real-time data from Indeed job postings continue to show resilience — UK job postings were 50% above the 1 February 2020, pre-pandemic baseline (seasonally adjusted) as of 9 December 2022. That’s a new post-pandemic high. On a non-seasonally adjusted basis, job postings were 42% above the baseline (having eased recently in line with the usual year-end hiring slowdown). Postings have shown resilience to economic headwinds amid the cost-of-living crisis this year, with many organisations still experiencing staffing gaps.
North East, Scotland and West Midlands Have Gained Momentum, but London Has Slipped Back
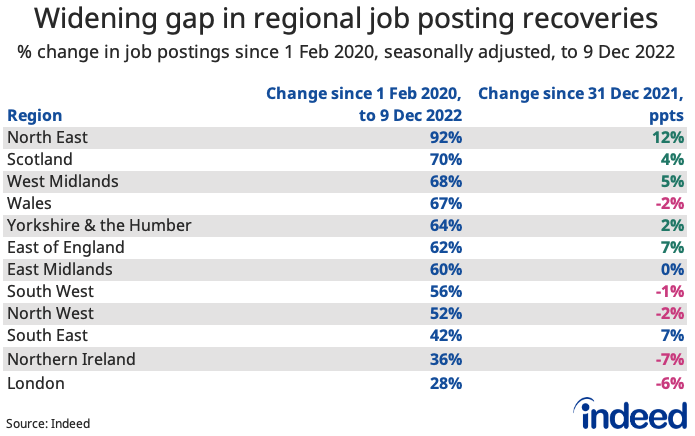
Disparities in regional job posting recoveries have widened over the course of 2022. The North East began the year in pole position in the regional rankings, indicating the strongest growth in job postings, and has increased its lead, now standing at 92% above the 1 February 2020 baseline. Scotland and the West Midlands are in second and third positions respectively, having also gained momentum throughout the year.
Conversely, London has experienced the slowest growth, sitting at the bottom of the rankings at 28% above the 1 February 2020 baseline, a 6% decrease from the previous year. Northern Ireland has the second-weakest recovery at 36% above the baseline, and has also lost ground since 2021.
Differences in job sector composition are one of the biggest indicators of regional performance. Regions near the top of the table tend to have a greater reliance on sectors like distribution, manufacturing, construction and healthcare, where job postings growth has been strong. With a relatively high share of in-person service jobs, London continues to see an impact of higher rates of working from home and less commuter footfall compared with pre-pandemic levels. Northern Ireland’s relatively weak performance may be linked to Brexit-related trading disruptions.
Labour Market Overview
The final Office for National Statistics update for 2022 provided mixed news on the labour market. Employment was up on the quarter, driven by an increase in employees, as instances of self-employment declined. Vacancies fell by 65,000 in the quarter to November but remained high at 1,187,000. Unemployment ticked up slightly but remains low at 3.7%. The ratio of unemployed people to vacancies — one measure of labour market tightness — remains at a near-record low: 1.0.
With all signs indicating that the UK economy is either already in recession or expected to soon be in one, the labour market is likely to soften. However, the depth of this downturn isn’t expected to be particularly extensive compared with previous recessions. On the other hand, there’s a chance it could be relatively lengthy — the Bank of England (BoE) projects six consecutive quarters of contraction.
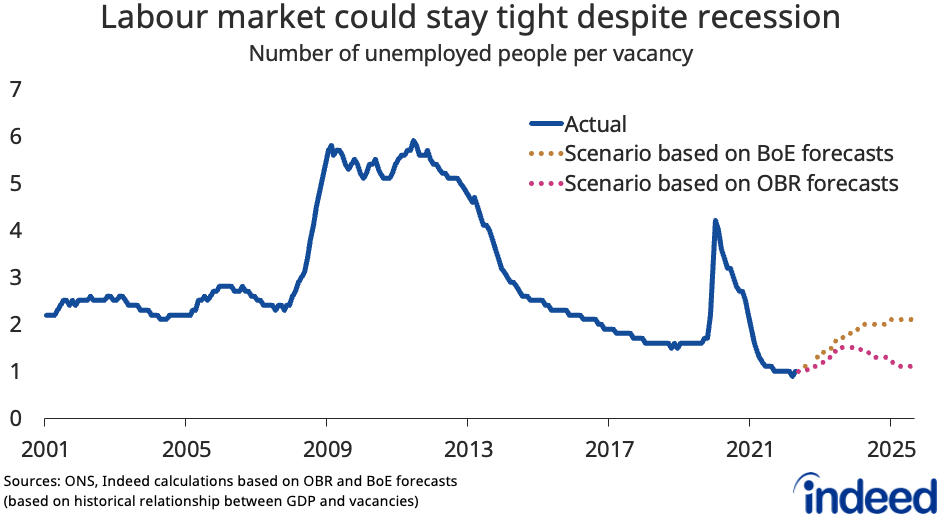
Our analysis suggests the labour market could remain relatively tight by historical standards. If the relationship between economic growth and vacancies that prevailed in the aftermath of the 2008/9 financial crisis were to be repeated, current forecasts from both the BoE and the Office for Budgetary Responsibility (OBR) suggest that the ratio of unemployed people per vacancy isn’t likely to rise too much from the current level. By the end of 2023, the ratio could rise to 1.7 under the BoE scenario and 1.5 under the OBR scenario. By the end of 2025, that could stand at 2.1 under the BoE scenario and just 1.1 under the OBR scenario (whereby the economy recovers faster).
Of course, things may not play out this way. Some of the key uncertainties are around whether vacancies will fall faster than expected as the economy weakens — and as the tailwind from the post-pandemic hiring boom fades — as well as developments on the labour supply side around currently constrained participation. But the analysis suggests it may be unwise to assume that hiring conditions will automatically get easier even as the economy weakens.
Beginning of a ‘Great Unretirement’?
One noteworthy development in the latest figures was a drop in economic inactivity among the 50-64 age group, down by a record 84,000 in the three months to October from the previous quarter. The withdrawal of older workers from the labour force has been one of the key factors behind shrinking labour force participation, and was primarily driven by a decline in the number of people saying they were inactive due to retirement. That may be an early sign of cost-of-living pressures prompting some people to rethink their plans.
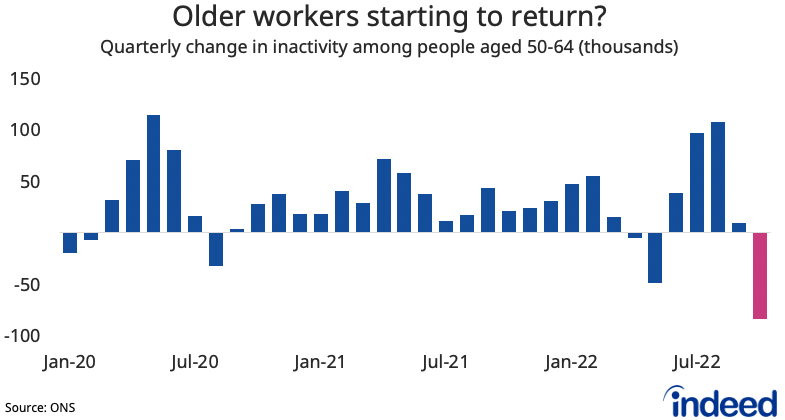
That trend will have to continue in order to help ease hiring challenges across the economy in any material way. The number of inactive people aged 50-64 still stands over 300,000 above where it was on the eve of the pandemic. Offering older workers the information, retraining opportunities, support and flexibility to re-enter the workforce will be key to facilitating this transition.
But some analysis suggests that the reversal of early retirements is likely to be limited due to the attitudes and financial security of the over-50s cohort. ‘Pension freedom’ reforms made in 2015 and high levels of outright home ownership among older people are factors here.
Overall economic inactivity remains more than 560,000 above pre-pandemic levels and continues to fuel hiring challenges across a range of sectors.
Widening Disparity Between Private and Public Sector Pay Growth
Pay data has highlighted one of the largest disparities in wage growth between the public and private sectors we’ve seen to date. While private sector regular pay was up 6.9% year on year (y/y), public sector pay was up just 2.7% y/y.
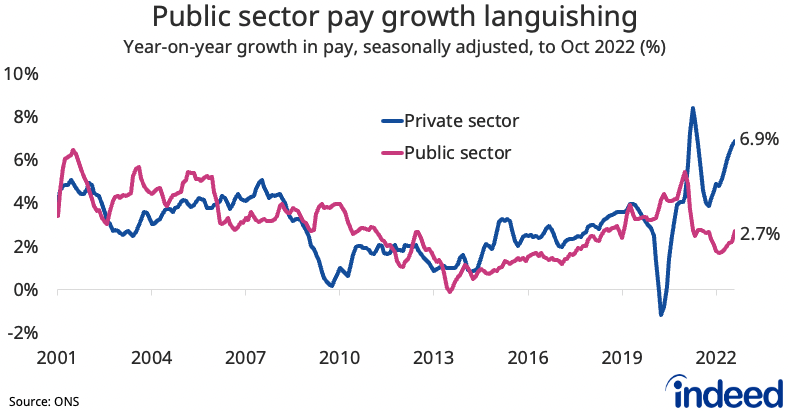
That data is the backdrop for a further round of strikes across swathes of public services in the run-up to the holiday period. October saw the highest number of working days lost due to labour disputes since 2011, with that figure set to climb over the winter.
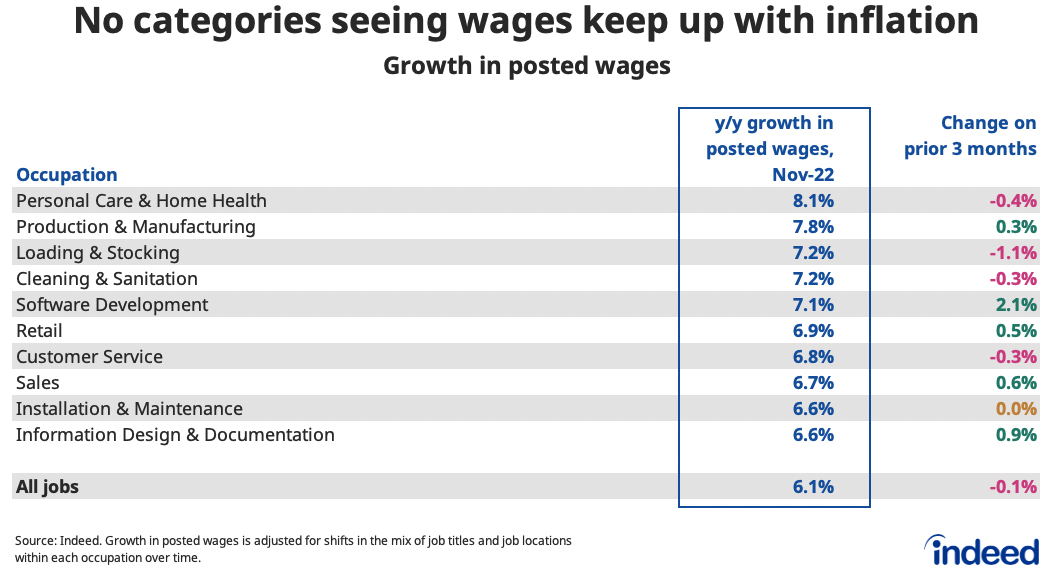
Indeed posted wage data signalled 6.1% y/y pay growth in November (the same rate as indicated by ONS figures). But the Indeed data — which, as a measure of advertised pay for new hires, may be significantly forward looking — suggests pay pressures may have peaked. That appears to be particularly the case for lower-wage jobs, as the uncertain economic climate begins to weigh more heavily. Though it may be too soon to call a turning point, it does suggest that the risk of a wage-price spiral may currently be limited.
One thing all sectors have in common? No occupational categories within the Indeed posted wage data are seeing pay growth keep up with inflation, which was running at 9.3% y/y on the CPIH measure in November and 10.7% y/y on the CPI measure.
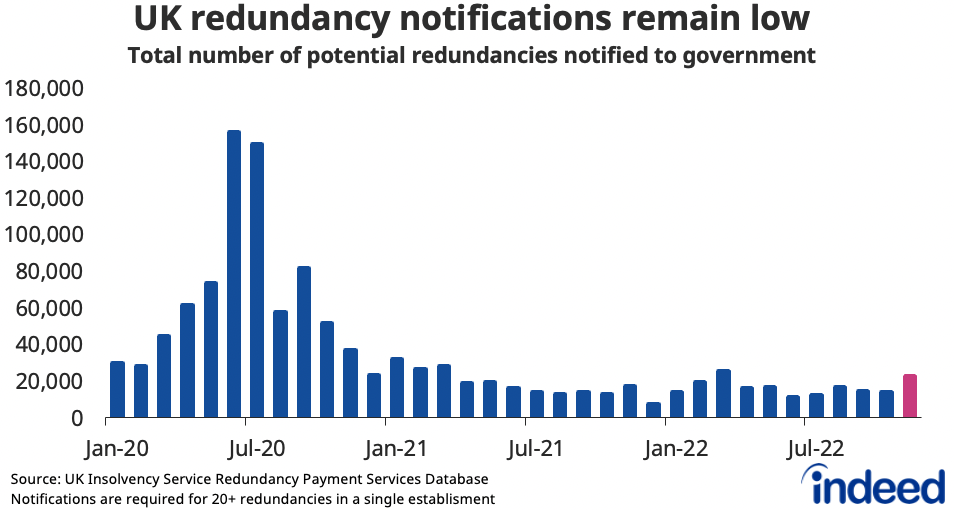
Redundancy Notifications Rise but Still Low
November saw an uptick in redundancy notifications to 22,580, the second-highest since March 2021, albeit well below the pandemic peaks. Redundancy notifications are an important early indicator of the health of the labour market heading into 2023. If they stay fairly modest, that could suggest an increased possibility of a soft landing for the labour market, with unemployment likely staying low for a while.
Outlook for 2023
There’s little doubt that the UK economy faces some daunting challenges in 2023. Households must endure tough times as high inflation hits living standards. However, the labour market will start from a strong position to withstand the forecasted turbulence.
Even though businesses may be nervous about recession, staffing shortages remain the pressing issue for many right now. Further improvements in labour force participation, particularly in terms of aiding the return of more older workers, would ease these pressures and provide a fillip to the economy in the process. There’s still a long way to go on that front.
If the labour market does stay reasonably tight despite a recession, that could allay fears of the balance of power shifting too far in favour of employers, some of whom might seek to curtail some post-pandemic forms of flexibility. In particular, remote work remains highly desired by candidates. Searches on Indeed containing terms related to remote work have risen over the course of the year to stand at record heights. For jobs that can’t be done remotely, other forms of flexibility including around hours and shift patterns have been a focus for employers struggling to hire.
The labour market has experienced an exceptional period during the pandemic recovery phase and it’s now about to begin a new chapter. The great hope is that the UK is poised to weather this shift, and that it will prove to be a gentler transition with less dramatic fall out than past economic downturns.
Looking for more information? We host the underlying job-postings chart data on Github as downloadable CSV files. Typically, data is updated one day after this blog post is published.
Methodology
Indeed Hiring Lab has re-released our Job Postings Tracker as the Indeed Job Postings Index, a daily measure of labour market activity that is updated and will continue to be released weekly. The primary difference between the Indeed Job Postings Index and the legacy Job Postings Tracker is the level.The Indeed Job Postings Index is set to 100 on 1 February, 2020, and this effectively provides a uniform level shift of 100 to the existing Job Postings Tracker across all time points. The Job Postings Tracker measured the percent change in postings from February 1st, 2020. For example, if the Job Postings Tracker were 40%, the corresponding Indeed Job Postings Index on the same date would be 140.
To calculate the average rate of wage growth, we begin by calculating the median posted wage for each country, month, job title, region and salary type (hourly, monthly or annual). Within each country, we then calculate year-on-year wage growth for each job title-region-salary type combination, generating a monthly distribution.
The number of job postings on Indeed.com, whether related to paid or unpaid job solicitations, is not indicative of potential revenue or earnings of Indeed, which comprises a significant percentage of the HR Technology segment of its parent company, Recruit Holdings Co., Ltd. Job posting numbers are provided for information purposes only and should not be viewed as an indicator of performance of Indeed or Recruit. Please refer to the Recruit Holdings investor relations website and regulatory filings in Japan for more detailed information on revenue generation by Recruit’s HR Technology segment.