The Canadian labour market is much tighter than it was two years ago. Last year, falling unemployment was the big story, which turned into rising job vacancies this year. While job growth slowed following a banner 2017, these trends suggest continued labour market strength, and that Canada could be running out of workers to maintain the recent pace of employment growth, at least outside of oil-producing regions.
However, still missing from the story is a pickup in wage growth. All eyes, including the Bank of Canada’s, will be watching for signs of stronger gains in compensation, which are key for improving living standards. What happens on the pay front will help clarify how tight the labour market really is.
A supportive economy has underpinned these labour market developments, but concerns are growing as we head into 2019. Some Canadian economic indicators have softened of late, the oil sector is troubled, and global financial markets have been volatile in recent months. Hopefully these developments will prove short-lived and won’t reverse the notable progress made in recent years.
1. Momentum slowed in 2018, but the job market remains in decent shape
In 2017, the Canadian labour market posted its largest annual jobs increase in years. Employment growth cooled in 2018, but the significant progress made last year wasn’t derailed. Moreover, how pronounced this slowdown was depends on which Statistics Canada employment measure you look at.
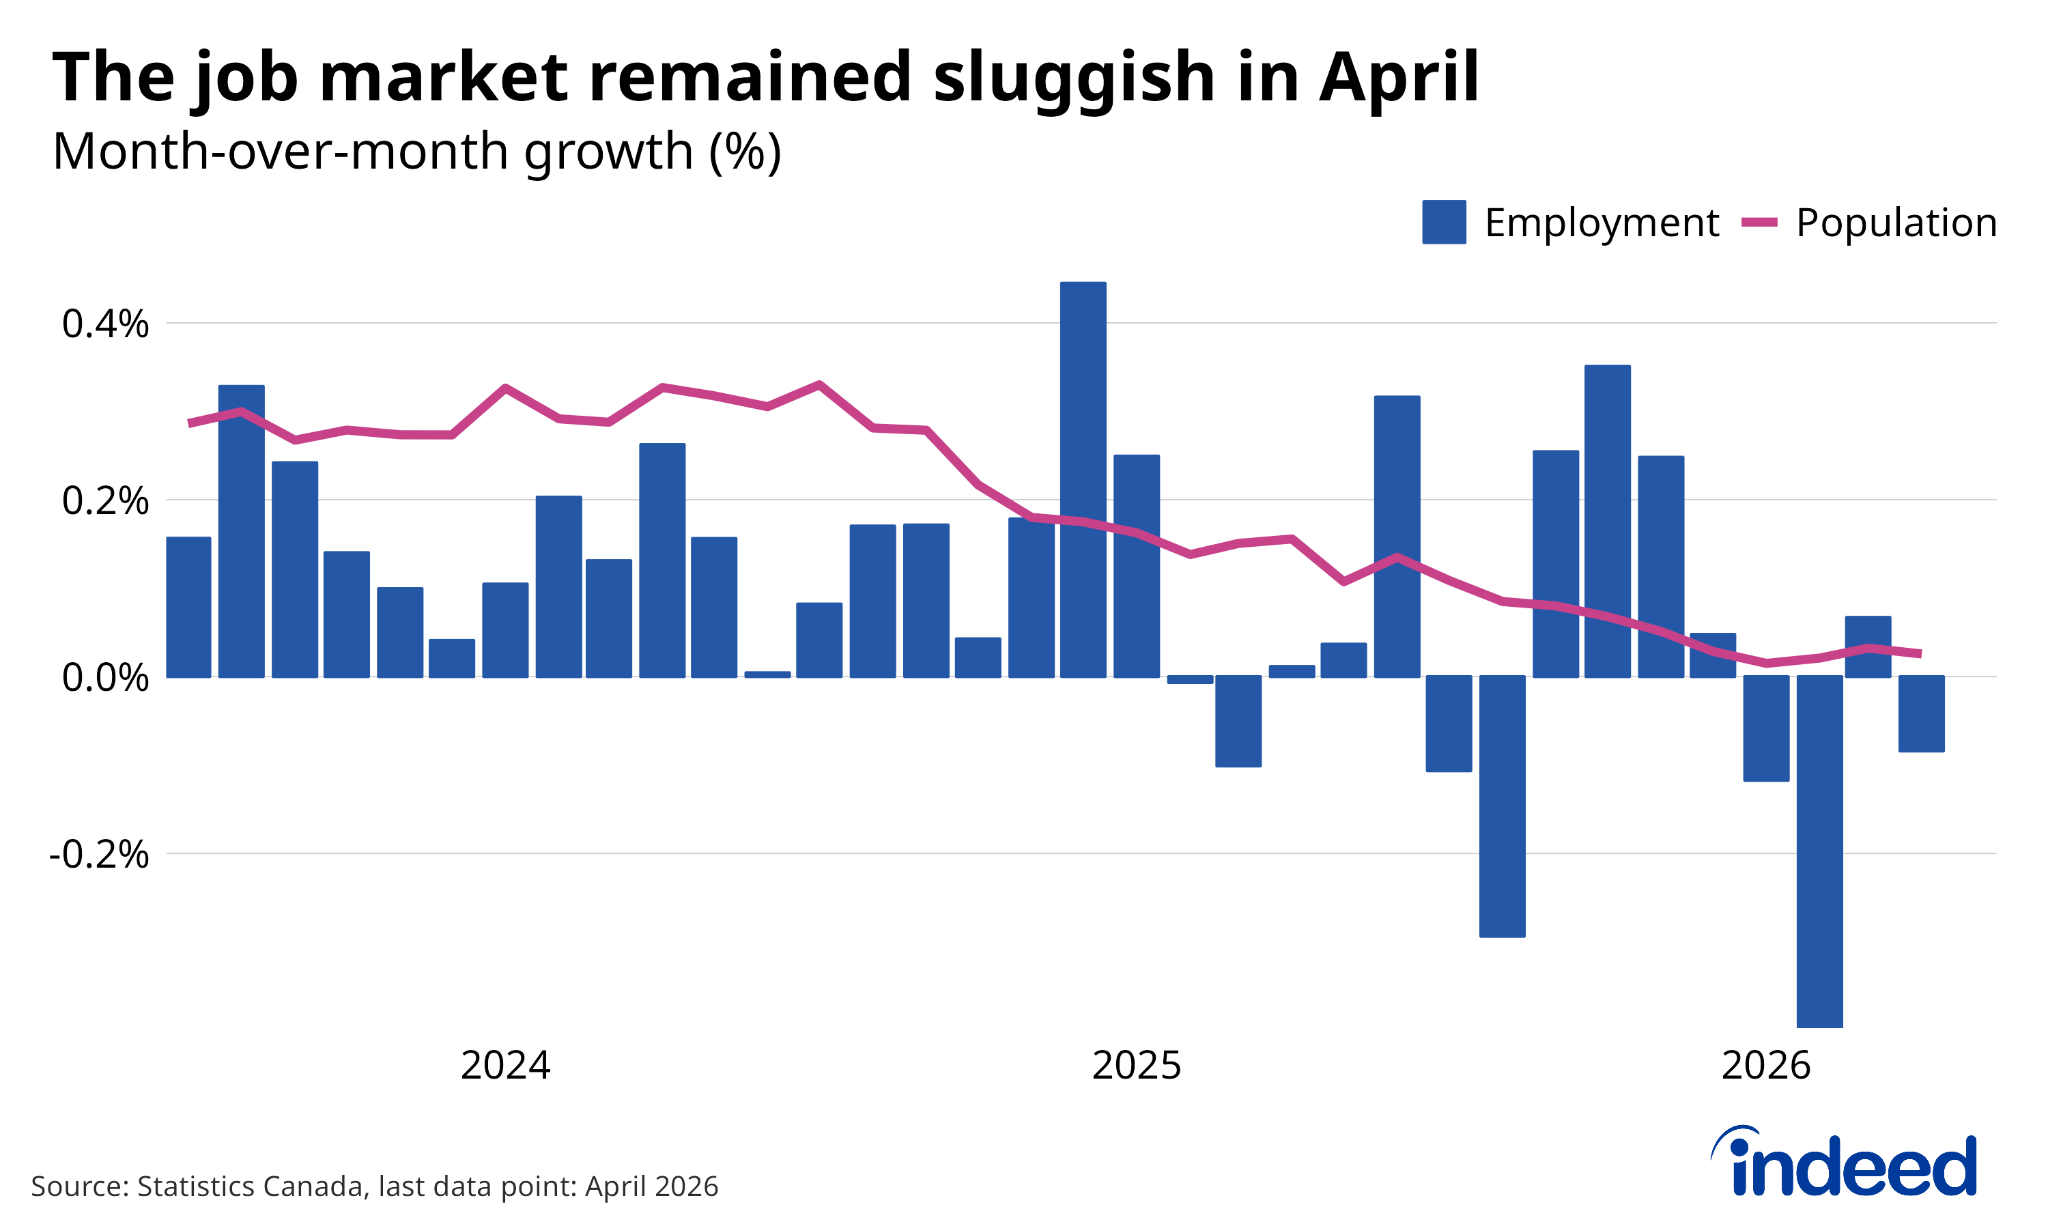
The 2018 drop in job growth was immediate and noticeable, according to the widely followed Labour Force Survey (LFS), which polls households. Employment growth hit 2.3% at the end of 2017 before a sharp pullback in January. Even with a record-large jump in jobs in November, the pace has still eased to 1.2%. In contrast, the slowdown in job growth was relatively mild, according to business payroll data tracked by the Survey of Employment, Payrolls, and Hours (SEPH). Year-over-year growth fell from 2.2% in December 2017 to 1.8% in September. This discrepancy between Canada’s two main employment measures makes it tricky to gauge recent momentum, though both show some slowing.

Still, even the weaker LFS numbers suggest the Canadian job market is in decent shape. The share of Canadians age 15 to 64 with a job — the working-age employment rate — dropped at the start of the year, but by November had returned to its all-time high of 74.1% reached last December.

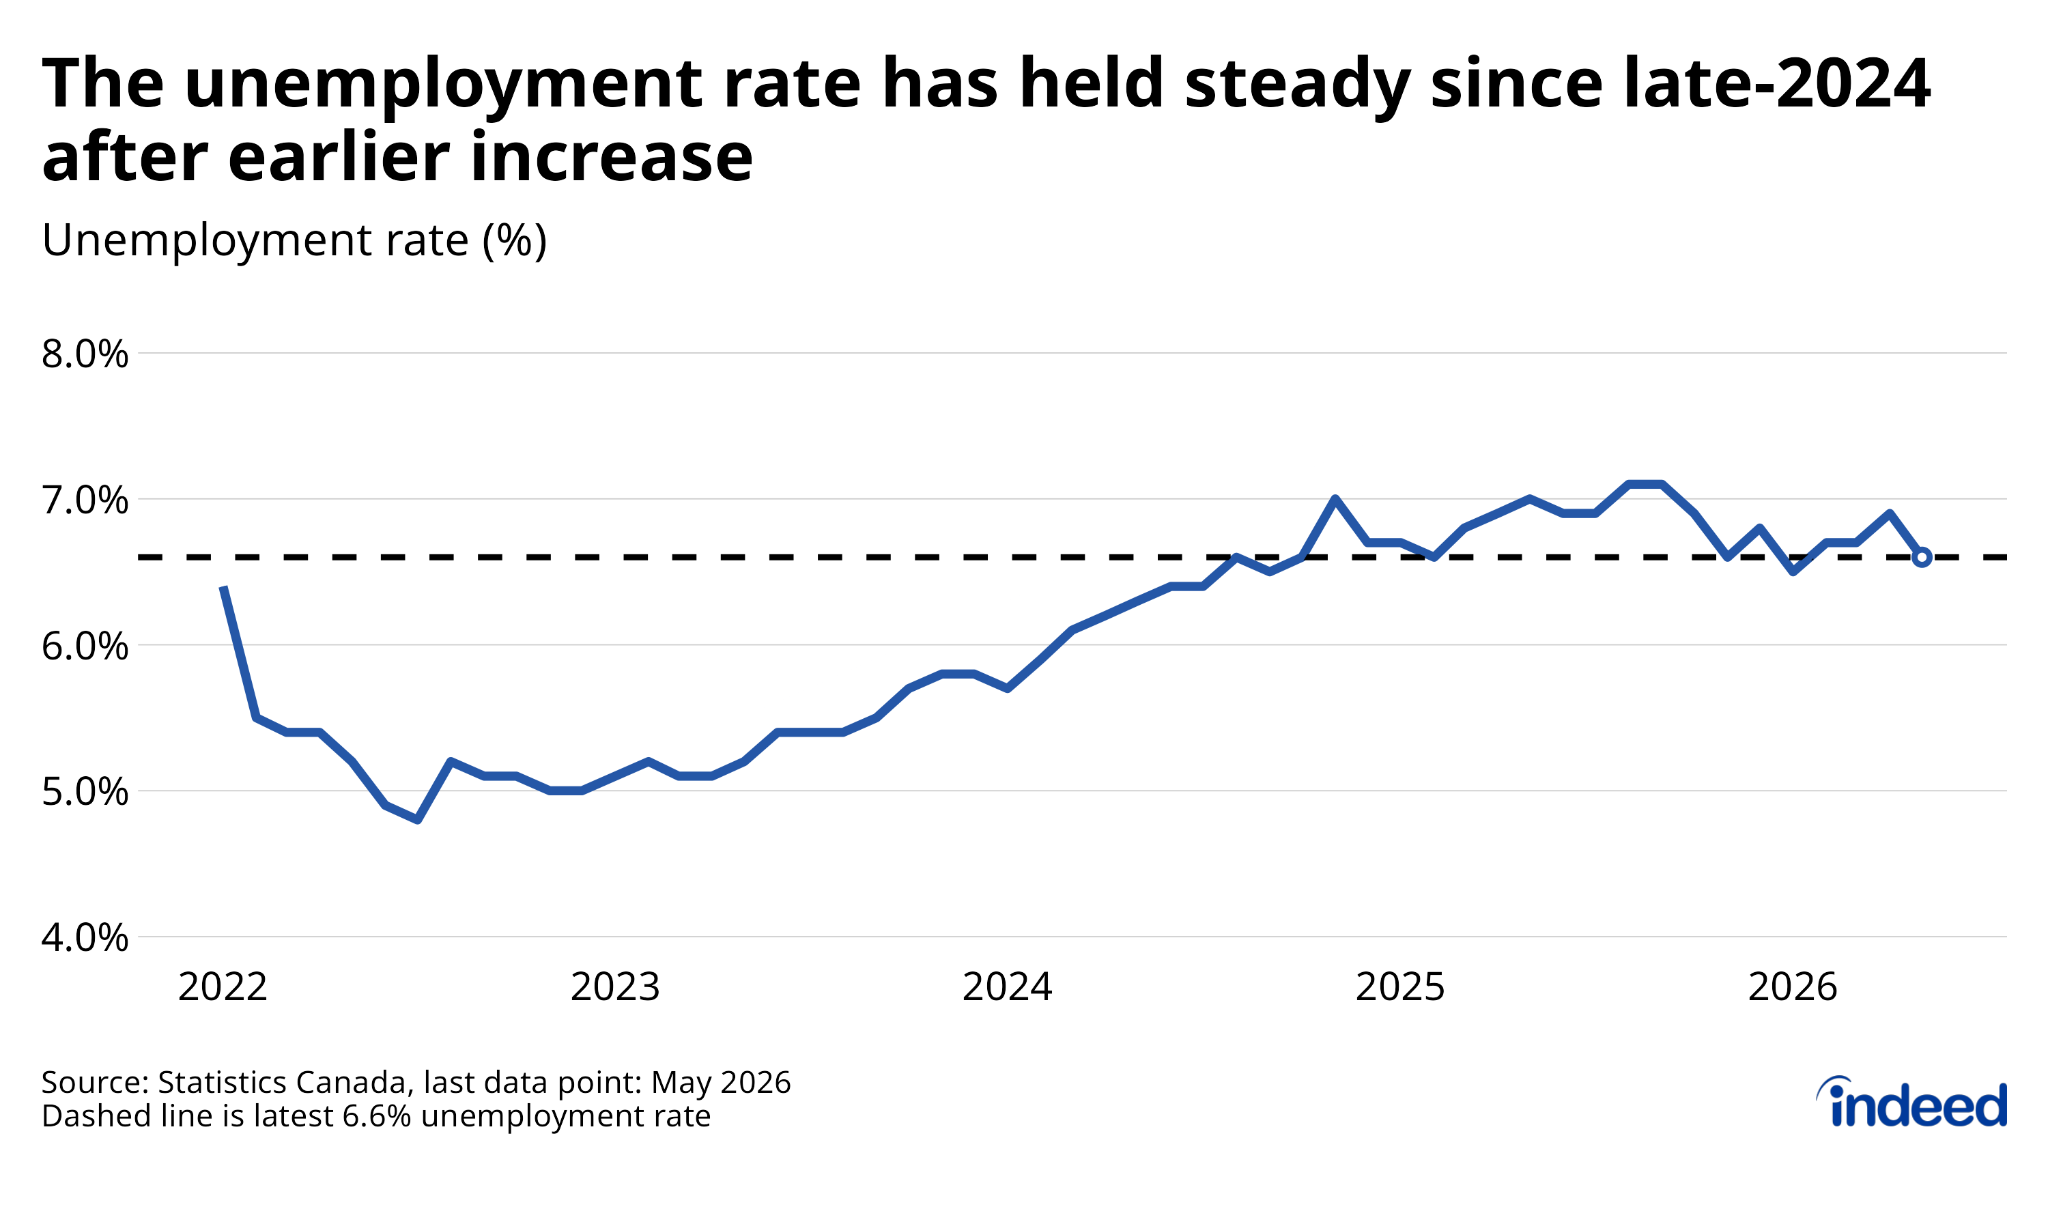
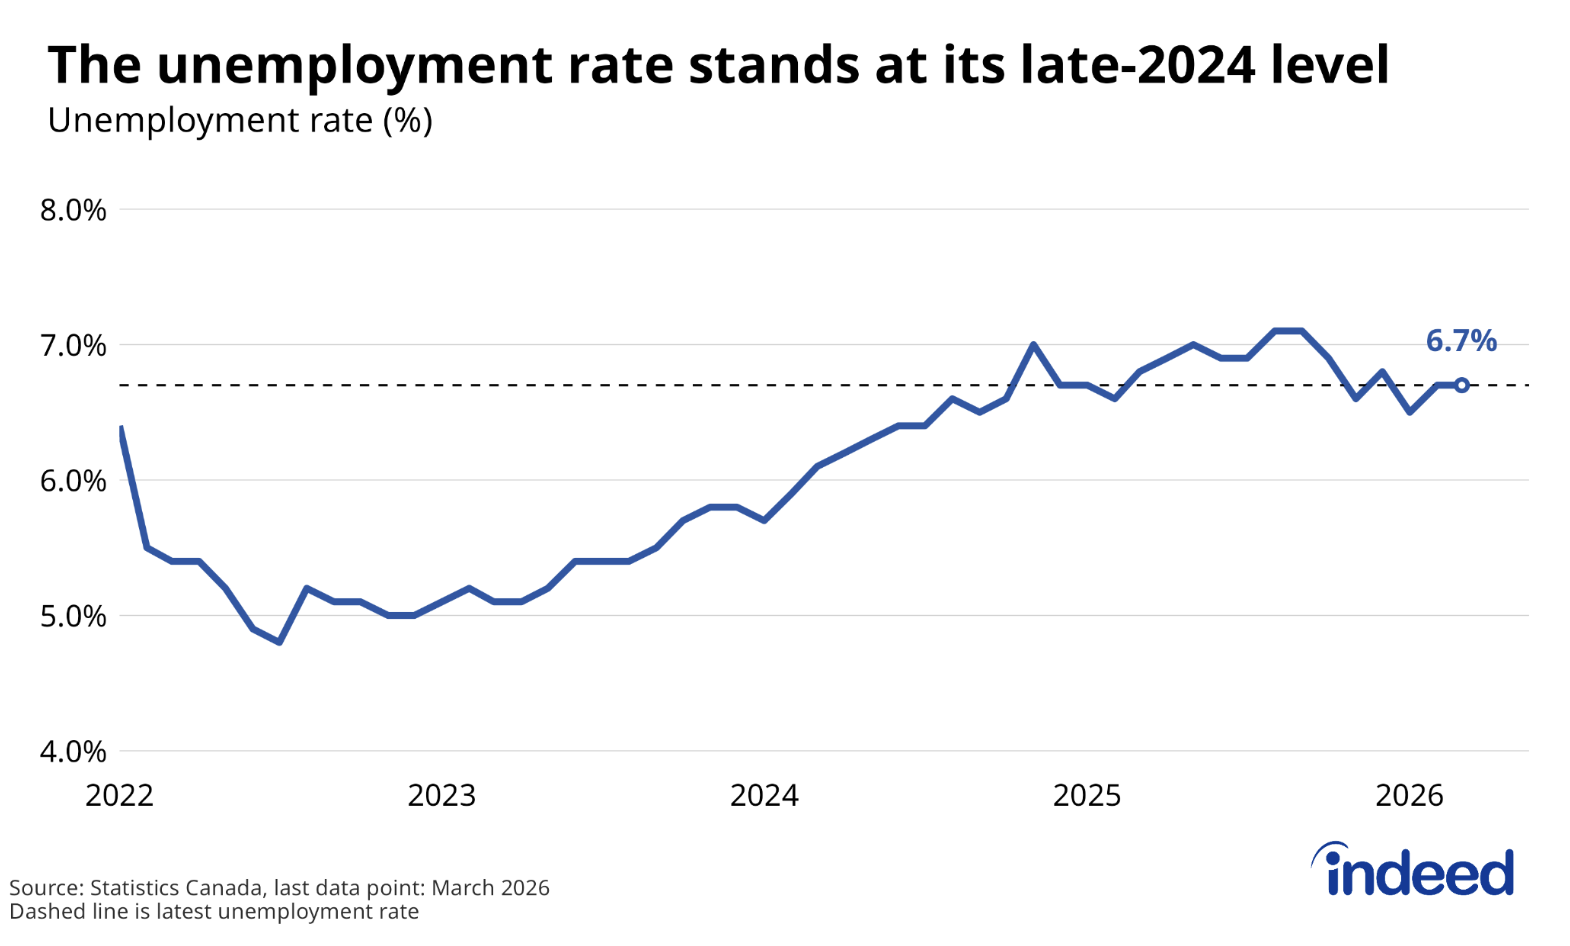
The performance of the unemployment rate roughly matched these movements in the working-age employment rate, dipping to its lowest level since data has been consistently recorded. Not only is joblessness down, but the share of part-time workers who’d rather work full-time hours has also fallen. Even with job growth slowing in 2018, labour markets in most provinces remain in good shape.
2. Employers reported growing hiring difficulties in 2018
With business conditions in the Canadian economy generally solid and an aging population moving into retirement, employers are looking to hire. Job vacancies hit a record high of just under 550,000 in the second quarter, up 19% from a year earlier. The share of full-time job openings also rose to 72.5% in the second quarter from 69.9% a year earlier, a sign that employers have significant hours to fill.

However, not all these job openings are getting filled. The Bank of Canada’s Autumn Business Outlook Survey found 37% of businesses reported labour shortages affecting current operations, the highest share since the 2008 financial crisis. Moreover, increased hiring difficulty isn’t just confined to certain specialized jobs. The Canadian Federation of Independent Businesses finds a growing share of businesses also identify shortages of unskilled and semi-skilled workers as impediments to expansion. How employers navigate this tougher hiring environment is shaping up as a key question for the Canadian labour market in 2019.

3. Will a tighter labour market finally translate into wage growth?
Missing from the current picture is strong wage growth, a theme common in several labour markets across the world. Despite spreading reports of hiring difficulties, the Bank of Canada’s wage-common indicator — which provides a unified signal from various hourly wage measures — rose a fairly modest 2.4% year-over-year in the third quarter. This pace roughly matches wage growth seen between 2012 and 2014, even though the labour market is in stronger shape today.

Both recent and long-term factors appear to be weighing on wage growth in the face of a tighter labour market. These range from lingering effects of the oil price drop to global trends reducing productivity growth, such as falling entry rates of new businesses.
Still, none of these factors rule out the potential for paychecks to post larger increases going forward. If demand for workers remains high amid a low and stable unemployment environment, something’s got to give. Broadening the search for candidates can help employers looking to hire, while further reducing the unemployment rate. Still, some employers will find it tough to find workers without offering higher wages.
The Bank of Canada and financial markets will be following wage growth closely in 2019. The Bank currently expects a pickup, which represents an important component in its forecasts. As a result, surprises either way — jumps or a continued flat trend — are likely to influence monetary policy expectations. At the same time, how supportive the current economic environment is for strong wage growth varies by region.
4. Labour markets in oil-producing provinces still struggling
Jobs might be plentiful in Canada overall, but oil-rich provinces are lagging. Several labour market indicators across Alberta, Saskatchewan, and Newfoundland have barely improved since the 2015 downturn, while job vacancy rates are below the national average.
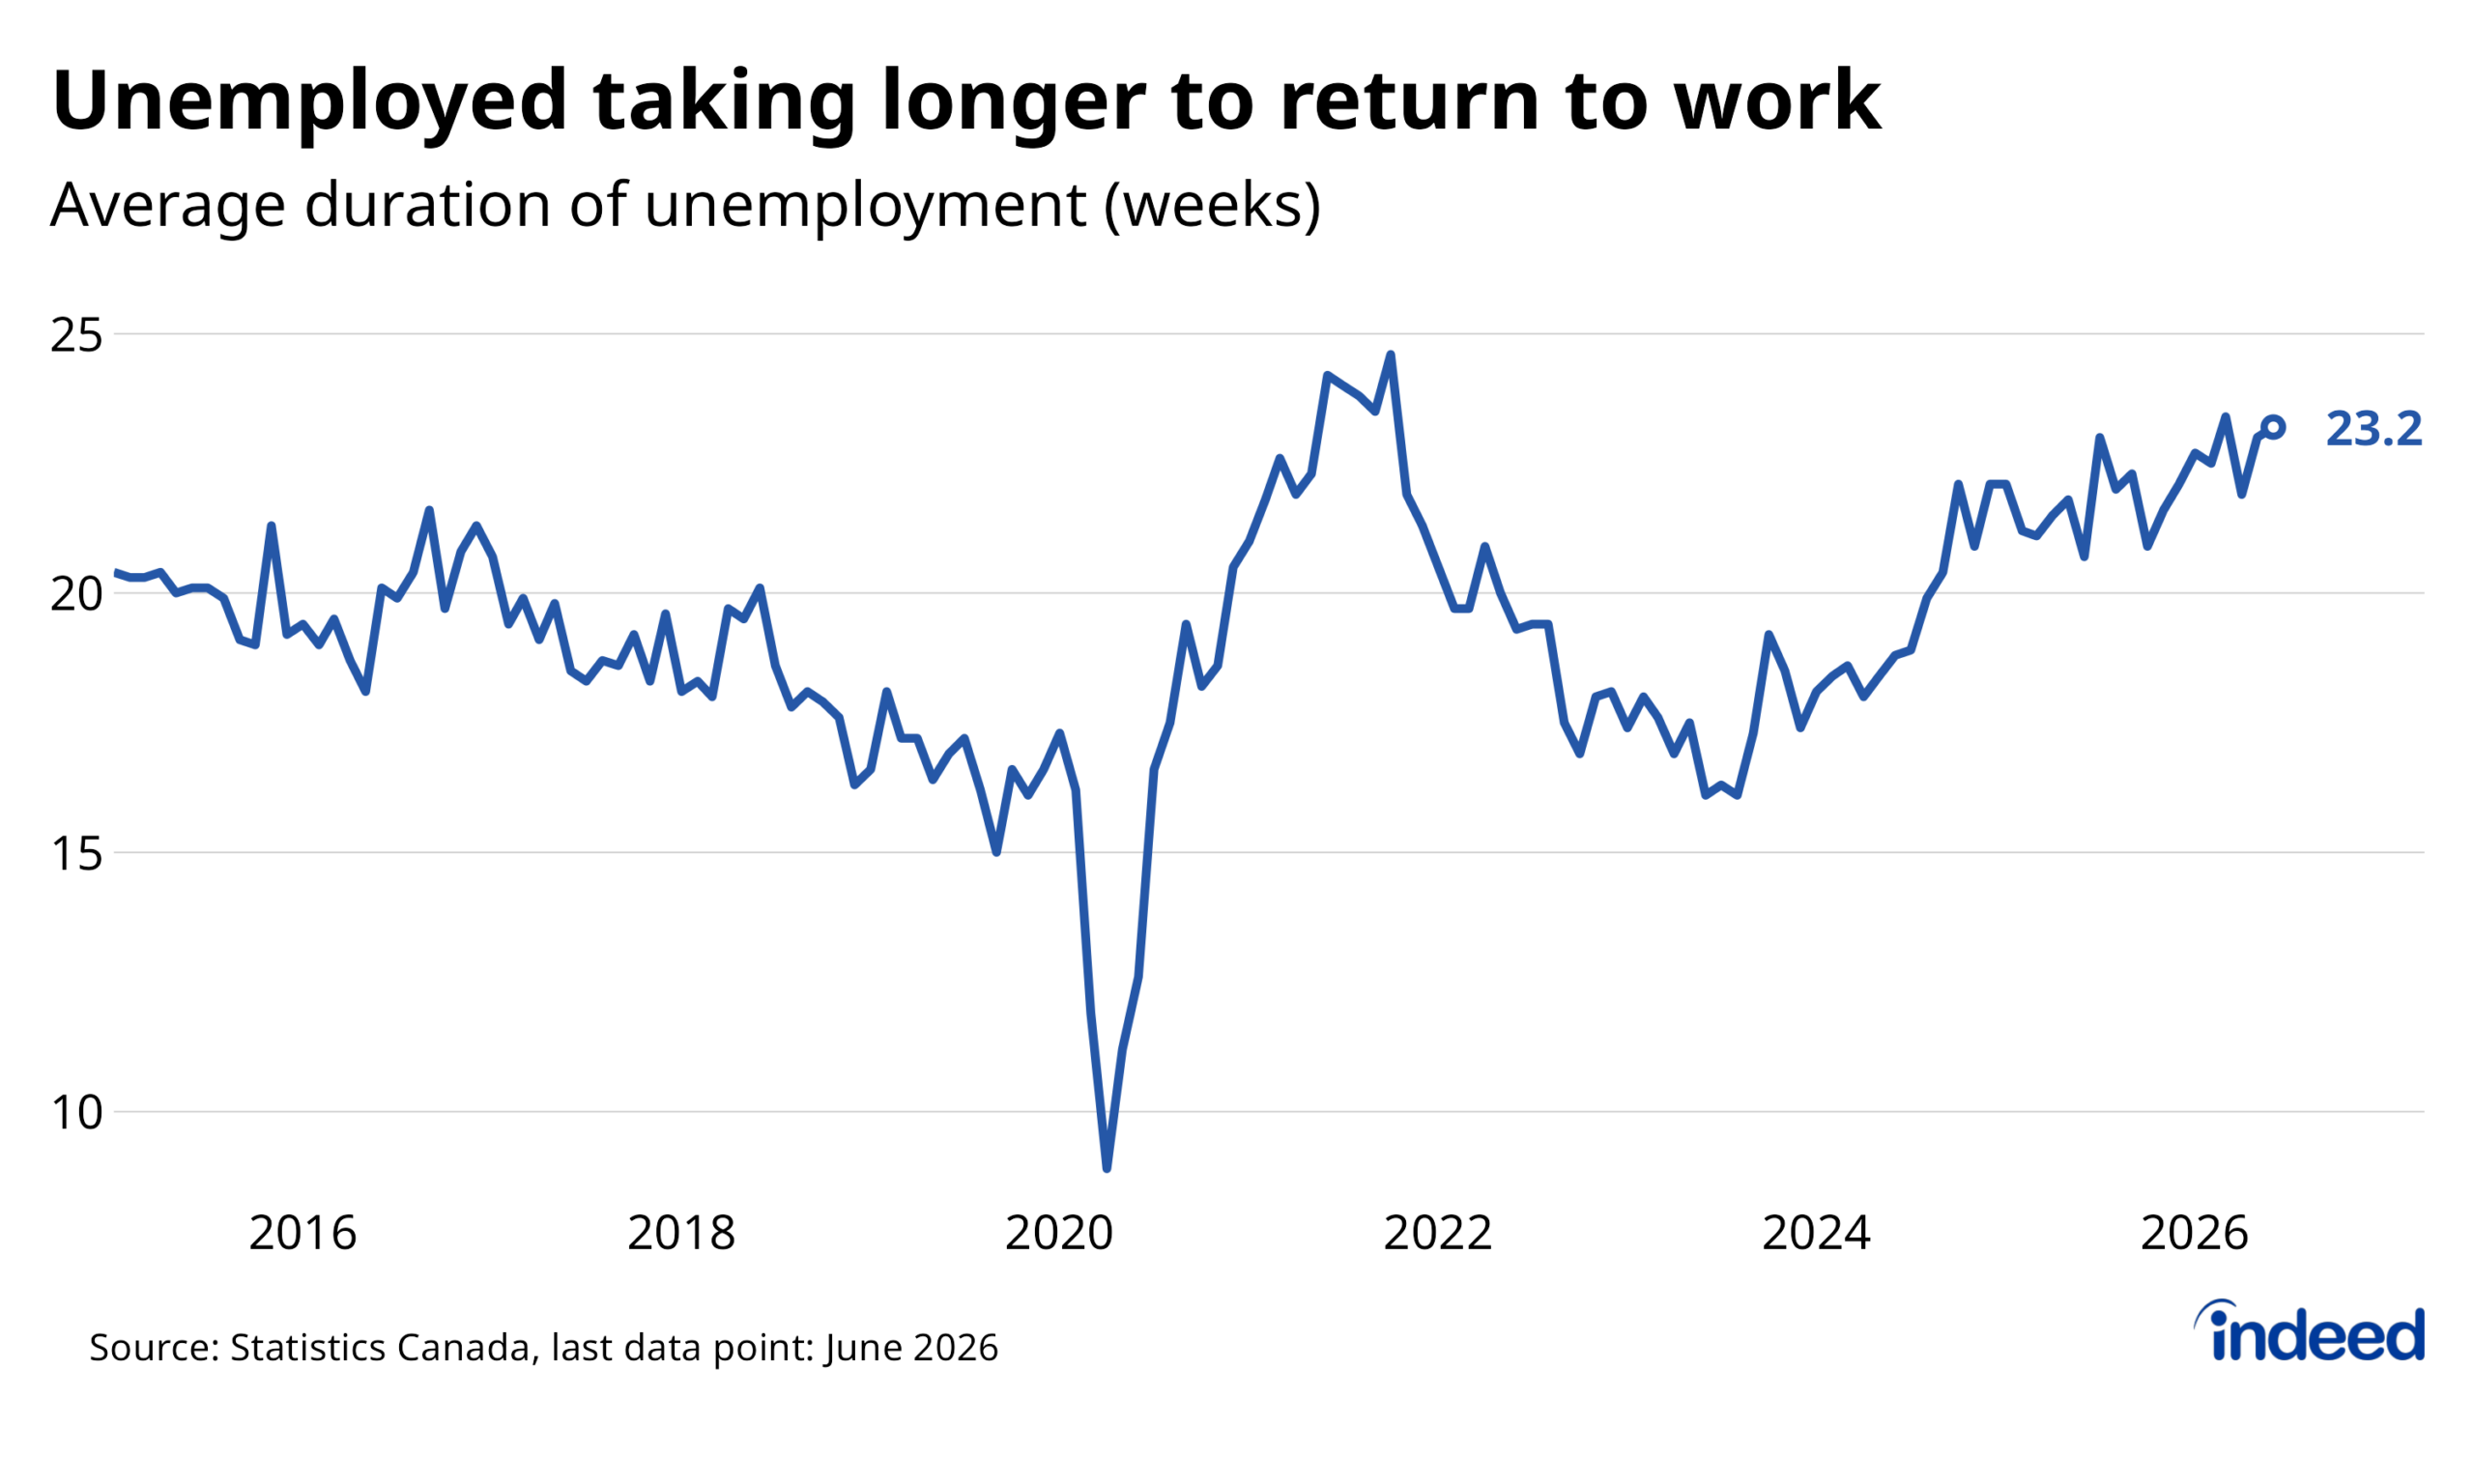
One of the notable differences across regional labour markets is the contrasting trends in average duration of unemployment. Typical jobless spells in oil-producing provinces like Alberta and Saskatchewan used to be the shortest in the country. Now though, they average 21 weeks (on a 12-month moving average basis), six weeks longer than in mid-2014. In contrast, there’s been gradual progress in the rest of Canada, where unemployment duration is down nearly four weeks over the same period. The Canadian labour market won’t be a full good-news story until jobless spells see further reduction, especially in oil-rich regions.

5. Will the economy support a healthy labour market in 2019?
While labour market data isn’t flashing yellow, other Canadian economic indicators have softened of late, including underwhelming third-quarter GDP growth. Combined with recent volatility in global financial markets, these jitters were enough for the Bank of Canada to downgrade the tone of its outlook this month as it kept its policy rate unchanged. Since the financial crisis, global growth has tended to rebound from bouts of uncertainty like the current one. Nevertheless, concerns remain.
One risk to the Canadian labour market is that ongoing challenges in key sectors such as natural resource extraction and housing-related industries could start weighing more heavily on hiring. Both sectors face major headwinds, including a widening oil price gap in the resource sector, and slowdowns in home sales and housing starts. So far though, payrolls in these industries are down just slightly from their recent highs, but larger declines are possible in the period ahead.
The Canadian labour market is at somewhat of a crossroads heading into 2019. A nice improvement in job market conditions in 2017 followed by reports of hiring difficulties in 2018 have created an environment that should support wage growth. But will it come? And will the broader economic conditions that have boosted the labour market in recent years persist? These are some of the key themes we’ll be watching in the year ahead.