
Key points:
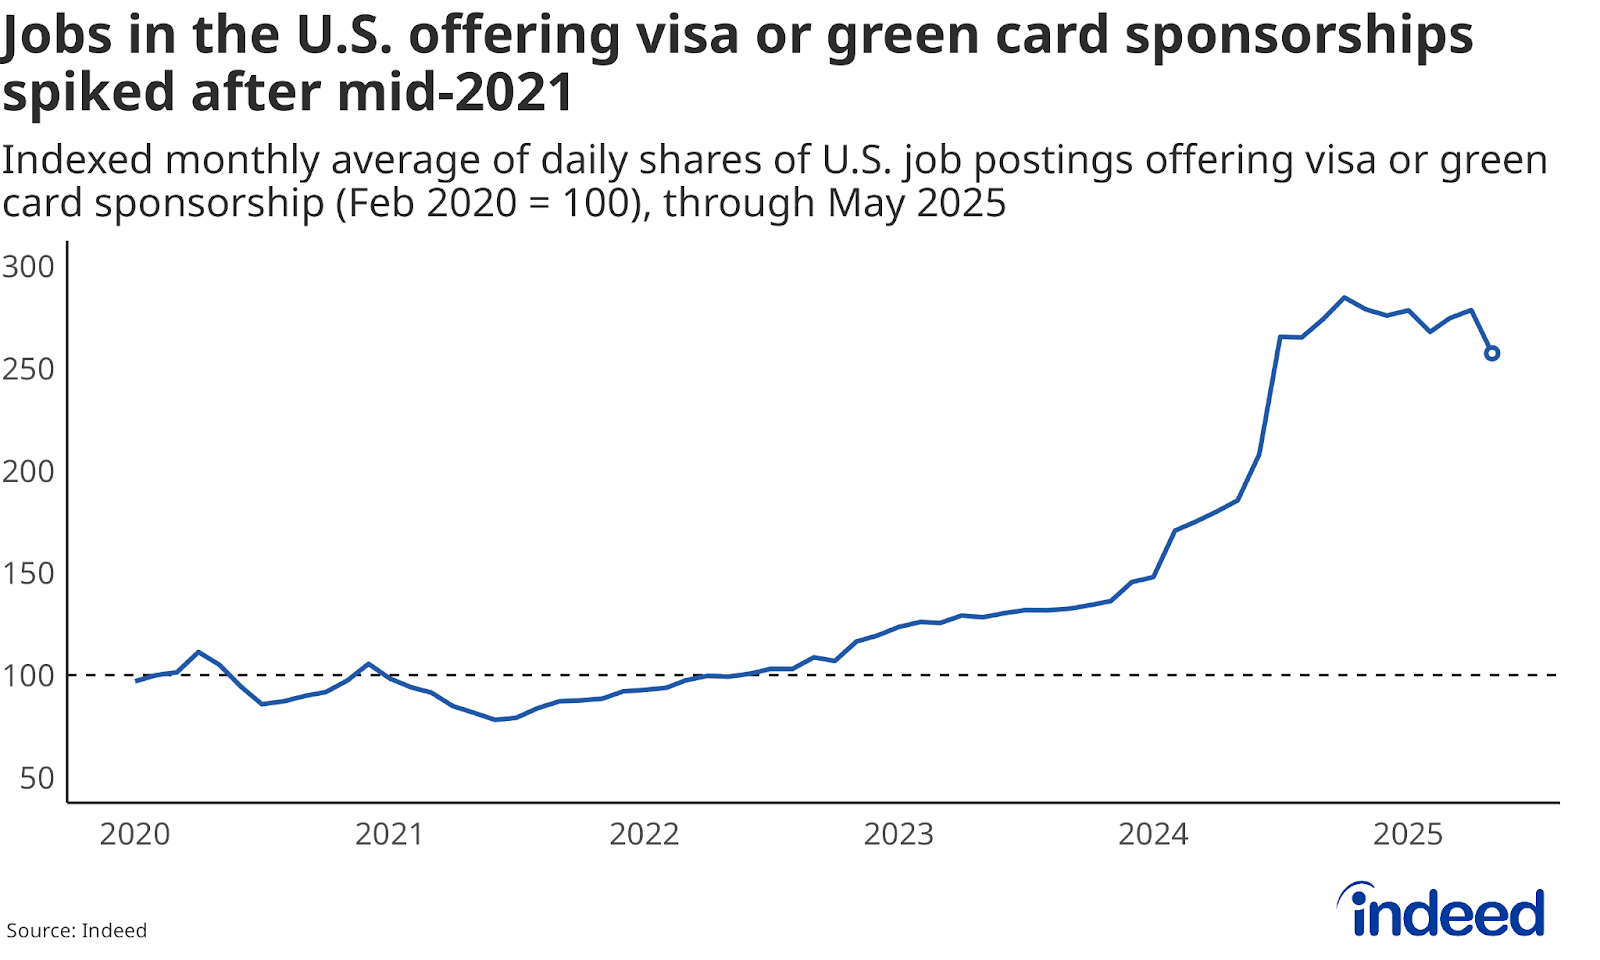
- Since mid-2021, the share of job postings on Indeed that include visa support (such as visa or green card sponsorship) has been rising, surging by almost 285% by October 2024 in the U.S., compared to the pre-pandemic baseline.
- In May 2025, over 3% of all U.S. job postings for physicians & surgeons offered visa or green card sponsorship, and almost three-fourths of all job postings that include immigration benefits were in the healthcare sector.
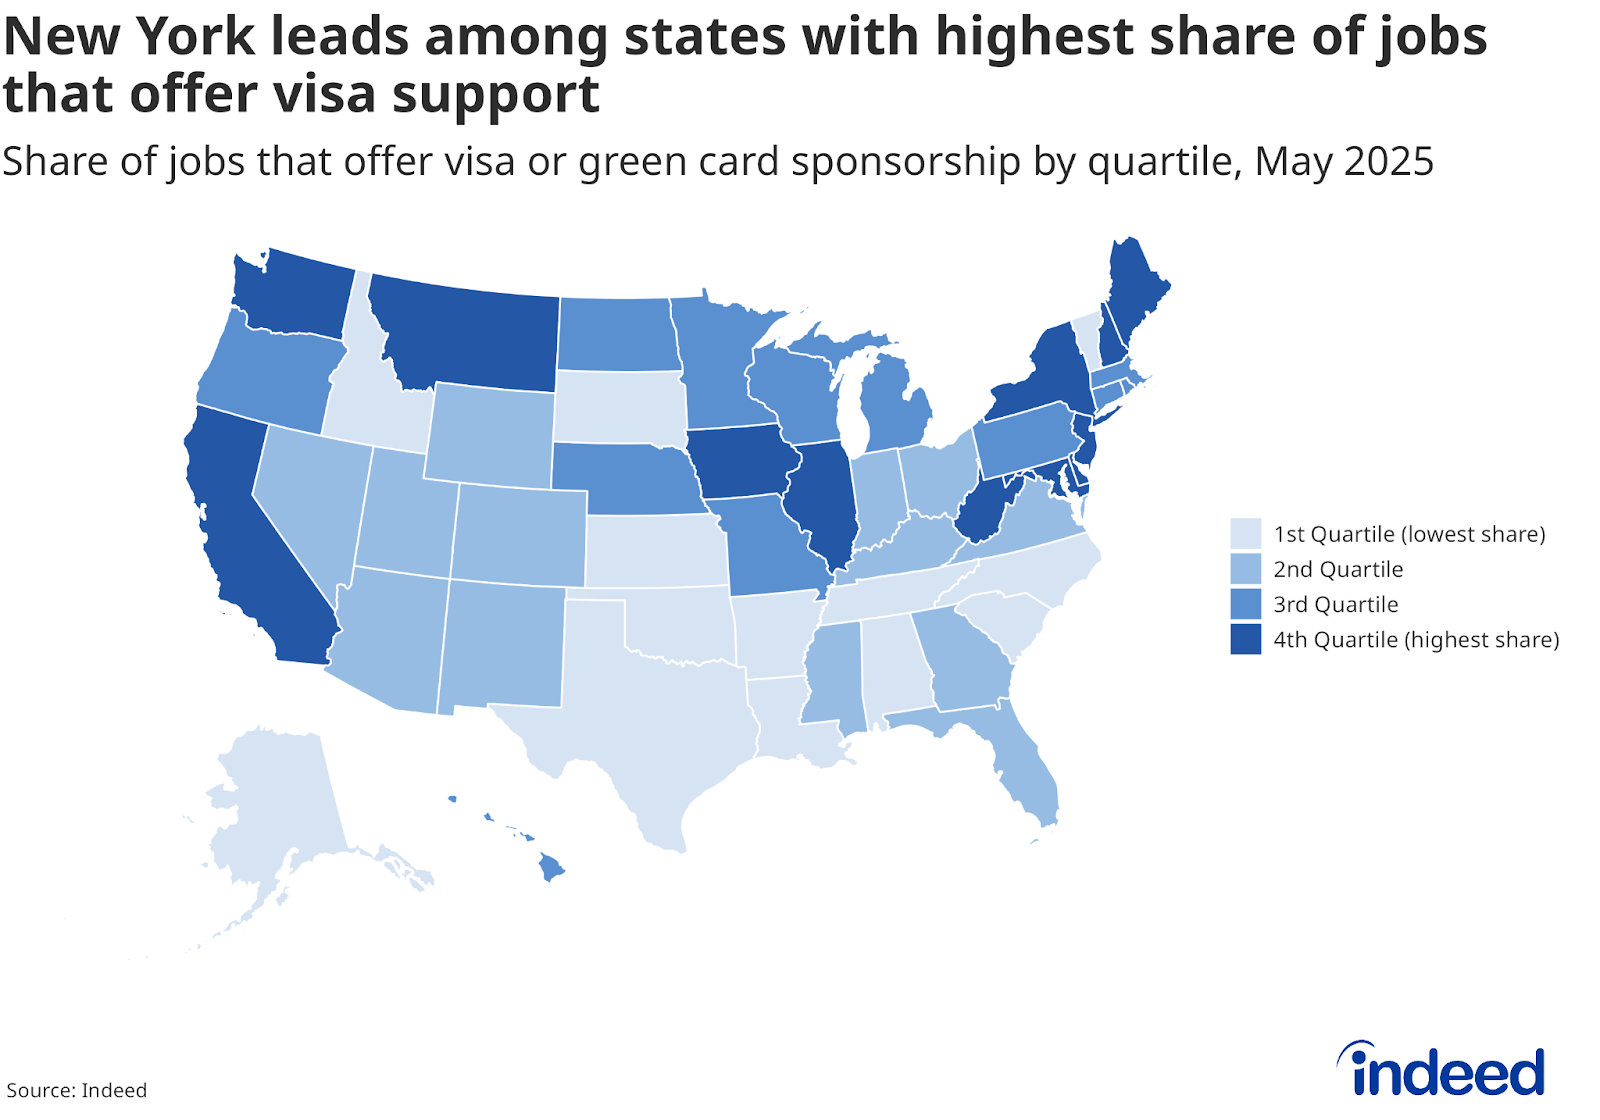
- 20% of all job postings in the U.S. offering immigration support in May 2025 were in New York.
- The share of job seekers’ searches which included visa sponsorship-related terms in U.S. job postings rose in early 2020, peaked in July 2020, and has remained elevated ever since.
Editor’s Note: This research was conducted and published prior to proposed changes to the US H1-B Visa program announced in late September 2025. This piece follows part one of our global mobility series, which examines foreign job seekers’ interest globally.
The share of U.S. jobs offering immigration support, including work visas or permanent residency sponsorship (also known as a “green card”), started to rise in mid-2021 and almost quadrupled over the next three years. And because not all roles that ultimately do offer such assistance will overtly note it in the job description, this rapid growth is evidence of both a growing openness towards hiring foreign-born workers, and an increased willingness to directly say so in a job posting.
Employment-based visas have played a key role in immigration policy debate over the past few months, especially as the United States grapples with labor shortages in key sectors and an aging population that is increasingly reliant on foreign-born labor. The country currently utilizes a demand-driven approach to economic migration, with most prospective foreign-born workers requiring an employer to “sponsor” their visa. Tracking where and how such immigration benefits show up in job postings offers critical insights into employers’ needs and the ongoing role of the U.S. as a global hub for skilled workers.
After reaching a post-pandemic low of 0.04% in June 2021, the share of jobs that offered such support increased to a peak of 0.16% in October 2024. That share has since slipped slightly to 0.14% as of May 2025, but remains elevated relative to historic norms. It is too soon to tell if the recent decline is a typical seasonal fluctuation or the start of a more sustained decline in the face of mounting immigration restrictions and policy changes. When indexed to February 2020, there is a clear upward trend beginning in June 2021, which steepens in 2024 before leveling off after October 2024.
New York made up over 20% of all jobs in the country that offer such immigration support — almost 0.5% of all jobs in the state — followed by California at 12.5% and Illinois at 6.5%. This is notable given that New York, California, and Illinois represented just 4.7%, 8.7%, and 3.6% of all U.S. job postings in May 2025, respectively.
Healthcare and STEM fields lead the way
Breaking down by occupation reveals that medical fields are currently most likely to offer visa sponsorship. In May 2025, 3.2% of all job postings for physicians & surgeons offered visa sponsorship, followed by roles in therapy (1%), dental (0.6%), and pharmacy (0.5%). These four occupations collectively comprise almost three-fourths of all jobs that include immigration benefits in the job posting.
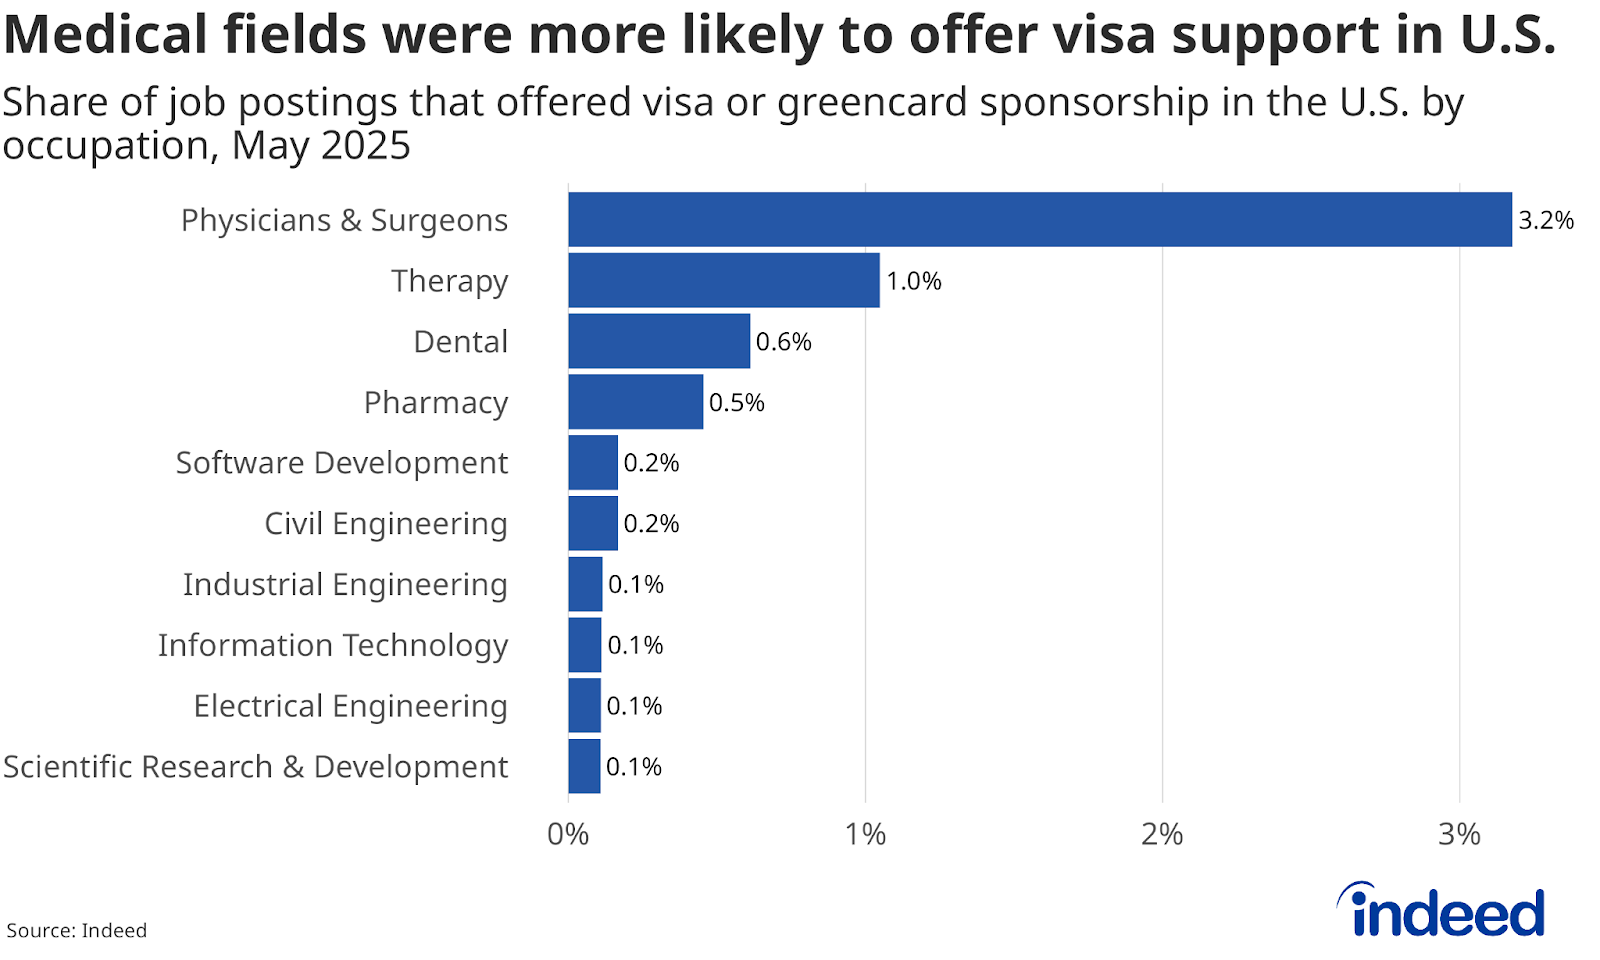
Notably, over 18% of all physician & surgeon jobs in New York offer visa or green card sponsorship, accounting for over 14% of all jobs offering such immigration support nationwide. The aforementioned occupations in the healthcare sector were also among the top occupations offering visa and green card sponsorship in California and Illinois.
Other STEM fields represented the rest of the list of top 10 occupations offering immigration support in the U.S., a sign of the country’s continued reliance on immigrant workers in these sectors.
A focus on healthcare roles
The U.S. is poised to face a potential shortage of tens of thousands of physicians by 2036, according to the Association of American Medical Colleges. Immigrant doctors could offer a pathway to fulfilling that demand; almost one-in-four active U.S. physicians attended medical school outside the U.S. or Canada. Generally referred to as international medical graduates — or IMGs — they often require immigration support (including H-1B or J-1 visa sponsorship) from employers to get authorization to work in the U.S. As a result, the share of physician & surgeon job postings that mention visa or other immigration support has continued to rise since 2021, avoiding the recent plateau seen in overall job posting trends.
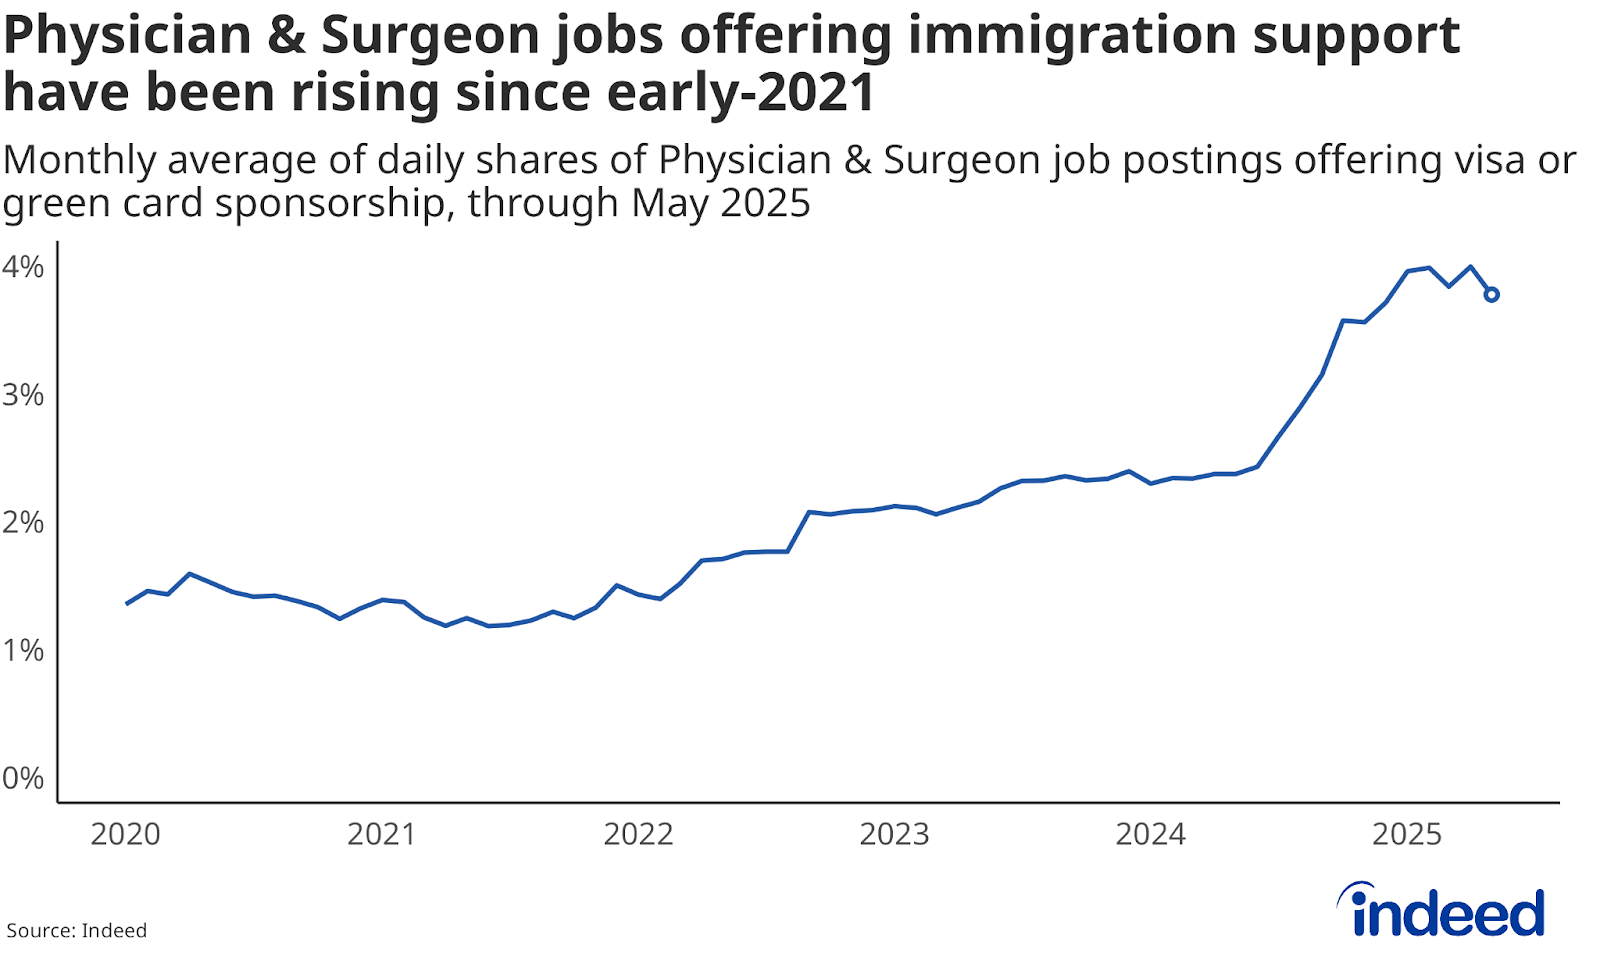
This sustained elevation in visa sponsorship for medical roles signals that shortages may already be materializing, not just projected for the future.
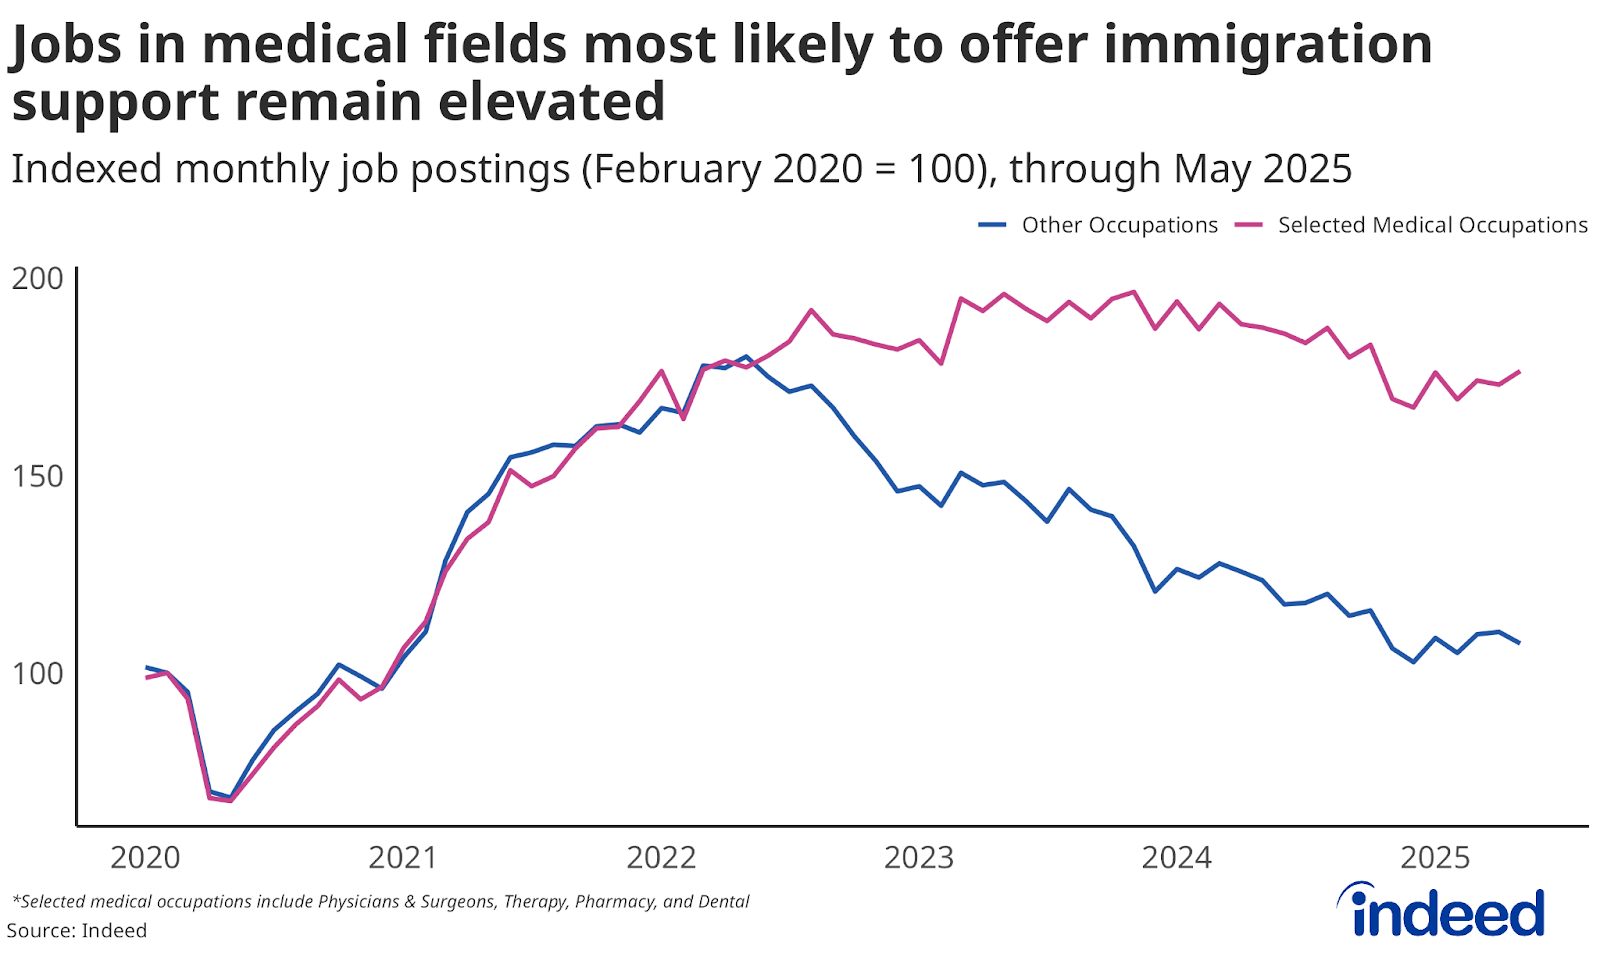
Employers appear to be responding in real-time in key healthcare occupations, where demand remains high. Unlike job postings in other fields, which have declined since late 2022 to almost pre-pandemic levels, roles in key medical fields remain elevated, suggesting that immigration is serving as an active tool for addressing persistent gaps in the labor market.
Employers show a clear willingness to sponsor more workers
One way to understand employers’ demand for skilled immigrant workers is H-1B applications. H-1B is a temporary work visa for foreigners with a job offer in the U.S. and is the most common visa for skilled foreign-born workers. The number of H-1B visas issued each year is capped at 85,000 (with some nonprofit organizations, research institutions, and universities being exempt from this cap), and candidates are selected annually through a lottery.
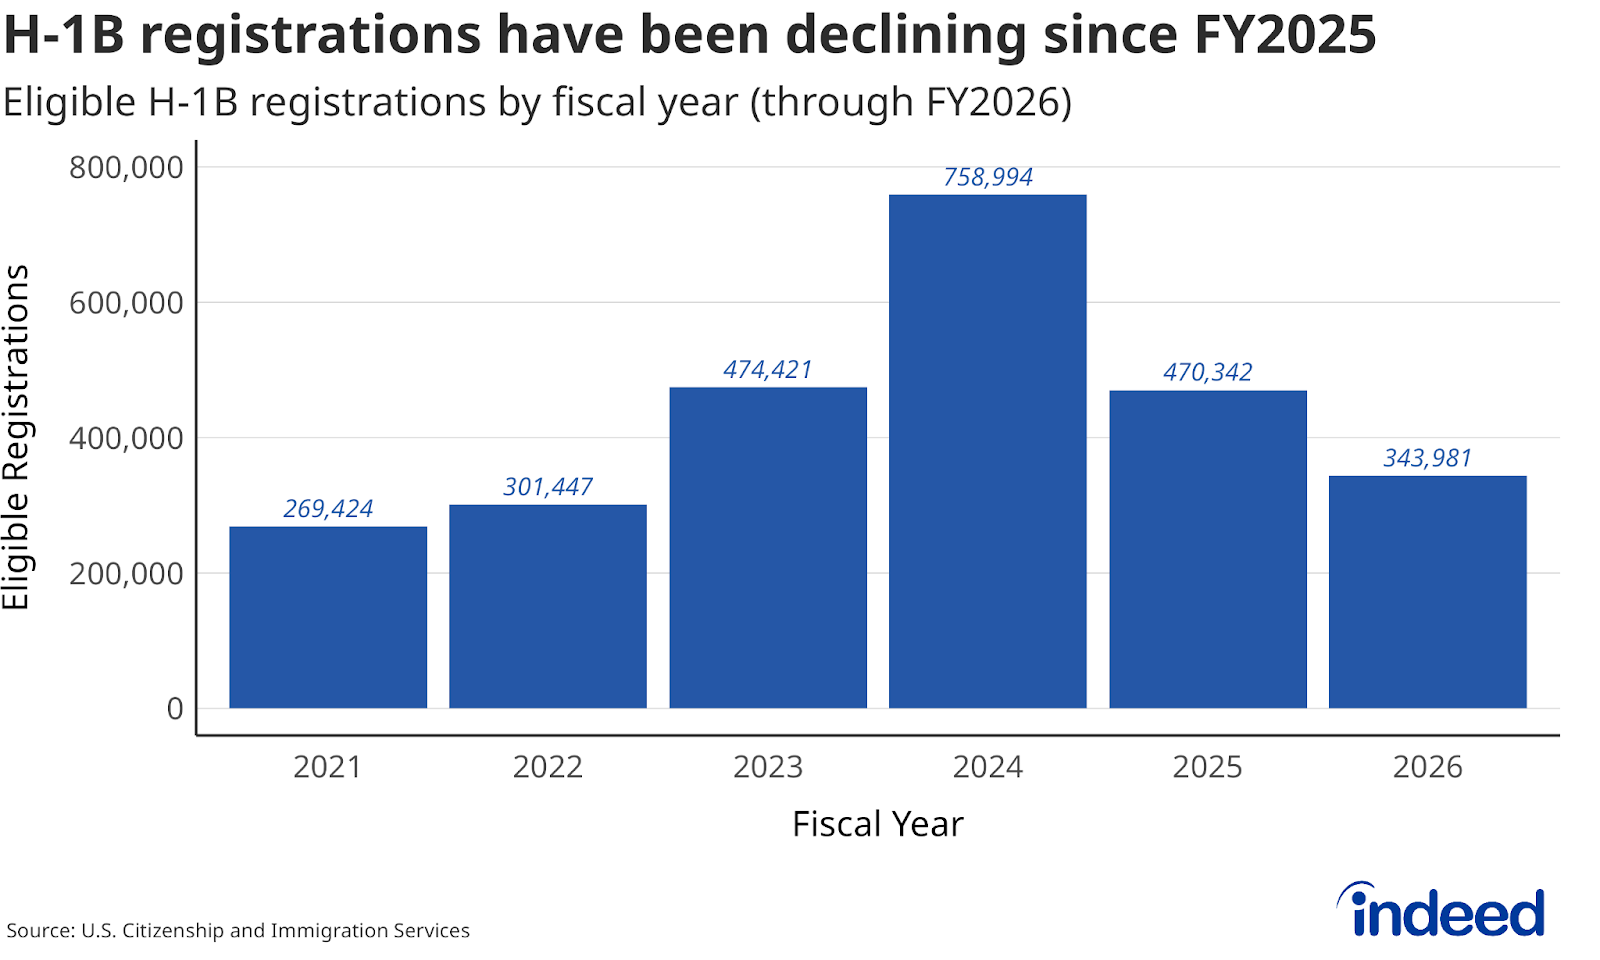
On one hand, the number of applications has been trending downwards, which can be attributed to regulatory changes in the selection procedure and a spike in application fees. However, even with recent declines, the number of applications in recent years has consistently been at least three times higher than the 85,000 threshold. This suggests that many more employers are willing to sponsor immigrants to fill critical labor shortages than there are visas available.
Other popular temporary work visa categories in the U.S. requiring employer sponsorship include H-2A, H-2B, L-1, and O-1. Unlike the H-1B category, most of these categories have no annual statutory limit. In 2022, almost one million temporary foreign worker visas were issued, a 14% increase from 2019. Once granted one of these temporary visas, many employees are then eligible to be sponsored for permanent residency by their employer under one of the five employment-based green card categories.
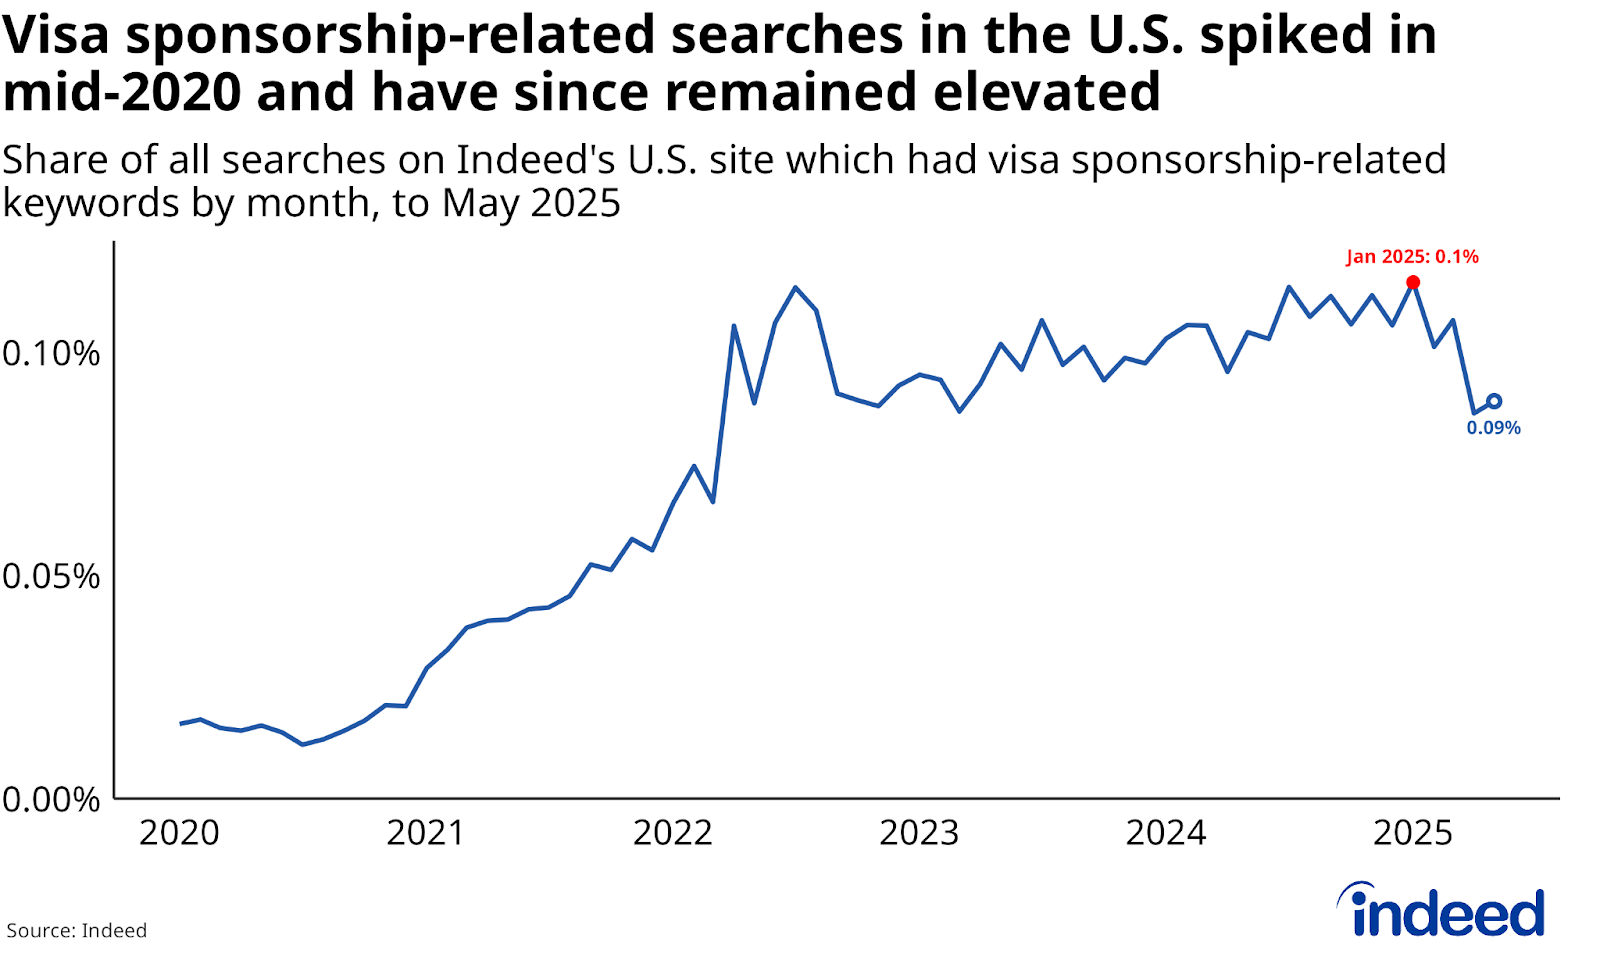
Searches for visa sponsorship are elevated but falling
The share of all searches on Indeed’s U.S. site that included visa sponsorship-related terms, reflecting job seekers’ demand for immigration support, reached a high of 0.1% in January 2025 — more than six times the pre-pandemic baseline in February 2020 — but has since fallen to its lowest levels since late-2022. It remains to be seen if this recent dip signals the beginning of a broader downward trend.
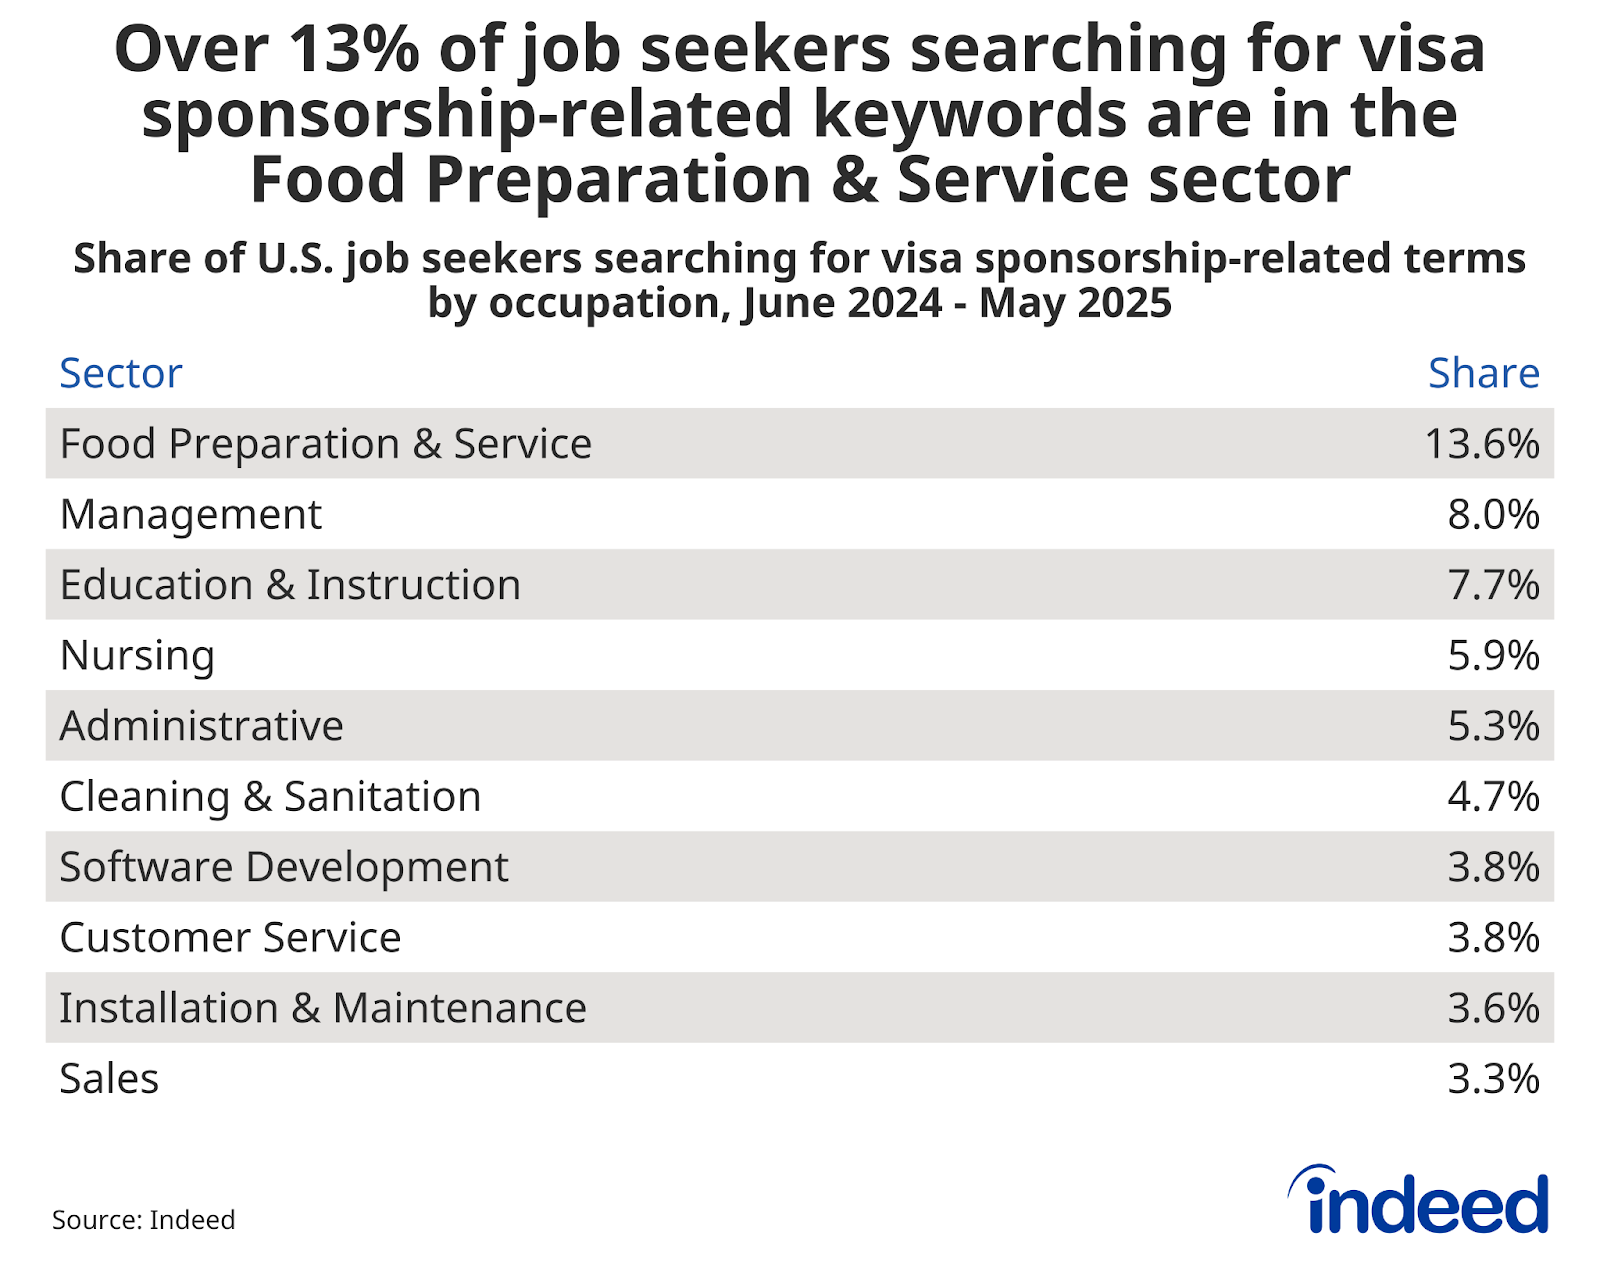
These include job seekers currently in the U.S. and those abroad but searching on the U.S. site. Of the job seekers currently in the U.S. who have searched these terms in the last year, 13.6% are currently in the food preparation & service sector, followed by 8% in management, and 7.7% in education & instruction.
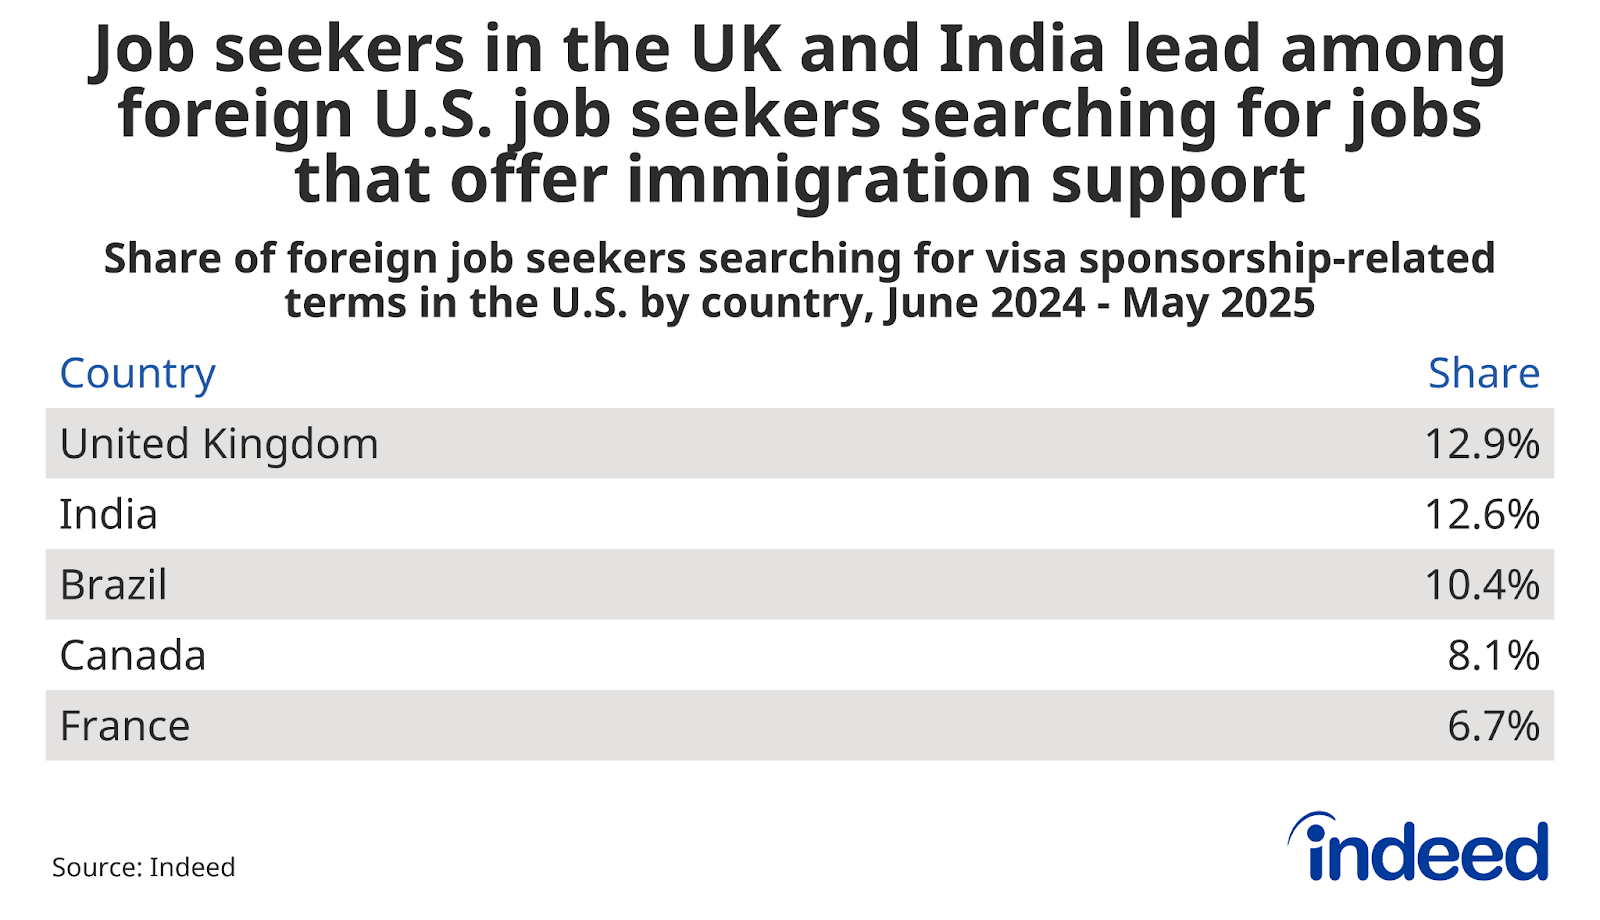
Of the job seekers outside of the U.S. searching for visa sponsorship-related terms on the U.S. site, Great Britain and India were the most common countries of origin (making up just under 13% of all job seekers abroad each).
The most common current occupations among all foreign job seekers were education & instruction (8.7%), management (8.5%), and food preparation & service (7.7%). Notably, while healthcare employers are most likely to advertise visa or green card sponsorship, the foreign and domestic job seekers searching for jobs that offer such immigration benefits are more concentrated in other sectors.
Looking ahead
More-restrictive immigration policies have recently been proposed or implemented, including increased scrutiny of authorized immigrants, detainment of unauthorized immigrants, and termination of the CHNV Parole Program. It remains to be seen whether more foreign-born job seekers will search for jobs offering immigration support (possibly to attain more stability in their immigration status), or if there might be a decline in such searches as foreign-born job seekers feel more of a policy-induced chill.
As of now, these policies have had a limited impact on the foreign-born labor force, but early signs of decline are beginning to surface. Attempts by other countries to attract foreign-born skilled workers in the U.S., such as Canada’s H-1B visa holder work permit, have historically only seen limited follow-through, suggesting that the U.S. remains a preferred destination for global talent.
Methodology
On data privacy: To protect workers’ personal information, all datasets are stripped of identifying information, including names and addresses. Results are only reported in an aggregated format. Analysis and data review are also performed to ensure that data points cannot be tied back to individuals.
For this analysis, we utilized Indeed’s pool of hundreds of millions of job seeker profiles to identify job seekers-+ who searched for visa sponsorship-related terms, which include the following keywords: “h1b,” “greencard,” “green card,” “h-1b,” “h 1b,” “f1,” “eb2,” “eb3,” “h2a,” “h 2a,” “h2b,” “h 2b,” “j1,” and “work visa.” To improve accuracy, we excluded searches that mentioned a selected list of commonly searched non-U.S. countries to avoid capturing interest in sponsorship opportunities outside the U.S.
Data on Indeed job postings are presented as an index of the number of unique job postings in a given month. February 2020 is used as the pre-pandemic baseline, with the index set to 100 in that month. For the visa and green card sponsorship analysis, we calculate the daily share of U.S. job postings that mention visa or green card sponsorship attributes and then compute the monthly average of those daily shares.
The number of job postings on Indeed.com, whether related to paid or unpaid job solicitations, is not indicative of potential revenue or earnings of Indeed, which comprises a significant percentage of the HR Technology segment of its parent company, Recruit Holdings Co., Ltd. Job posting numbers are provided for information purposes only and should not be viewed as an indicator of performance of Indeed or Recruit. Please refer to the Recruit Holdings investor relations website and regulatory filings in Japan for more detailed information on revenue generation by Recruit’s HR Technology segment.