Key Points:
- Job seekers started their annual post-holiday searches shortly after New Year’s, and by Jan. 29, search levels were 22% above Dec. 10 levels.
- The overall level of job postings has remained steady for months. Still, there are signs that postings in sectors that typically offer more remote opportunities are starting to rebound after years of declines.
Our monthly Labor Market Update examines important trends using Indeed and other labor market data. Our US Labor Market Overview chartbook provides a more comprehensive view of the US labor market. Data from our Job Postings Index — which stood 11% above its pre-pandemic baseline as of Jan. 31 — and the Indeed Wage Tracker (including sector-level data) are regularly updated and can be accessed on our data portal.
US job seekers enter 2025 with optimism despite little movement in the overall number of jobs actually available, a historically low unemployment rate, and a quits rate that has stubbornly stayed below pre-pandemic levels for more than a year. In what has now become an established pattern, job seekers’ searches for new opportunities on Indeed sagged over the holidays but sprang back once the calendar turned to 2025.
The level of job searches fell by 32% between Dec. 10 and Christmas Day as job seekers turned their attention away from the job market and towards the holiday festivities. However, job seekers began returning to the search bar by Jan. 3, and by Jan. 29, job search volume had rebounded to 22% above Dec. 10 levels. This year’s New Year’s jump in search activity was on par with the past few years.

This annual bump in search activity around New Year’s is generally a positive sign for the market — it seems that no matter what state the economy is in, finding a new job remains a perennially popular New Year’s resolution (with the exception of the 2020-2021 season, when COVID-19 fears were at their peak). It also suggests that job seekers’ interest in finding new employment remains steady. However, it will likely lead to more competition for a pool of available jobs that has not meaningfully grown much over the past few months. And given low unemployment and anemic quits, it’s likely that the majority of searches are coming from people already employed.
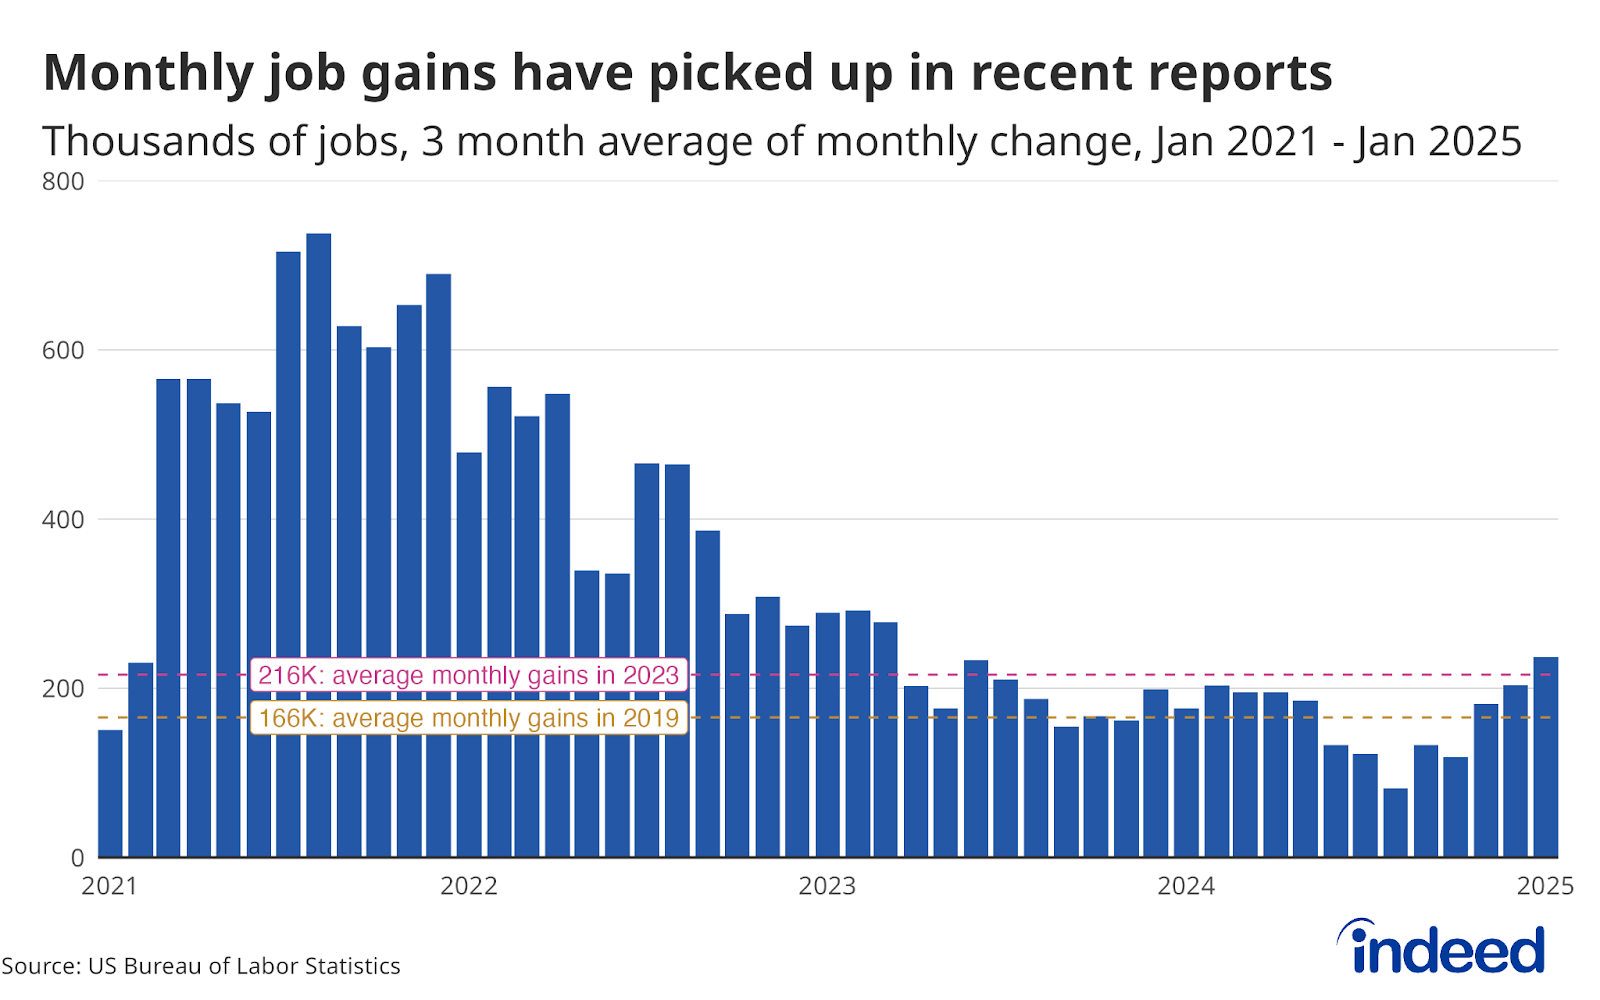
The quits rate hit new highs in 2022 as the post-COVID economy began re-opening in earnest, and workers were quick to seize new opportunities. But it soon began falling and dipped below pre-pandemic norms in mid-2024, where it has since stayed, currently hovering around 2% in 2025. The quits rate is a closely eyed indicator of job seekers’ faith in their ability to leave one job and confidently find another, and any uptick is likely to be welcomed by economists and policymakers alike as a sign of a balanced job market.

But while job seekers’ New Year’s interest in new opportunities remains robust, the overall level of available jobs has been largely unchanged since Halloween. On Oct. 24, the level of job postings stood 8.5% above the immediate, pre-pandemic level on Feb. 1, 2020. The overall level of postings did subsequently climb (modestly), but has hovered between 10-12% above pre-pandemic levels since November. As of Feb. 7, posting volume was 10.2% higher than on Feb 1, 2020. In prior years, the level of postings compared to pre-pandemic levels was typically much higher, a sign of more opportunities available for the annual influx of job seekers.

However, there are some encouraging signs behind the overall stagnant growth in postings. Every year, postings in professional sectors that typically offer more remote-work opportunities tend to have the largest holiday dip and New Year’s rebound, and this year is no exception. And while this year’s rebound itself is modest, not quite returning to pre-holiday levels, it is the highest it’s been in two years. It is a good sign for knowledge workers that the level of these high-remote job postings is inching back towards pre-pandemic levels after falling well short of that mark in both 2022-2023 and 2023-2024.
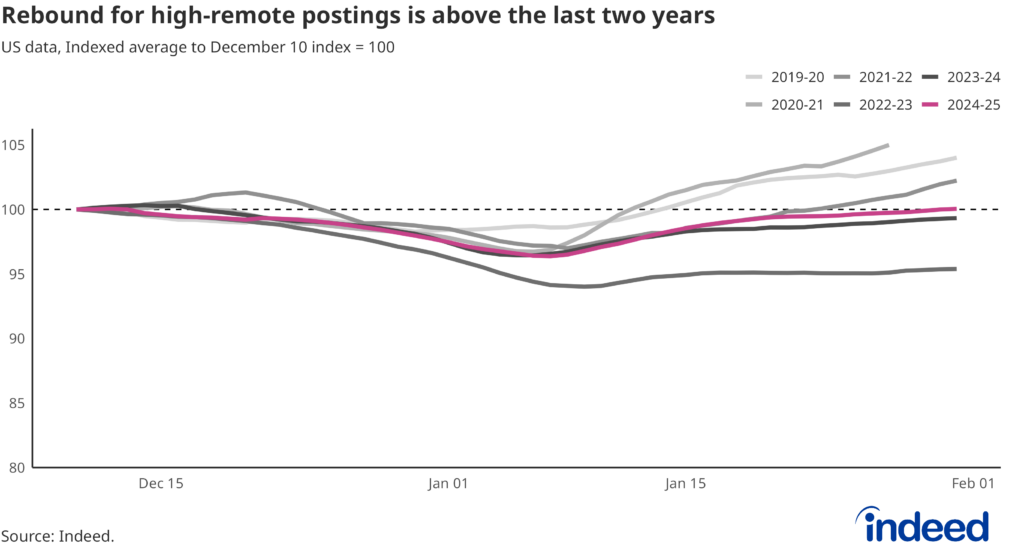
Overall, job postings in high-remote sectors are still down year-over-year — hovering at -.07% — but are trending upward.

Conclusion
The new year means a fresh start for many job seekers, but whether or not those searches translate into more people finding new jobs remains to be seen. On the postings side, job advertisements are still above pre-pandemic levels overall, and high-remote, professional sectors are now trending upward after years of steady declines. These increases may be small, but they’re on the right track.
Methodology
The remote/hybrid tiers of occupational sectors were determined by sorting each sector by their average remote/hybrid share of job postings in 2023. The sectors are then split into three tiers, each covering one-third of job postings in 2023.
US searches on Indeed included queries on both the desktop and mobile versions of Indeed.
Data on non-seasonally adjusted Indeed job postings are an index of the number of job postings on a given day, using a seven-day trailing average. February 1, 2020, is our pre-pandemic baseline, so the index is set to 100 on that day. Data for several dates in 2021 and 2022 are missing and were interpolated.
The number of job postings on Indeed.com, whether related to paid or unpaid job solicitations, is not indicative of potential revenue or earnings of Indeed, which comprises a significant percentage of the HR Technology segment of its parent company, Recruit Holdings Co., Ltd. Job posting numbers are provided for information purposes only and should not be viewed as an indicator of performance of Indeed or Recruit. Please refer to the Recruit Holdings investor relations website and regulatory filings in Japan for more detailed information on revenue generation by Recruit’s HR Technology segment.