You can find our detailed post breaking down the methodology used for our Remote Tracker here.
Methodology: Monitoring Trends in Remote And/or Hybrid Jobs With Indeed Data
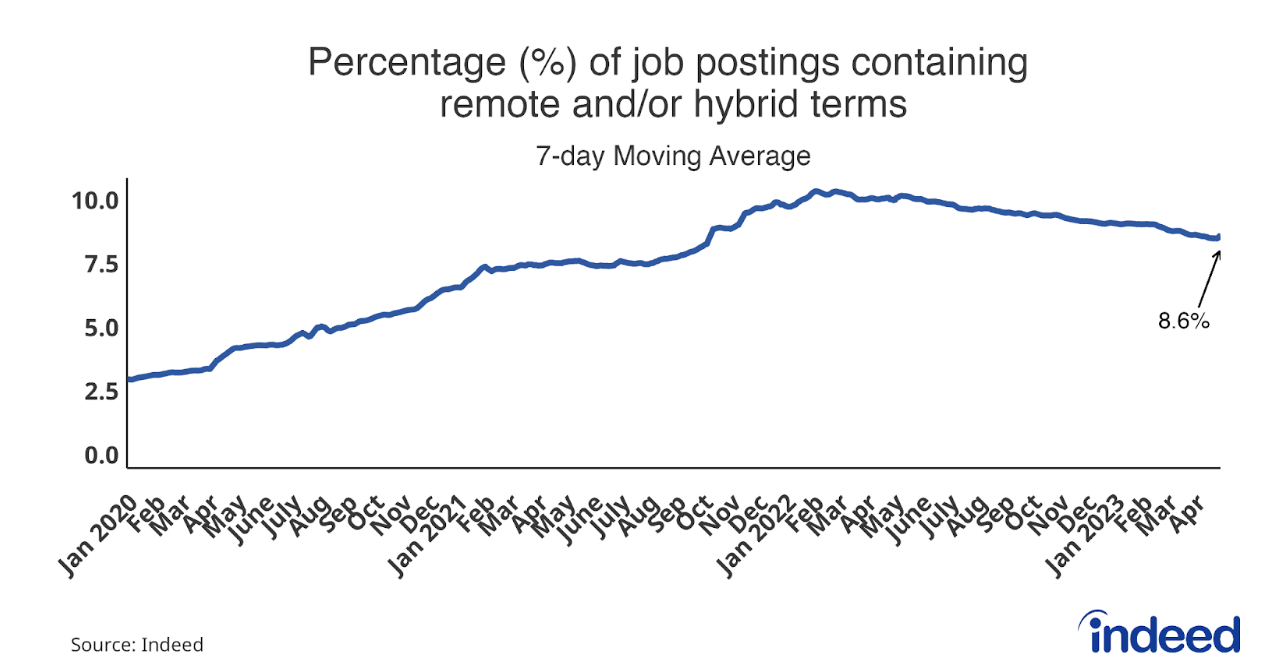
The methodology behind this re-released series expands upon the definition of remote work previously used to construct the Remote Job Tracker, and now includes terms more generally associated with hybrid and flexible work arrangements.
June 28, 2023
This is a carousel with 2 slides. Use arrow keys to navigate.